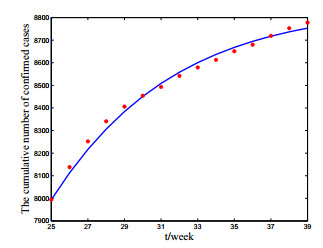
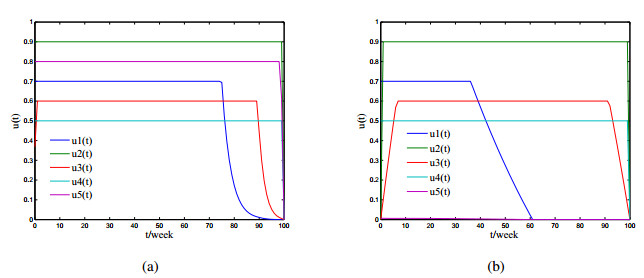
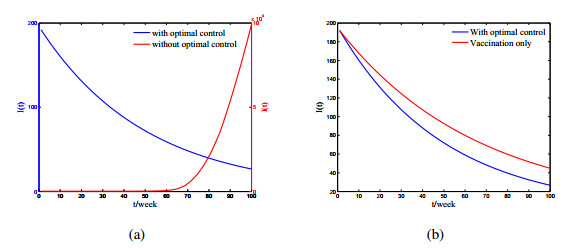
In this paper, we consider a cholera infection model with vaccination and multiple transmission pathways. Dynamical properties of the model are analyzed in detail. It is shown that the disease-free equilibrium is globally asymptotically stable if the basic reproduction number is less than unity; the endemic equilibrium exists and is globally asymptotically stable if the basic reproduction number is greater than unity. In addition, the model is successfully used to fit the real disease situation of cholera outbreak in Somalia. We consider an optimal control problem of cholera transmission with vaccination, quarantine, treatment and sanitation control strategies, and use Pontryagin's minimum principle to determine the optimal control level. The optimal control problem is solved numerically.
Citation: Chenwei Song, Rui Xu, Ning Bai, Xiaohong Tian, Jiazhe Lin. Global dynamics and optimal control of a cholera transmission model with vaccination strategy and multiple pathways[J]. Mathematical Biosciences and Engineering, 2020, 17(4): 4210-4224. doi: 10.3934/mbe.2020233
In this paper, we consider a cholera infection model with vaccination and multiple transmission pathways. Dynamical properties of the model are analyzed in detail. It is shown that the disease-free equilibrium is globally asymptotically stable if the basic reproduction number is less than unity; the endemic equilibrium exists and is globally asymptotically stable if the basic reproduction number is greater than unity. In addition, the model is successfully used to fit the real disease situation of cholera outbreak in Somalia. We consider an optimal control problem of cholera transmission with vaccination, quarantine, treatment and sanitation control strategies, and use Pontryagin's minimum principle to determine the optimal control level. The optimal control problem is solved numerically.

| [1] | A. Alam, R. C. LaRocque, J. B. Harris, C. Vanderspurt, E. T. Ryan, F. Qadri, et al., Hyperinfectivity of human-passaged Vibrio cholerae can be modeled by growth in the infant mouse, Infect. Immun., 73 (2005), 6674-6679. |
| [2] |
A. A. King, E. L. Lonides, M. Pascual, M. J. Bouma, Inapparent infections and cholera dynamics, Nature, 454 (2008), 877-880. doi: 10.1038/nature07084

|
| [3] | T. R. Hendrix, The pathophysiology of cholera, Bull. N. Y. Acad. Med., 47 (1971), 1169-1180. |
| [4] | M. Ghosh, P. Chandra, P. Sinha, J. B. Shukla, Modelling the spread of carrier dependent infectious diseases with environmental effect, Appl. Math. Comput., 152 (2004), 385-402. |
| [5] | World Health Organzation, 2019. Available from: http://www.emro.who.int/som/somalianews/cholera-vaccination-drive-begins-in-high-risk-districts-in-somalia.html?format=html. |
| [6] |
R. P. Sanches, C. P. Ferreira, R. A. Kraenkel, The role of immunity and seasonality in cholera epidemics, Bull. Math. Biol., 73 (2011), 2916-2931. doi: 10.1007/s11538-011-9652-6
|
| [7] |
R. R. Colwell, A. Huq, Environmental reservior of Vibrio cholerae, the causative agent of cholera, Ann. N.Y. Acad. Sci., 740 (1994), 44-53. doi: 10.1111/j.1749-6632.1994.tb19852.x
|
| [8] |
D. M. Hartley, J. G. Morris Jr, D. L. Smith, Hyperinfectivity: a critical element in the ability of V. cholerae to cause epidemics?, PLoS Med., 3 (2006), 63-69. doi: 10.1371/journal.pmed.0030063
|
| [9] | Z. Mukandavire, S. Liao, J. Wang, H. Gaff, D. L. Smith, J. G. Morris Jr, Estimating the reproductive numbers for the 2008-2009 cholera outbreak in Zimbabwe, Proc. Natl. Acad. Sci. USA, 108 (2011), 8767-8772. |
| [10] | D. S. Merrell, S. M. Butler, F. Qadri, N. A. Dolganov, A. Alam, M. B. Cohen, et al., Host-induced epidemic spread of the cholera bacterium, Nature, 417 (2002), 642-645. |
| [11] |
Z. Mukandavire, A. Tripathi, C. Chiyaka, G. Musuka, F. Nyabadza, H. G. Mwambi, Modelling and analysis of the intrinsic dynamics of cholera, Differ. Equ. Dyn. Syst., 19 (2011), 253-256. doi: 10.1007/s12591-011-0087-1
|
| [12] |
E. J. Nelson, J. B. Harris, J. G. Morris, S. B. Calderwood, A. Camilli, Cholera transmission:the host, pathogen and bacteriophage dynamics, Nat. Rev. Microbiol., 7 (2009), 693-702. doi: 10.1038/nrmicro2204
|
| [13] |
J. H. Tien, D. J. D. Earn, Multiple transmission pathways and disease dynamics in a waterborne pathogen model, Bull. Math. Biol., 72 (2010), 1506-1533. doi: 10.1007/s11538-010-9507-6
|
| [14] | World Health Organization, Cholera vaccines: WHO position paper, Weekly Epidemiol. Rec., 85 (2010), 117-128. |
| [15] |
C. Modnak, J. Wang, Z. Mukandavire, Simulating optimal vaccination times during cholera outbreaks, Int. J. Biomath., 7 (2014), 1450014. doi: 10.1142/S1793524514500144
|
| [16] |
C. Modnak, A model of cholera transmission with hyperinfectivity and its optimal vaccination control, Int. J. Biomath., 10 (2017), 1750084. doi: 10.1142/S179352451750084X
|
| [17] | X. H. Tian, R. Xu, J. Z. Lin, Mathematical analysis of a cholera infection model with vaccination strategy, Appl. Math. Comput., 361 (2019), 517-535. |
| [18] |
D. Posny, J. Wang, Z. Mukandavire, C. Modnak, Analyzing transmission dynamics of cholera with public health interventions, Math. Biosci., 264 (2015), 38-53. doi: 10.1016/j.mbs.2015.03.006
|
| [19] |
P. van den Driessche, J. Watmough, Reproduction numbers and sub-threshold endemic equilibria for compartmental models of disease transmission, Math. Biosci., 180 (2002), 29-48. doi: 10.1016/S0025-5564(02)00108-6
|
| [20] | M. Martcheva, An Introduction to Mathematical Epidemiology, Spinger, 2015. |
| [21] |
S. Oluwaseun, M. Tufail, Optimal control in epidemiology, Ann. Oper. Res., 251 (2017), 55-71. doi: 10.1007/s10479-015-1834-4
|
| [22] | World Health Organization, 2019. Available from: http://www.emro.who.int/healthtopics/cholera-outbreak/cholera-outbreaks.html. |
| [23] |
R. L. M. Neilan, E. Schaefer, H. Gaff, R. Fister, S. Lenhart, Modeling Optimal Intervention Strategies for Cholera, Bull. Math. Biol., 72 (2010), 2004-2018. doi: 10.1007/s11538-010-9521-8
|
| [24] |
S. Marino, I. B. Hogue, C. J. Ray, D. E. Kirschner, A methodology for performing global uncertainty and sensitivity analysis in systems biology, J. Theor. Biol., 254 (2008), 178-196. doi: 10.1016/j.jtbi.2008.04.011
|
Figures(6) / Tables(2)

Chenwei Song, Rui Xu, Ning Bai, Xiaohong Tian, Jiazhe Lin. Global dynamics and optimal control of a cholera transmission model with vaccination strategy and multiple pathways[J]. Mathematical Biosciences and Engineering, 2020, 17(4): 4210-4224. doi: 10.3934/mbe.2020233


 DownLoad: