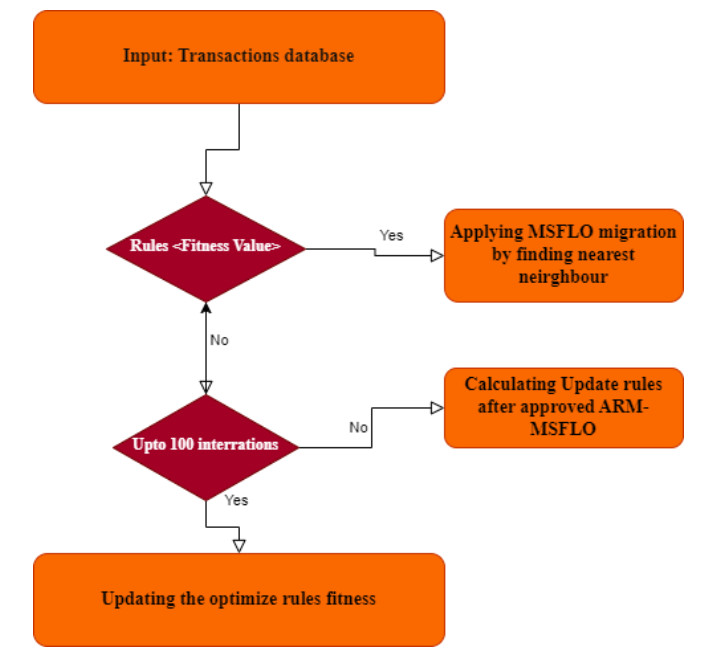
Association rule mining (ARM) is a technique for discovering meaningful associations within databases, typically handling discrete and categorical data. Recent advancements in ARM have concentrated on refining calculations to reveal connections among various databases. The integration of shuffled frog leaping optimization (SFLO) processes has played a crucial role in this pursuit. This paper introduces an innovative SFLO-based method for performance analysis. To generate association rules, we utilize the apriori algorithm and incorporate frog encoding within the SFLO method. A key advantage of this approach is its one-time database filtering, significantly boosting efficiency in terms of CPU time and memory usage. Furthermore, we enhance the optimization process's efficacy and precision by employing multiple measures with the modified SFLO techniques for mining such information.The proposed approach, implemented using MongoDB, underscores that our performance analysis yields notably superior outcomes compared to alternative methods. This research holds implications for fruit shape database mining, providing robust support for fruit class classification.
Citation: Ha Huy Cuong Nguyen, Ho Phan Hieu, Chiranjibe Jana, Tran Anh Kiet, Thanh Thuy Nguyen. Research on fruit shape database mining to support fruit class classification using the shuffled frog leaping optimization (SFLO) technique[J]. AIMS Mathematics, 2024, 9(7): 19495-19514. doi: 10.3934/math.2024950
Association rule mining (ARM) is a technique for discovering meaningful associations within databases, typically handling discrete and categorical data. Recent advancements in ARM have concentrated on refining calculations to reveal connections among various databases. The integration of shuffled frog leaping optimization (SFLO) processes has played a crucial role in this pursuit. This paper introduces an innovative SFLO-based method for performance analysis. To generate association rules, we utilize the apriori algorithm and incorporate frog encoding within the SFLO method. A key advantage of this approach is its one-time database filtering, significantly boosting efficiency in terms of CPU time and memory usage. Furthermore, we enhance the optimization process's efficacy and precision by employing multiple measures with the modified SFLO techniques for mining such information.The proposed approach, implemented using MongoDB, underscores that our performance analysis yields notably superior outcomes compared to alternative methods. This research holds implications for fruit shape database mining, providing robust support for fruit class classification.

| [1] |
D. Yadav, C. R. Chowdary, OOIMASP: Origin based association rule mining with order independent mostly associated sequential patterns, Expert Syst. Appl., 93 (2018), 62–71. https://doi.org/10.1016/j.eswa.2017.10.015 doi: 10.1016/j.eswa.2017.10.015

|
| [2] | Z. Zhang, W. Pedrycz, J. Huang, Efficient mining product-based fuzzy association rules through central limit theorem, Appl. Soft Comput., 63 (2018), 235–248. |
| [3] |
L. T. Nguyen, N. T. Nguyen, B. Vo, H. S. Nguyen, Efficient method for updating class association rules in dynamic datasets with record deletion, Appl. Intell., 48 (2018), 1491–1505. https://doi.org/10.1007/s10489-017-1023-z doi: 10.1007/s10489-017-1023-z
|
| [4] |
L. T. Nguyen, B. Vo, L. T. Nguyen, P. Fournier-Viger, A. Selamat, ETARM: An efficient top-k association rule mining algorithm, Appl. Intell., 48 (2018), 1148–1160. https://doi.org/10.1007/s10489-017-1047-4 doi: 10.1007/s10489-017-1047-4
|
| [5] |
L. Wang, J. Meng, P. Xu, K. Peng, Mining temporal association rules with frequent itemsets tree, Appl, Soft Comput., 62 (2018), 817–829. https://doi.org/10.1016/j.asoc.2017.09.013 doi: 10.1016/j.asoc.2017.09.013
|
| [6] |
Y. Xu, H. Zhou, J. Zhou, Application of deep learning for marine object detection, Ocean Eng., 235 (2023), 115839. https://doi.org/10.1016/j.oceaneng.2023.115839 doi: 10.1016/j.oceaneng.2023.115839
|
| [7] |
R. Zou, J. Li, M. Li, L. Zhang, Z. Wei, Underwater wireless sensor networks: A survey on enabling technologies, localization protocols, and potential applications, J. Marine Sci. Eng., 11 (2023), 534. https://doi.org/10.3390/jmse11030534 doi: 10.3390/jmse11030534
|
| [8] |
W. Altaf, M. Shahbaz, A. Guergachi, Applications of association rule mining in health informatics: A survey, Artif. Intell. Rev., 47 (2017), 313–340. https://doi.org/10.1007/s10462-016-9483-9 doi: 10.1007/s10462-016-9483-9
|
| [9] |
R. Agarwal, Ordering policy and inventory classification using temporal association rule mining, Int. J. Product. Manag. Assess. Technol., 6 (2018), 37–49. http://doi.org/10.4018/IJPMAT.2018010103 doi: 10.4018/IJPMAT.2018010103
|
| [10] |
N. Kawaria, R. Patidar, N. V. George, Parameter estimation of MIMO bilinear systems using a Levy shuffled frog leaping algorithm, Soft Comput., 21 (2017), 3849–3858. https://doi.org/10.1007/s00500-016-2035-z doi: 10.1007/s00500-016-2035-z
|
| [11] | R. V. Mane, V. R. Ghorpade, Association Rule Mining for Finding Admission Tendency of Engineering Student with Pattern Growth Approach, In: V. Aggarwal, V. Bhatnagar, D. Mishra, (eds), Big Data Analytics, Advances in Intelligent Systems and Computing, vol 654. Springer, Singapore, 2018. https://doi.org/10.1007/978-981-10-6620-7_73 |
| [12] | M. Moazzami, G.B. Gharehpetian, H. Shahinzadeh, S.H. Hosseinian, Optimal locating and sizing of DG and D-STATCOM using Modified Shuffled Frog Leaping Algorithm, In Swarm Intelligence and Evolutionary Computation (CSIEC), 2017 2nd Conference on, IEEE, 54-59. https://doi.org/10.1109/CSIEC.2017.7940157 |
| [13] |
R. Rekik, I. Kallel, J. Casillas, A.M. Alimi, Assessing web sites quality: A systematic literature review by text and association rules mining, Int. J. Inf. Manage., 38 (2018), 201–216. https://doi.org/10.1016/j.ijinfomgt.2017.06.007 doi: 10.1016/j.ijinfomgt.2017.06.007
|
| [14] | G. G. Samuel, C. C. A. Rajan, Samuel, A Modified Shuffled Frog Leaping Algorithm for Long-Term Generation Maintenance Scheduling, In: Pant, M., Deep, K., Nagar, A., Bansal, J. (eds) Proceedings of the Third International Conference on Soft Computing for Problem Solving. Advances in Intelligent Systems and Computing, vol 258. Springer, New Delhi, 2014. https://doi.org/10.1007/978-81-322-1771-8_2 |
| [15] | K. Tyagi, S. Thakur, Predictive Classification of ECG Parameters Using Association Rule Mining, In Advances in Computer and Computational Sciences, Springer, Singapore (2018), 619–627. https://doi.org/10.1007/978-981-10-3773-3_60 |
| [16] |
C. J. Xue, W. J. Song, L. J. Qin, A spatiotemporal mining framework for abnormal association patterns in marine environments with a time series of remote sensing images, Int. J. Appl. Earth Obs., 38 (2015), 105–114. https://doi.org/10.1016/j.jag.2014.12.009 doi: 10.1016/j.jag.2014.12.009
|
| [17] |
K. E. Heraguemi, N. Kamel, H. Drias, Multi-swarm bat algorithm for association rule mining using multiple cooperative strategies, Appl. Intell., 45 (2016), 1021–1033. https://doi.org/10.1007/s10489-016-0806-y doi: 10.1007/s10489-016-0806-y
|
| [18] |
B. Subbulakshmi, C. Deisy, An improved incremental algorithm for mining weighted class-association rules, Int. J. Business Intell. Data Mining, 13 (2018), 291–308. https://doi.org/10.1504/IJBIDM.2018.088437 doi: 10.1504/IJBIDM.2018.088437
|
| [19] |
Y. He, C. Zhu, Z. He, C. Gu, J. Cui, Big data oriented root cause identification approach based on Axiomatic domain mapping and weighted association rule mining for product infant failure, Comput. Ind. Eng., 109 (2017), 253–265. https://doi.org/10.1016/j.cie.2017.05.012 doi: 10.1016/j.cie.2017.05.012
|
| [20] |
P. Kaur, S. Mehta, Resource provisioning and work flow scheduling in clouds using augmented Shuffled Frog Leaping Algorithm, J. Parallel Distr. Comput., 101 (2017), 41–50. https://doi.org/10.1016/j.jpdc.2016.11.003 doi: 10.1016/j.jpdc.2016.11.003
|
| [21] |
L. Wang, Q. Zhang, Y. Liu, Robust underwater target tracking using Kalman filtering with adaptive covariance estimation, Ocean Eng., 234 (2023), 115048. https://doi.org/10.1016/j.oceaneng.2023.115048 doi: 10.1016/j.oceaneng.2023.115048
|
| [22] | V. Rajpoot, A. Tiwari, B. Mishra, AMSFLO: Optimization based efficient approach for assosiation rule mining, Int. J. Comput. Sci. Inf. S., 16 (2018), 147–154. https://sites.google.com/site/ijcsis/ISSN1947-550 |
| [23] | U. Mlakar, M. Zorman, I. Fister Jr, I. Fister, Modified binary cuckoo search for association rule mining, J. Intell. Fuzzy Syst., (Preprint), 1–12. https://doi.org/10.3233/JIFS-16963 |
| [24] | R. Pears, Y. S. Koh, Weighted Association Rule Mining Using Particle Swarm Optimization, In: L. Cao, J. Z. Huang, J. Bailey, Y. S. Koh, J. Luo, (eds), New Frontiers in Applied Data Mining. PAKDD 2011, Lecture Notes in Computer Science(), vol 7104. Springer, Berlin, Heidelberg. https://doi.org/10.1007/978-3-642-28320-8_28 |
| [25] | H. H. C. Nguyen, D. H. Nguyen, V. L. Nguyen, T. T. Nguyen, Smart solution to detect images in limited visibility conditions based convolutional neural networks, In: Advances in Computational Collective Intelligence. ICCCI 2020. Communications in Computer and Information Science, 1287 (2020), 641–650. https://doi.org/10.1007/978-3-030-63119-2_52 |
| [26] |
N. H. H. Cuong, T. H. Trinh, P. Meesad, T. T. Nguyen, Improved YOLO object detection algorithm to detect ripe pineapple phase, J. Intell. Fuzzy Syst., 43 (2022), 1365–1381. https://doi.org/10.3233/JIFS-213251 doi: 10.3233/JIFS-213251
|
| [27] |
V. Pajić, M. Andrejić, M. Sternad, FMEA-QFD Approach for Effective Risk Assessment in Distribution Processes, J. Intell. Manag. Decis., 2 (2023), 46–56. https://doi.org/10.56578/jimd020201 doi: 10.56578/jimd020201
|
| [28] |
M. Abid, M. Saqlain, Utilizing Edge Cloud Computing and Deep Learning for Enhanced Risk Assessment in China's International Trade and Investment, Int J. Knowl. Innov Stud., 1 (2023), 1–9. https://doi.org/10.56578/ijkis010101 doi: 10.56578/ijkis010101
|
| [29] |
I. Badi, Z. Stević, M. B. Bouraima, Evaluating Free Zone Industrial Plant Proposals Using a Combined Full Consistency Method-Grey-CoCoSo Model, J. IndIntell., 1 (2023), 101–109. https://doi.org/10.56578/jii010203 doi: 10.56578/jii010203
|
| [30] |
Y. Du, J. L. Wang, J. G. Lu, Optimization of Magnetically Coupled Resonant Wireless Power Transfer Based on Improved Whale Optimization Algorithm, J. IndIntell., 1 (2023), 63–74. https://doi.org/10.56578/jii010105 doi: 10.56578/jii010105
|
| [31] | H. Cuong Nguyen, C. Jana, I. M. Hezam, H. Phan Hieu, N. Thanh Thuy, Identification of dragon trees and fruits in ham Thuan Bac growing areas, Phan Thiet city, Binh Thuan province, Vietnam, Heliyon, 10 (2024), e31233, ISSN 2405–8440. https://doi.org/10.1016/j.heliyon.2024.e31233 |


Figures(6) / Tables(9)

Ha Huy Cuong Nguyen, Ho Phan Hieu, Chiranjibe Jana, Tran Anh Kiet, Thanh Thuy Nguyen. Research on fruit shape database mining to support fruit class classification using the shuffled frog leaping optimization (SFLO) technique[J]. AIMS Mathematics, 2024, 9(7): 19495-19514. doi: 10.3934/math.2024950


 DownLoad: