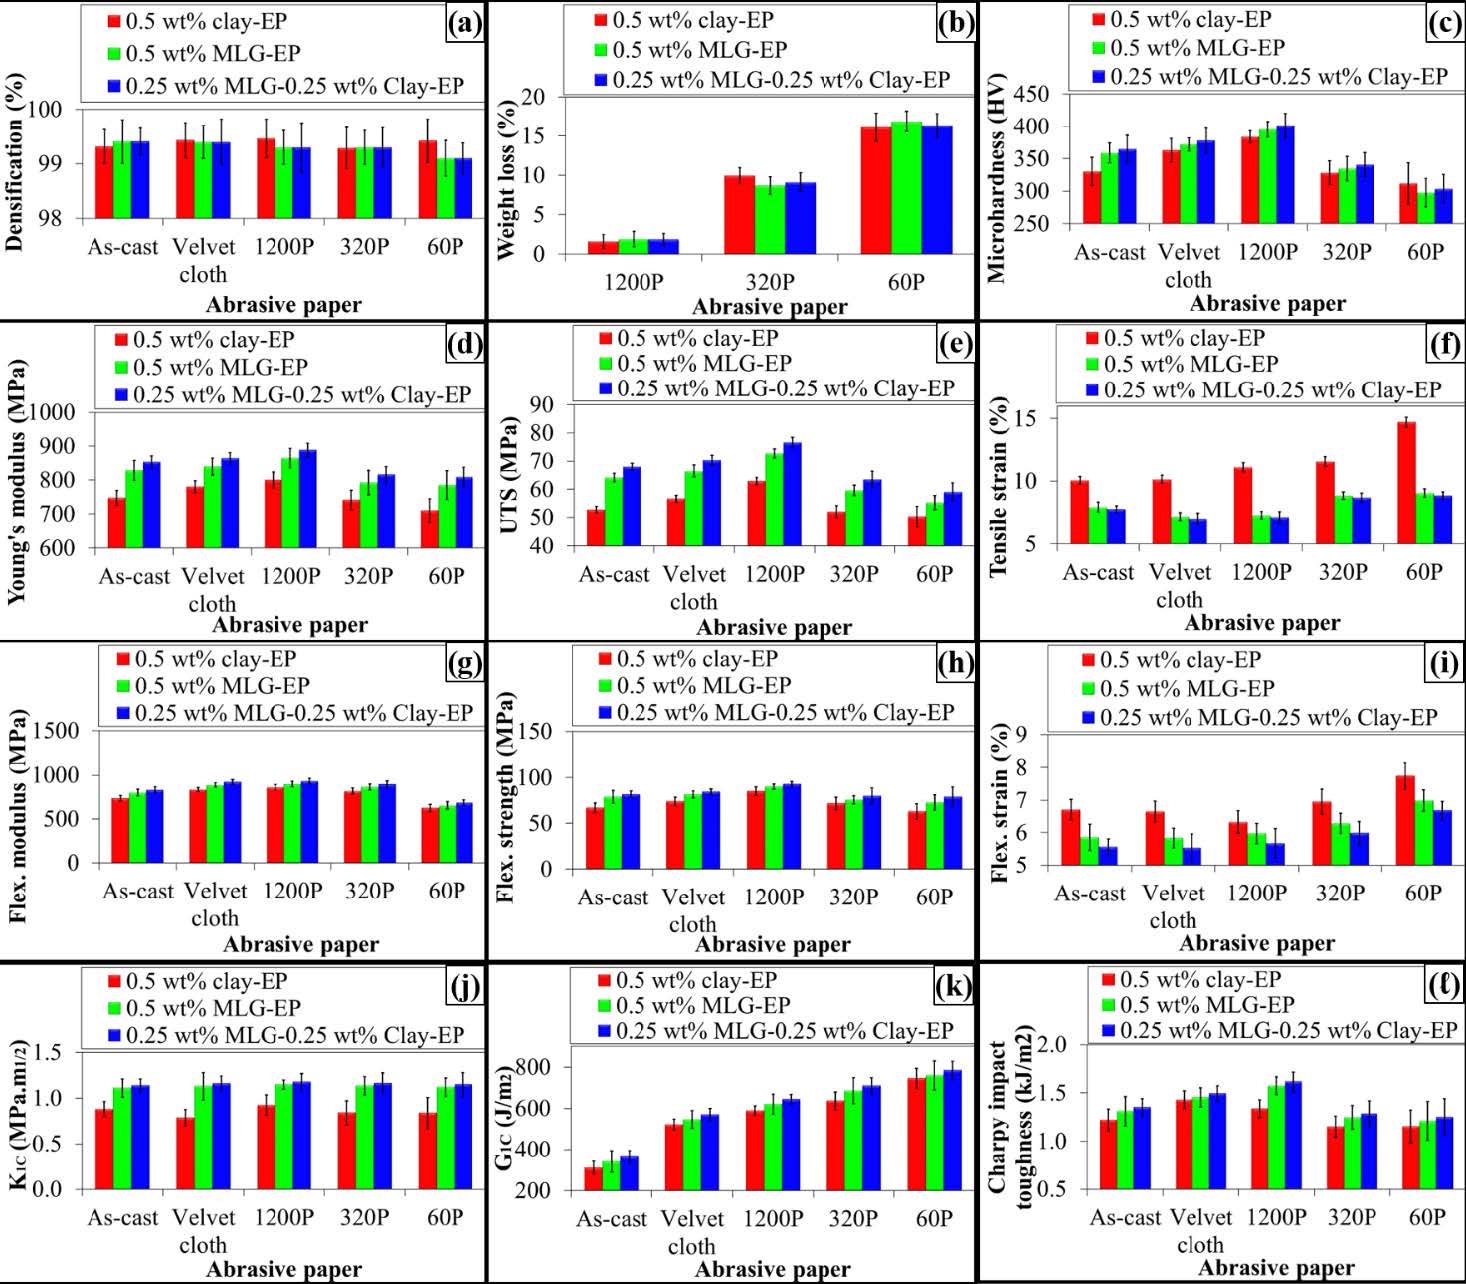
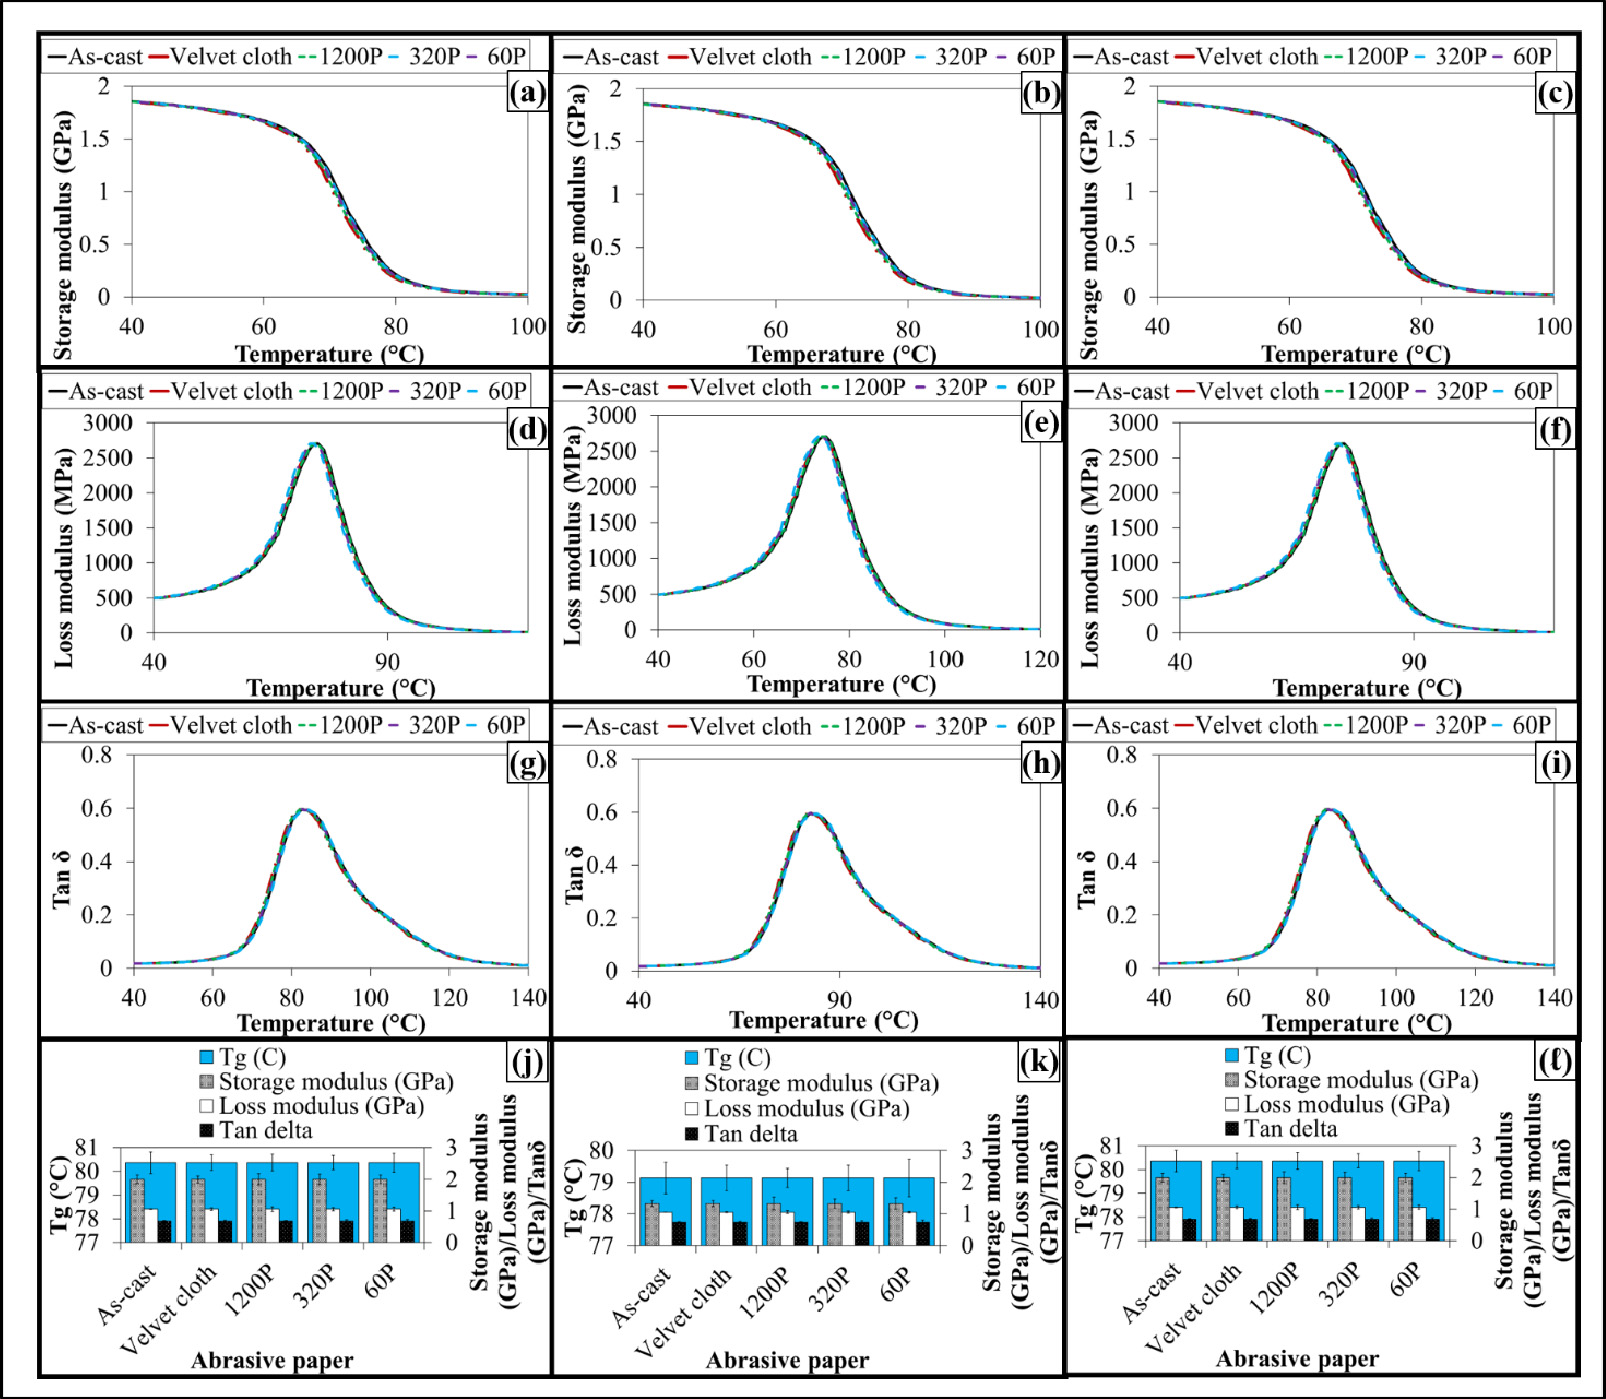
Citation: Rasheed Atif, Fawad Inam. Influence of macro-topography on mechanical performance of 0.5 wt%nanoclay/multi-layer graphene-epoxy nanocomposites[J]. AIMS Materials Science, 2016, 3(4): 1294-1308. doi: 10.3934/matersci.2016.4.1294
[1] | Rasheed Atif, Fawad Inam . Fractography analysis of 0.5 wt% multi-layer graphene/nanoclayreinforced epoxy nanocomposites. AIMS Materials Science, 2016, 3(3): 1266-1280. doi: 10.3934/matersci.2016.3.1266 |
[2] | Mohd Shahneel Saharudin, Rasheed Atif, Syafawati Hasbi, Muhammad Naguib Ahmad Nazri, Nur Ubaidah Saidin, Yusof Abdullah . Synergistic effects of halloysite and carbon nanotubes (HNTs + CNTs) on the mechanical properties of epoxy nanocomposites. AIMS Materials Science, 2019, 6(6): 900-910. doi: 10.3934/matersci.2019.6.900 |
[3] | Chaitra Srikanth, Gattumane Motappa Madhu, Hemanth Bhamidipati, Siddarth Srinivas . The effect of CdO–ZnO nanoparticles addition on structural, electrical and mechanical properties of PVA films. AIMS Materials Science, 2019, 6(6): 1107-1123. doi: 10.3934/matersci.2019.6.1107 |
[4] | Ahmed Ali Farhan Ogaili, Ehsan S. Al-Ameen, Mohammed Salman Kadhim, Muhanad Nazar Mustafa . Evaluation of mechanical and electrical properties of GFRP composite strengthened with hybrid nanomaterial fillers. AIMS Materials Science, 2020, 7(1): 93-102. doi: 10.3934/matersci.2020.1.93 |
[5] | Suman Chhetri, Pranab Samanta, Naresh Chandra Murmu, Suneel Kumar Srivastava, Tapas Kuila . Electromagnetic interference shielding and thermal properties of non-covalently functionalized reduced graphene oxide/epoxy composites. AIMS Materials Science, 2017, 4(1): 61-74. doi: 10.3934/matersci.2017.1.61 |
[6] | R. Daulath Banu, R. Karunanithi, S. Sivasankaran, B. Subramanian, Abdullah A. Alhomidan . Influence of graphene nanoplatelets (GNPs) and aluminum-carbon layered double hydroxides (Al-C LDH) in polypropylene matrix of hybrid composite structures on the microstructure and mechanical performances. AIMS Materials Science, 2024, 11(5): 882-917. doi: 10.3934/matersci.2024043 |
[7] | Mohammed Y. Abdellah, Ahmed Abdelhaleem, Ibrahim A. Alnaser, G. T. Abdel-Jaber, Abdalla Abdal-hay . Flexural, compression and fracture properties of epoxy granite as a cost-effective structure materials :new machine element foundation. AIMS Materials Science, 2021, 8(1): 82-98. doi: 10.3934/matersci.2021006 |
[8] | Nilesh Shahapure, Dattaji Shinde, Ajit Kelkar . Atomistic modeling and molecular dynamic simulation of polymer nanocomposites for thermal and mechanical property characterization: A review. AIMS Materials Science, 2023, 10(2): 249-287. doi: 10.3934/matersci.2023014 |
[9] | Chaitra Srikanth, G.M. Madhu, Shreyas J. Kashyap . Enhanced structural, thermal, mechanical and electrical properties of nano ZTA/epoxy composites. AIMS Materials Science, 2022, 9(2): 214-235. doi: 10.3934/matersci.2022013 |
[10] | Omar Hassan Mahmood, Mustafa Sh. Aljanabi, Farouk M. Mahdi . Effect of Cu nanoparticles on microhardness and physical properties of aluminum matrix composite prepared by PM. AIMS Materials Science, 2025, 12(2): 245-257. doi: 10.3934/matersci.2025013 |
The tribological protection of stiff technical polymers, such as epoxy, is finding proliferating interest to employ them in mechanical engineering applications [1,2,3,4,5]. To grasp phenomenological understanding of tribology and fracture mechanics, it is of foremost importance to study the interplay between topographical features and bulk properties [6]. To improve the wear resistance of monolithic polymers, surface coatings are applied. It is because the preferential growth of crystallites in subsequent deposition closes the cracks and gives the option to tailor the topographical features as per the design/service requirements [7,8,9,10]. Various coating techniques include galvanic/electrochemical deposition and plasma and thermal spraying that can yield thick coatings of high load support [11].
The mechanical performance of polymers can be significantly improved with the incorporation of nano-fillers [5,12,13,14]. When multiple nano-fillers are dispersed in the polymer matrix, synergistic effects come into play [15]. Due to synergistic effects, the dispersion state of hybrid nano-fillers gets better than when single nano-filler is used. It helps improve the physical and mechanical performance of hybrid nanocomposites. Sumfleth et al. [15] produced MWNT-epoxy nanocomposites and doped the system with titania. They reported that the dispersion state of nano-fillers improved in the multiphase nanocomposites. Similarly, Ma et al. [16] produced CNT-acrylonitrile butadiene styrene (ABS) nanocomposites and doped them with nanoclay. They also observed a better dispersion state of nano-fillers. It was further reported that nanoclay is also effective in improving the dispersion state of CNT in CNT-polyamide nanocomposites. It was concluded that titania can enhance the dispersion state more than that by block copolymers. A large volume fraction of CNT can be uniformly dispersed by using titania. The extent of improvement in dispersion state of a nano-filler by another nano-filler is dependent on the extent of synergistic effects caused by hybrid nano-fillers.
The mechanical interlocking can improve the interfacial interactions in the nanocomposites [17]. Mechanical interlocking takes place when the ribs, asperities, and protrusions lock with each other resulting in stronger interfacial interactions. In addition, the capillary wetting of the fillers by the polymers can be enhanced by making the fillers more hairy, rough, and hierarchical [18]. Due to the polymer wetting and mechanical interlocking of fillers with rough surfaces, the fiber-matrix interphase is strengthened by local reinforcement [19]. As the topography is influential at the interphase level, similarly, the topography of bulk nanocomposites is of equal importance. At one side, it is important in tribological application as the co-efficient of friction is significantly dependent upon the surface condition [20,21,22,23]. On the other side, the mechanical performance of sole nanocomposites is also dependent on topography. When the surfaces contain notches, the notches generate triaxial state of stress under which the mechanical performance severely degrades [24]. Therefore, detailed observation of the influence of topography on mechanical performance of (hybrid) nanocomposites is essential. To the authors’best knowledge, no article is yet published relating the topography, synergistic effects, dispersion state of fillers and mechanical performance of nanocomposites.
In this work, 0.5 wt% MLG/nanoclay-EP nanocomposites were processed with abrasive papers to modify the topography. Three different systems were produced: 0.5 wt% MLG-EP, 0.5 wt% nanoclay-EP, and 0.25 wt% MLG-0.25 wt% nanoclay-EP. The influence of synergistic effect on the mechanical performance in case of hybrid nanocomposites is also studied. The topography was measured using an Alicona optical microscope. The dynamic mechanical performance, mechanical performance and their variation with topography of nanocomposites were studied. The results indicated that the topography has a significant impact on the above-stated properties of 0.5 wt% MLG/nanoclay-EP nanocomposites. In addition, it was observed that mechanical performance of hybrid nanocomposites did not show a marked difference suggesting that synergistic effects are not strong enough in MLG and nanoclay.
MLG (99.2% purity, 80 m2/g specific surface area, 4.5 µm average lateral size, 12 nm average thickness) used was purchased from Graphene Supermarket, USA. Halloysite nanoclay was used as second filler and purchased from Sigma-Aldrich. The diameter of the nanoclay is between 30-70 nm with length 1-4 µm and has a tube-like morphology. The density of the nanoclay is 2.53 g/cm3 and surface area is 64 m2/g. It has low electrical and thermal conductivities and strong hydrogen interactions, on account of which the inner hydroxyl groups show greater stability than the surface hydroxyl groups. The tube-like morphology, high aspect ratio, and low percolation make halloysite nanoclay a potential reinforcement for epoxy and other polymers. The epoxy and hardeners used were based on bisphenol A-epichlorohydrin and dimethylbenzylamine isophorone diamine, respectively. The resin was purchased from Polyfibre, UK. The densities of liquid epoxy and hardener were~1.3 g/cm3 and~1.1 g/cm3, respectively.
The fillers were dispersed in resin for 3 h using tip sonicator (Model VC 750, Vibra-cell, USA, 750 W, 250 kHz). The epoxy and hardener were degassed in separate beakers for 1 h. The mixing ratio of hardener:epoxy was 1:2 by weight. Following thorough hand mixing for 10 min, resin was again degassed for 15 min. Silicone molds were used to cast the samples. Samples were initially cured at room temperature (6 h), and to ensure proper crosslinking, post-curing was carried out at 150°C (overnight). The abrasive papers were used to treat bottom and top surfaces of samples on grinding wheels at 150 rpm.
ASTM Standard D792 (Equations 1 and 2) was used to measure densification. The densities of water, hardener, and epoxy were 0.9975, 1.1, and 1.3 g/cm3, respectively. Vickers microhardness was measured using Buehler Micromet II hardness tester (200 g, 10 s). Universal Testing Machine (Instron Model 3382) was used to conduct tensile test (ASTM D638, 4 mm thickness, Type-V geometry, 0.5 mm/min), three-point bending test (ASTM D790, 3×12.7×48 mm, 1.0 mm/min), and mode-I fracture toughness test (ASTM D5045, 36×6×3 mm, crack length 3 mm, 0.5 mm/min, Equations 3-5). ASTM standard D 6110 was used to measure Charpy impact toughness (specimen dimensions 64×12.7×3.2 mm with V-notch of 45°, 2.5 mm depth and 0.25 mm tip of radius) using Equation 6. The images of impactor head and sample placement are shown in Figure 1. The weight of impactor head was 400 g and length of impactor arm was 0.4 m. An Infinitefocus Alicona G4 optical microscope was employed to measure topography. The working principle of the microscope is focus-follow method which is a non-contact method. DMA (PerkinElmer, Model 8000, specimen dimensions 30×8×2.5 mm, temperature range of 60-180°C, rate of 5°C/min, 1 Hz frequency with 10 N force) was used to measure dynamic mechanical performance.
Experimentaldensity=WeightinAirWeightinAir−WeightinWater×Densityofwater | (1) |
Densification (%) =ExperimentalDensityTheoreticalDensity×100 | (2) |
K1C=Pmaxf(aw)BW1/2 | (3) |
f(a/w)=[(2+aw){0.0866+4.64(aw)−13.32(aw)2+14.72(aw)3−5.6(aw)4}](1−aw)3/2 | (4) |
G1c=K21c(1−v2)E | (5) |
Impacttoughness=mgh(cosβ-cosα)wt | (6) |
The topographical features of 0.5 wt% MLG-EP nanocomposites are shown in Figure 2. The roughness parameters were decreased by treatment with 1200P abrasive paper and velvet cloth while increased with 320P and 60P. Figure 2ai shows the micrograph of 0.5 wt% MLG-EP (as-cast) sample. The surface waviness (Figure 2aii) of the nanocomposites fluctuates in the range of ± 15 µm while the surface roughness (Figure 2aiii) fluctuates in the range of ± 40 µm. The surface roughness in as-cast samples is caused by the mold surface. From the roughness chart, pointed notches of depth of around 40 µm can be observed on the as-cast 0.5 wt% MLG-EP samples. The Gaussian distribution (Figure 2aiv) of surface roughness varies with dominant size fraction of 2%. The roughness profile (Figure 2av) indicates that the roughness mainly lies in the range of ± 40 µm with a deep notch (red region).
Figure 2bi shows the optical micrograph of 0.5 wt% MLG-EP sample processed with the velvet cloth. The waviness (Figure 2bii) fluctuates in the range of ± 13 µm while the surface roughness (Figure 2biii) fluctuates in the range of ± 35 µm. The Gaussian distribution (Figure 2biv) indicates a nearly uniform distribution of roughness size with dominant size fraction of 2%. The large variation in the surface roughness can be caused by the diamond paste which was used on the velvet cloth. The roughness profile (Figure 2bv) indicates that the surface roughness slightly decreased compared to as-cast sample (Figure 2av).
Figure 2ci shows the optical micrograph of 0.5 wt% MLG-EP nanocomposites processed with 1200P abrasive paper. The surface waviness (Figure 2cii) fluctuates in the range of ± 10 µm while the surface roughness (Figure 2ciii) fluctuates in the range of ± 10 µm. The roughness varies more rapidly than in as-cast samples and those processed with velvet cloth. However, the sharp notches have decreased. The Gaussian distribution (Figure 2civ) indicates that about uniform distribution of surface roughness was achieved with dominant size fraction of 2.2%. The roughness profile (Figure 2cv) shows that there are no deep surface notches.
Figure 2di shows that the micrograph of 0.5 wt% MLG-EP sample processed with 320P abrasive paper. The scratches of different orientation and size were produced. The waviness (Figure 2dii) fluctuates in the range of ± 20 µm while the roughness (Figure 2diii) fluctuates in the range of ± 50 µm. The Gaussian distribution (Figure 2div) indicates that the dominant roughness fraction is 1.4%. The roughness profile (Figure 2dv) shows that deep notches emerge on sample surface by treatment with 320P.
Figure 2ei shows the micrograph of 0.5 wt% MLG-EP sample processed with 60P paper. A coarse topography was achieved with high surface roughness. The waviness (Figure 2eii) fluctuates in the range of ± 30 µm while the surface roughness (Figure 2eiii) fluctuates in the range of ± 100 µm. The deep sharp notches can be seen which significantly affect the mechanical performance of nanocomposites. The Gaussian distribution (Figure 2eiv) indicates that dominant fraction of surface roughness is 1.2%. The surface profile (Figure 2ev) shows the coarse topography with abruptly changing roughness. Similar results were observed for 0.5 wt% nanoclay-EP (Figure 3) and 0.25 wt% MLG-0.25 wt% nanoclay-EP samples (Figure 4).
Figure 3ai shows the optical micrograph of as-cast 0.5 wt% clay-EP sample. The waviness (Figure 3aii) of the sample varies between ± 15 µm while the surface roughness (Figure 3aiii) varies between ± 40 µm. This surface roughness is coming from the mold surface. The surface roughness graph shows that pointed notches of about 40 µm are present on the as-cast 0.5 wt% clay-EP samples. The Gaussian distribution (Figure 3aiv) shows that the roughness size is distributed with dominant size fraction of 4%. The roughness profile (Figure 3av) shows that most of the roughness lies within ± 40 µm with a deep notch (red region).
Figure 3bi shows the optical micrograph of 0.5 wt% clay-EP sample treated with velvet cloth for 1 min (each side) on rotating wheels with rotational speed of 150 rpm. The waviness (Figure 3bii) varies between ± 15 µm while the surface roughness (Figure 3biii) varies between ± 35 µm. The Gaussian distribution (Figure 3biv) shows that the roughness size is nearly uniformly distributed with dominant size fraction of 1.8%. The large range of surface roughness can be explained on the basis of diamond paste. The diamond paste had average particle size of 3 µm. Therefore, remnant dispersed and agglomerated diamond particles contributed toward surface roughness. The roughness profile (Figure 3bv) shows that the surface roughness slightly decreased compared to as-cast sample (Figure 3av).
Figure 3ci shows the optical micrograph of 0.5 wt% clay-EP sample treated with abrasive paper 1200P. The waviness (Figure 3cii) varies between ± 10 µm while the surface roughness (Figure 3ciii) varies between ± 10 µm. The surface roughness fluctuates more quickly than in as-cast and velvet treated samples. However, the sharp notches have decreased. The Gaussian distribution (Figure 3civ) shows that a nearly uniform distribution of roughness was obtained with dominant size fraction of 2.2%. The roughness profile (Figure 3cv) shows that there are no deep surface notches.
Figure 3di shows that the optical micrograph of 0.5 wt% clay-EP sample treated with abrasive paper 320P. The scratches of different size and orientation can be observed. The waviness (Figure 3dii) varies between ± 2 0 µm while the surface roughness (Figure 3diii) varies between ± 50 µm. The Gaussian distribution (Figure 3div) shows that the dominant roughness fraction is 2%. The roughness profile (Figure 3dv) shows that deep notches emerge on sample surface by treatment with 320P.
Figure 3ei shows the optical micrograph of 0.5 wt% clay-EP sample treated with abrasive paper 60P. A coarse topography can be observed. The waviness (Figure 3eii) varies between ± 30 µm while the surface roughness (Figure 3eiii) varies between ± 100 µm. The deep pointed notches can be observed which can later influence the mechanical properties of the samples. The Gaussian distribution (Figure 3eiv) shows that dominant roughness fraction is 1.6%. The surface profile of larger sample (Figure 3ev) shows that coarse topography is present with abruptly changing roughness.
Figure 4ai shows the optical micrograph of as-cast 0.25 wt% MLG-0.25 wt% clay-EP sample. The waviness (Figure 4aii) of the sample varies between ± 15 µm while the surface roughness (Figure 4aiii) varies between ± 40 µm. This surface roughness is coming from the mold surface. The surface roughness graph shows that pointed notches of about 40 µm are present on the as-cast 0.25 wt% MLG-0.25 wt% clay-EP samples. The Gaussian distribution (Figure 4aiv) shows that the roughness size is distributed with dominant size fraction of 1%. The roughness profile (Figure 4av) shows that most of the roughness lies within ± 40 µm.
Figure 4bi shows the optical micrograph of 0.25 wt% MLG-0.25 wt% clay-EP sample treated with velvet cloth for 1 min (each side) on rotating wheels with rotational speed of 150 rpm. The waviness (Figure 4bii) varies between ± 15 µm while the surface roughness (Figure 4biii) varies between ± 35 µm. The Gaussian distribution (Figure 4biv) shows that the roughness size is nearly uniformly distributed with dominant size fraction of 2.2%. The large range of surface roughness can be explained on the basis of diamond paste. The diamond paste had average particle size of 3 µm. Therefore, remnant dispersed and agglomerated diamond particles contributed toward surface roughness. The roughness profile (Figure 4bv) shows that the surface roughness slightly decreased compared to as-cast sample (Figure 4av).
Figure 4ci shows the optical micrograph of 0.25 wt% MLG-0.25 wt% clay-EP sample treated with abrasive paper1200P. The waviness (Figure 4cii) varies between ± 10 µm while the surface roughness (Figure 4ciii) varies between ± 10 µm. The surface roughness fluctuates more quickly than in as-cast and velvet treated samples. However, the sharp notches have decreased. The Gaussian distribution (Figure 4civ) shows that a nearly uniform distribution of roughness was obtained with dominant size fraction of 2%. The roughness profile (Figure 4cv) shows that there are no deep surface notches.
Figure 4di shows that the optical micrograph of 0.25 wt% MLG-0.25 wt% clay-EP sample treated with abrasive paper 320P. The scratches of different size and orientation can be observed. The waviness (Figure 4dii) varies between ± 20 µm while the surface roughness (Figure 4diii) varies between ± 50 µm. The Gaussian distribution (Figure 4div) shows that the dominant roughness fraction is 1.4%. The roughness profile (Figure 4dv) shows that deep notches emerge on sample surface by treatment with 320P.
Figure 4ei shows the optical micrograph of 0.25 wt% MLG-0.25 wt% clay-EP sample treated with abrasive paper 60P. A coarse topography can be observed. The waviness (Figure 4eii) varies between ± 30 µm while the surface roughness (Figure 4eiii) varies between ± 100 µm. The deep pointed notches can be observed which can later influence the mechanical properties of the samples. The Gaussian distribution (Figure 4eiv) shows that dominant roughness fraction is 1.6%. The surface profile of larger sample (Figure 4ev) shows that coarse topography is present with abruptly changing roughness.
The variation in mechanical performance with topography is shown in Figure 5. The densification of samples (Figure 5a) was around 99.5% and weight loss by treating abrasive papers (Figure 5b) was highest in case of 60P abrasive paper (16%). The microhardness (Figure 5c) increased in case of nanocomposites processed with velvet cloth and 1200P paper decreased when samples were processed with 320P and 60P abrasive papers. The maximum microhardness was recorded in case of 0.25 wt% MLG-0.25 wt% caly-EP nanocomposites. The Young’s modulus (Figure 5d) increased in all cases when samples were processed with 1200P abrasive paper and velvet cloth. However, the stiffness decreased when the nanocomposites were processed with 320P and 60P abrasive papers. The values indicate that stiffness can be enhanced by processing the nanocomposites with velvet cloth and 1200P paper and decreased by processing the nanocomposites with 320P and 60P papers. The maximum increase in Young’s modulus was observed in case of 0.25 wt% MLG-0.25 wt% clay-EP nanocomposites and in case of nanocomposites processed with 1200P abrasive paper.
The UTS (Figure 5e) also increased in all cases when nanocomposites were processed with 1200P abrasive paper and velvet cloth. However, the stiffness decreased when the nanocomposites were processed with 60P and 320P abrasive papers. The values show that UTS can be improved by treating the nanocomposites with 1200P abrasive paper and velvet cloth and decreased by treating the nanocomposites with 60P and 320P abrasive papers. The maximum increase in UTS was observed in case of 0.25 wt% MLG-0.25 wt% clay-EP nanocomposites processed with 1200P abrasive paper.
The variation in tensile strain with topography is shown in Figure 5f. The tensile strain increased with high surface roughness values. It can be because of the reduction in strength and stiffness values. The treatment with velvet cloth did not show any visible change in tensile strain. However, the tensile strain slightly increased when the nanocomposites were processed with 1200P abrasive paper. Similar results were shown by nanocomposites when tested for flexural properties (Figure 5g-i). The values indicate that from the three compositions made with five surface conditions for each composition, the best combination of mechanical performance can be achieved in case of 0.25 wt% MLG-0.25 wt% clay-EP nanocomposites processed with 1200P abrasive paper.
The variation in fracture toughness (K1C) with topography is shown in Figure 5j. The K1C remained impervious to any variation in topography. However, the standard deviation is not the same. It can be explained on the basis of tip of notch. A razor blade was used to sharpen the tip of notch that may not crate tips of equal curvature and length. The other factor can be distribution, size, and volume fraction of porosity influencing the mechanical performance of nanocomposites. The variation in G1C with topography is shown in Figure 5k. The G1C increased with increasing surface roughness values. However, as K1C remained impervious to topography, therefore, the variation in G1C should not directly result from the variation in topography. was divided by stiffness to calculate G1C. As stiffness decreased with increasing surface roughness values, therefore, a high value of G1C resulted by increasing surface roughness. The variation in Charpy impact toughness with topography is shown in Figure 5ℓ. Although K1C remained impervious to any variation in topography, however, topography showed a pronounced impact on impact toughness indicating that topography is more influential under impact loading.
The variation in dynamic mechanical performance with topography is shown in Figure 6. The highest Tg was observed in case of 0.25 wt% MLG-0.25 wt% nanoclay-EP samples indicating that the nano-fillers have the ability to provide thermal stability by physically constricting the epoxy chains as well as by enhancing the dissipation of thermal flux [14]. The processing with papers has not influenced the dynamic mechanical performance of nanocomposites. It is because the dynamic mechanical performance is mainly dependent on the structure of sample. As treatment with abrasive papers did not change structure of the nanocomposites, therefore, it did not change the dynamic mechanical performance. It can further be concluded that surface notches up to ± 100 µm do not change the dynamic mechanical performance of nanocomposites.
The surface roughness of as-cast nanocomposites was ± 43 µm. The surface roughness of nanocomposites processedwith velvet cloth and 1200P paper became ± 33 µm and ± 13 µm, respectively. Therefore, the increase in UTS and modulus can be related to the decrease in surface roughness values. Hence, stiffness and strength of nanocomposites can be improved by treating them with 1200P abrasive paper and velvet cloth. Furthermore, the surface roughness values of nanocomposites, processed with 320P and 60P abrasive papers, became ± 52 µm and ± 103 µm, respectively. Therefore, the decrease in strength and stiffness of nanocomposites by treating them with 60P and 320P abrasive paper can be related to the increase in surface roughness. From the surface roughness values, and details of mechanical performance, it can be stated that the roughness up to about ± 20 µm is benign for mechanical performance of nanocomposites. Similarly, mechanical performance starts degrading when surface roughness exceeds ± 20 µm.
The K1C values of nanocomposites remained impervious to any variation in topography. It can be explained on the basis of loading axis, orientation and surface notches. The wider (bottom and top) surfaces of the nanocomposites were only processed with the abrasive papers. The thinner sides were not processed. Therefore, when bending loading was applied, the surfaces with coarse topography were oriented along the loading axis. The size of the sample notch (3 mm) was much bigger than the surface notches generated by the abrasive papers (±100 µm). Therefore, the orientation of surface notches with respect to loading axis and the relative size of surface notches with respect to sample notch could possibly be the reasons that K1C showed no variation with topography.
The increase in hardness can also be related to the variation in surface roughness. When surfaces are coarse, the indenter may sit at the edge of the ridge. In that case, less resistance will be observed by the material and hence low hardness will be recorded. This is a possible reason that low hardness was recorded in samples processed with 60P and 320P abrasive papers. On the other hand, when surfaces are smooth, strong resistance will be offered by the material against the penetration of indenter. In that case, high hardness will be observed. This could be the possible reason for high hardness observed in nanocomposites processed with 1200P abrasive paper and velvet cloth.
The treatment of 0.5 wt% MLG/nanoclay-EP nanocomposites with abrasive papers produced topographical features with disparate orientation of surface notches, their shape and size. It can arise from the variation in surface roughness and size distribution of particles of the papers employed. Another momentous related phenomenon can be the formation of crater [25]. When two surfaces are rubbed against each other, the extent of erosion depends on the roughness of the mating surfaces. Even the best polished surfaces show surface roughness at microscopic level [26]. When surfaces are smooth, the coefficient of friction is low. Hence, less erosion takes place. On the contrary, when the surfaces are coarse, the coefficient of friction is high. Hence, large erosion takes place. In addition to large erosion there is possibility that the debris formed may not find a way to escape. In that case, they get trapped in between the mating surfaces. These debris may coalesce due to mechanical interlocking and cold welding. If surface energy is taken into account, then reduction in free energy could be a reason for coalescence. The coalesced debris are pressed against the mating surface and result in the formation of deep crater. This crater may significantly degrade the mechanical performance of mating surfaces by causing stress concentration. Hence, roughness above certain threshold may significantly deteriorate mechanical performance of nanocomposites.
As air bubbles have lower density than that of epoxy, therefore, they tend to move out of the epoxy during curing. The velocity of air bubbles is directly proportional to the size of the air bubbles. Some of the air bubbles may escape the nanocomposites because of their higher velocity and proximity to the surface. However, those air bubbles that would not be able to escape will segregate near the surface such that the bigger bubbles will be closer to the surface than the smaller bubbles. The size of bigger bubbles may be large enough to cause a significant amount of stress concentration that can further cause deterioration in the mechanical performance. Therefore, removing the material from the surface will remove the areas with majority of defects. The presence of air bubble next to the surface can be witnessed in the literature [27]. Warrier et al. produced carbon nanotubes filled epoxy nanocomposites using vacuum bagging. They reported that air bubbles were concentrated on the edges of produced surfaces [27]. They further reported that CNT reinforced samples had more air bubbles than those without CNT [27]. Some of the authors have also shown that air bubbles are retained in nanocomposites produced using solution casting technique [13,28]. Once the surface material is removed, then not only the surface notches can be removed, but also the regions with the air bubbles. A similar technique is used to forge and cast metals and alloys. For example, forged steel contains scale at its surface arising from the reaction of iron with oxygen at high temperature which produces iron oxide. The forged steel parts are machined to remove undesired materials as well as to get surface of required finish. In a similar way, removing surface material may help improve mechanical performance of polymer nanocomposites.
The 0.5 wt% MLG/nanoclay-epoxy nanocomposites were successfully produced and surfaces of nanocomposites were processed with velvet cloth and various papers. The mechanical and dynamic mechanical performance was studied of surface modified nanocomposites. The surface roughness decreased by processing the nanocomposites with velvet cloth and 1200P abrasive paper and enhanced by 320P and 60P abrasive papers. The treatment with 1200P abrasive paper showed better results than other abrasive papers. The topography can significantly influence the mechanical performance of nanocomposites. The tensile properties start degrading when surface notches exceed ± 20 µm. However, flexural properties are less sensitive to topography than tensile properties and start degrading after ± 50 µm. The tensile strength of as-cast 0.5 wt% MLG-EP nanocomposites is 59 MPa while that of 0.5 wt% nanoclay-EP nanocomposites is 47 MPa. The flexural properties and microhardness showed similar trends. Therefore, it can be concluded that MLG is more influential than nanoclay in enhancing the mechanical performance of epoxy nanocomposites. The tensile strength of as-cast 0.25 wt% MLG-0.25 wt% nanoclay-EP nanocomposites is 63 MPa which is close to 0.5 wt% MLG-EP nanocomposites. Therefore, it can be concluded that synergistic effects are not prominent enough at 0.5 wt% to cause a significant improvement in mechanical performance of produced nanocomposites. The topographical features did not change the dynamic mechanical performance. Therefore, it can be concluded that dynamic mechanical performance is impervious to topographical features of nanocomposites (at least up to ± 100 µm).
The authors would like to thank the Department of Mechanical and Construction Engineering, Northumbria University, UK for the provision of research facilities, without which the analysis of relevant data was not possible.
All authors declare no conflict of interest.
[1] | Schuler M, Kunzler TP, De Wild M, et al. (2009) Fabrication of TiO2-coated epoxy replicas with identical dual-type surface topographies used in cell culture assays. J Biomed Mater Res A 88: 12–22. |
[2] | Lam CK, Lau KT (2007) Tribological behavior of nanoclay/epoxy composites. Mater Lett 61: 3863–3866. |
[3] | Yu S, Hu H, Ma J, et al. (2008) Tribological properties of epoxy/rubber nanocomposites. Tribol Int 41: 1205–1211. |
[4] | Xia S, Liu Y, Pei F, et al. (2015) Identical steady tribological performance of graphene-oxide-strengthened polyurethane/epoxy interpenetrating polymer networks derived from graphene nanosheet. Polymer 64: 62–68. |
[5] | Atif R, Inam F (2016) Modeling and simulation of graphene based polymer nanocomposites : Advances in the last decade. Graphene 96–142. |
[6] | Siegel R, Hu E, Roco M (1999) Nanostructure science and technology. A worldwide study. |
[7] | Pan G, Guo Q, Ding J, et al. (2010) Tribological behaviors of graphite/epoxy two-phase composite coatings. Tribol Int 43: 1318–1325. |
[8] | Brostow W, Dutta M, Rusek P (2010) Modified epoxy coatings on mild steel: Tribology and surface energy. Eur Polym J 46: 2181–2189. |
[9] | Zhang WH, Hsieh JH (2000) Tribological behavior of TiN and CrN coatings sliding against an epoxy molding compound. Surf Coatings Technol 130: 240–247. |
[10] | Chang L, Zhang Z, Ye L, et al. (2007) Tribological properties of epoxy nanocomposites: III. Characteristics of transfer films. Wear 262: 699–706. |
[11] | Lackner JM, Waldhauser W, Ganser C, et al. (2014) Mechanisms of topography formation of magnetron-sputtered chromium-based coatings on epoxy polymer composites. Surf Coatings Technol 241: 80–85. |
[12] | Atif R, Wei J, Shyha I, et al. (2016) Use of morphological features of carbonaceous materials for improved mechanical properties of epoxy nanocomposites. RSC Adv 6: 1351–1359. |
[13] | Atif R, Shyha I, Inam F (2016) The degradation of mechanical properties due to stress concentration caused by retained acetone in epoxy nanocomposites. RSC Adv 6: 34188–34197. |
[14] | Atif R, Shyha I, Inam F (2016) Modeling and experimentation of multi-layered nanostructured graphene-epoxy nanocomposites for enhanced thermal and mechanical properties. J Compos Mater 1–12. |
[15] | Sumfleth J, de Almeida Prado LAS, Sriyai M, et al. (2008) Titania-doped multi-walled carbon nanotubes epoxy composites: Enhanced dispersion and synergistic effects in multiphase nanocomposites. Polymer 49: 5105–5112. |
[16] | Ma H, Tong L, Xu Z, et al. (2007) Synergistic effect of carbon nanotube and clay for improving the flame retardancy of ABS resin. Nanotechnology 18: 14026–14029. |
[17] | Cotell CM, Sprague JA, Smidth FAJ (1994) ASM Handbook, Vol. 5. Surface Engineering, Published by ASM International, USA. |
[18] | Karger-Kocsis J, Mahmood H, Pegoretti A (2015) Recent advances in fiber/matrix interphase engineering for polymer composites. Prog Mater Sci 73: 1–43. |
[19] | Moon SI, Jang J (1999) Mechanical interlocking and wetting at the interface between argon plasma treated UHMPE fiber and vinylester resin. J Mater Sci 34: 4219–4224. |
[20] | Nardin M, Ward IM (1987) Influence of surface treatment on adhesion of polyethylene fibres. Mater Sci Technol 3: 814–826. |
[21] | Ladizesky NH, Ward IM (1989) The adhesion behaviour of high modulus polyethylene fibres following plasma and chemical treatment. J Mater Sci 24: 3763–3773. |
[22] | Woods DW, Ward IM (1993) Study of the oxygen treatment of high-modulus polyethylene fibres. Surf Interface Anal 20: 385–392. |
[23] | Tissington B, Pollard G, Ward IM (1991) A study of the influence of fibre/resin adhesion on the mechanical behaviour of ultra-high-modulus polyethylene fibre composites. J Mater Sci 26: 82–92. |
[24] | Engelke R, Engelmann G, Gruetzner G, et al. (2004) Complete 3D UV microfabrication technology on strongly sloping topography substrates using epoxy photoresist SU-8. Microelectron Eng 73–74: 456–462. |
[25] | Pitler RK, Langer EL (1995) ASM Handbook, Vol. 16. Machining. Published by ASM International, USA. |
[26] | Blau PJ (2001) ASM Handbook, Vol. 18. Friction, Lubrication, and Wear Technology. Published by ASM International, USA. |
[27] | Warrier A, Godara A, Rochez O, et al. (2010) The effect of adding carbon nanotubes to glass/epoxy composites in the fibre sizing and/or the matrix. Compos Part A—Appl S 41: 532–538. |
[28] |
Rasheed A, Khalid FA (2014) Fabrication and properties of CNTs reinforced polymeric matrix nanocomposites for sports applications. IOP Conf Ser Mater Sci Eng 60: 012009. doi: 10.1088/1757-899X/60/1/012009
![]() |
1. | Mohd Shahneel Saharudin, Syafawati Hasbi, Muhammad Naguib Ahmad Nazri, Fawad Inam, 2020, Chapter 11, 978-981-15-5752-1, 107, 10.1007/978-981-15-5753-8_11 | |
2. | Mohd Shahneel Saharudin, Jiacheng Wei, Islam Shyha, Fawad Inam, The Degradation of Mechanical Properties in Halloysite Nanoclay-Polyester Nanocomposites Exposed in Seawater Environment, 2016, 2016, 1687-4110, 1, 10.1155/2016/2604631 | |
3. | Mohd Saharudin, Rasheed Atif, Fawad Inam, Effect of Short-Term Water Exposure on the Mechanical Properties of Halloysite Nanotube-Multi Layer Graphene Reinforced Polyester Nanocomposites, 2017, 9, 2073-4360, 27, 10.3390/polym9010027 |