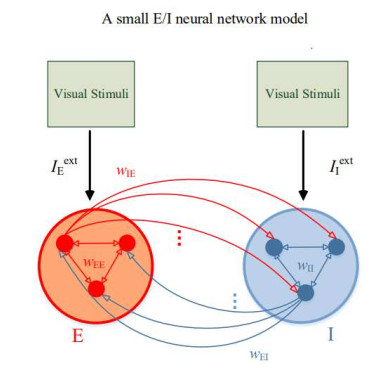
Experimental observations suggest that gamma oscillations are enhanced by the increase of the difference between the components of external stimuli. To explain these experimental observations, we firstly construct a small excitatory/inhibitory (E/I) neural network of IAF neurons with external current input to E-neuron population differing from that to I-neuron population. Simulation results show that the greater the difference between the external inputs to excitatory and inhibitory neurons, the stronger gamma oscillations in the small E/I neural network. Furthermore, we construct a large-scale complicated neural network with multi-layer columns to explore gamma oscillations regulated by external stimuli which are simulated by using a novel CUDA-based algorithm. It is further found that gamma oscillations can be caused and enhanced by the difference between the external inputs in a large-scale neural network with a complicated structure. These results are consistent with the existing experimental findings well.
Citation: Xiaochun Gu, Fang Han, Zhijie Wang, Kaleem Kashif, Wenlian Lu. Enhancement of gamma oscillations in E/I neural networks by increase of difference between external inputs[J]. Electronic Research Archive, 2021, 29(5): 3227-3241. doi: 10.3934/era.2021035
Experimental observations suggest that gamma oscillations are enhanced by the increase of the difference between the components of external stimuli. To explain these experimental observations, we firstly construct a small excitatory/inhibitory (E/I) neural network of IAF neurons with external current input to E-neuron population differing from that to I-neuron population. Simulation results show that the greater the difference between the external inputs to excitatory and inhibitory neurons, the stronger gamma oscillations in the small E/I neural network. Furthermore, we construct a large-scale complicated neural network with multi-layer columns to explore gamma oscillations regulated by external stimuli which are simulated by using a novel CUDA-based algorithm. It is further found that gamma oscillations can be caused and enhanced by the difference between the external inputs in a large-scale neural network with a complicated structure. These results are consistent with the existing experimental findings well.

| [1] |
Induced gamma activity in primary visual cortex is related to luminance and not color contrast: An MEG study. Journal of Vision (2008) 8: 1-7. 
|
| [2] |
Simultaneous recordings from the primary visual cortex and lateral geniculate nucleus reveal rhythmic interactions and a cortical source for gamma-band oscillations. Journal of Neuroscience (2014) 34: 7639-7644.
|
| [3] |
Mechanisms of gamma oscillations. Annu. Rev. Neurosci (2012) 35: 203-225.
|
| [4] | (2001) Theoretical Neuroscience: Computational and Mathematical Modeling of Neural Systems. Cambridge: MIT Press. |
| [5] |
Stability of synchronization under stochastic perturbations in leaky integrate and fire neural networks of finite size. Discrete Contin. Dyn. Syst. Ser. B (2019) 24: 5183-5201.
|
| [6] |
LFP power spectra in V1 cortex: The graded effect of stimulus contrast. Journal of Neurophysiology (2005) 94: 479-490.
|
| [7] |
Oscillatory synchronization in large-scale cortical networks predicts perception. Neuron (2011) 69: 387-396.
|
| [8] |
Cortical oscillations arise from contextual interactions that regulate sparse coding. Proc. Nat. Acad. Sci. USA (2014) 111: 6780-6785.
|
| [9] |
The columnar organization of the neocortex. Brain (1997) 120: 701-722.
|
| [10] |
A configurable simulation environment for the efficient simulation of large-scale spiking neural networks on graphics processors. Neural Networks (2009) 22: 791-800.
|
| [11] |
S. A. Neymotin, H. Lee, E. Park, A. A. Fenton and W. W. Lytton, Emergence of physiological oscillation frequencies in a computer model of neocortex, Front. Comput. Neurosci., 5 (2011), 19. doi: 10.3389/fncom. 2011.00019
|
| [12] |
Functionally independent columns of rat somatosensory barrel cortex revealed with voltage-sensitive dye imaging. Journal of Neuroscience (2001) 21: 8435-8446.
|
| [13] | W. H. Press, S. A. Teukolsky and W. T. Vetterling, Numerical recipes in C: The art of scientific computing, IEEE Concurrency, 6 (1992), 79. |
| [14] |
L. Sacerdote and M. T. Giraudo, Stochastic Integrate and Fire Models: A review on mathematical methods and their applications, Stochastic biomathematical models, Lecture Notes in Math., Math. Biosci. Subser., Springer, Heidelberg, 2058 (2013), 99–148. doi: 10.1007/978-3-642-32157-3_5
|
| [15] |
Subcortical source and modulation of the narrowband gamma oscillation in mouse visual cortex. Neuron (2017) 93: 315-322.
|
| [16] |
E. Wallace, M. Benayoun, W. van Drongelen and J. D. Cowan, Emergent oscillations in networks of stochastic Spiking Neurons, PLOS ONE, 6 (2011). doi: 10.1371/journal. pone. 0014804
|
| [17] | A novel parallel clock-driven algorithm for simulation of neuronal networks based on virtual synapse. Simulation (2020) 94: 415-427. |
| [18] | A novel time-event-driven algorithm for simulating spiking neural networks based on circular array. Neurocomputing (2018) 292: 121-129. |
| [19] |
Delay-induced synchronization transition in small-world Hodgkin-Huxley neuronal networks with channel blocking. Discrete Contin. Dyn. Syst. Ser. B (2011) 16: 607-621.
|
| [20] |
B. Zhen, Z. Li and Z. Song, Influence of time delay in signal transmission on synchronization between two coupled FitzHugh-Nagumo neurons, Applied Sciences, 9 (2019), 2159. doi: 10.3390/app9102159
|
| [21] |
B. Zhen, D. Zhang and Z. Son, Complexity induced by external stimulations in a neural network system with time delay, Math. Probl. Eng., 2020 (2020), 5472351, 9 pp. doi: 10.1155/2020/5472351
|


Figures(9) / Tables(3)
Xiaochun Gu, Fang Han, Zhijie Wang, Kaleem Kashif, Wenlian Lu. Enhancement of gamma oscillations in E/I neural networks by increase of difference between external inputs[J]. Electronic Research Archive, 2021, 29(5): 3227-3241. doi: 10.3934/era.2021035


 DownLoad: