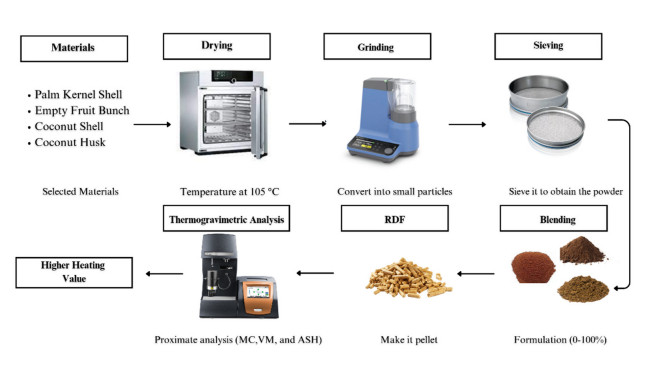
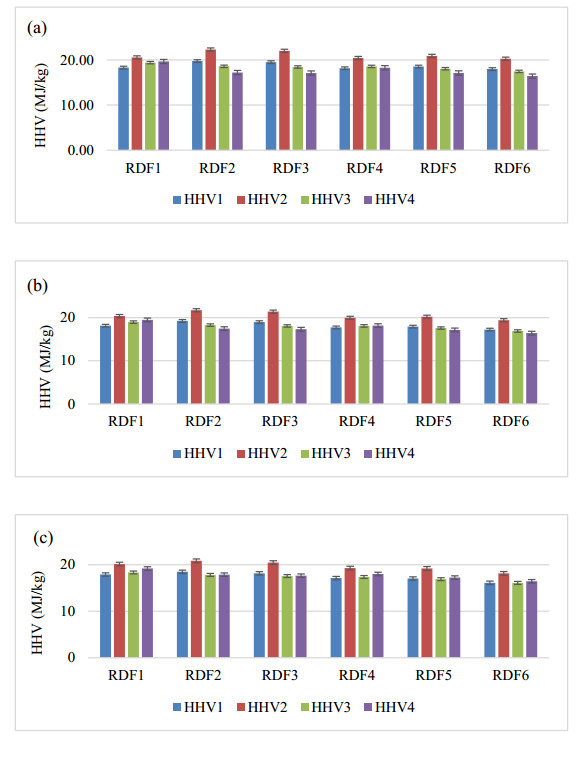
There is an increasing interest in using agricultural residues and wastes for energy production due to concerns regarding climate change and energy security issues. One of the alternative fuels considered is Refuse-derived fuel (RDF) from biomass, which has a Higher Heating Value (HHV) comparable to coal. This study aims to investigate the relationship between the moisture content and the HHV value. Palm kernel shells (PKS), coconut husks (CH), and coconut shells (CS) were blended at various ratios (10%–80%) and moisture levels (5%, 7%, 10%). The HHV was analyzed through a proximate analysis, with JMP Pro 17.0 modelling the HHV against the moisture content. Then, the Tukey-Kramer analysis identified the optimal energy ratio, thus providing insights into maximizing the RDF efficiency. The result showed that the highest HHV was 21.617 MJ/kg with the RDF2 formulation. Notably, the RDF2 energy content was less than 4% of that of coal, thus demonstrating the potential of utilizing agricultural waste to produce solid fuel with a positive environmental impact.
Citation: NY Abd Halim, NIS Muhammad. Investigation of moisture content and higher heating value in refuse-derived fuel from agricultural residues using statistical modelling[J]. AIMS Energy, 2025, 13(1): 1-12. doi: 10.3934/energy.2025001
There is an increasing interest in using agricultural residues and wastes for energy production due to concerns regarding climate change and energy security issues. One of the alternative fuels considered is Refuse-derived fuel (RDF) from biomass, which has a Higher Heating Value (HHV) comparable to coal. This study aims to investigate the relationship between the moisture content and the HHV value. Palm kernel shells (PKS), coconut husks (CH), and coconut shells (CS) were blended at various ratios (10%–80%) and moisture levels (5%, 7%, 10%). The HHV was analyzed through a proximate analysis, with JMP Pro 17.0 modelling the HHV against the moisture content. Then, the Tukey-Kramer analysis identified the optimal energy ratio, thus providing insights into maximizing the RDF efficiency. The result showed that the highest HHV was 21.617 MJ/kg with the RDF2 formulation. Notably, the RDF2 energy content was less than 4% of that of coal, thus demonstrating the potential of utilizing agricultural waste to produce solid fuel with a positive environmental impact.

| [1] |
Azni MA, Md Khalid R, Hasran UA, et al. (2023) Review of the effects of fossil fuels and the need for a hydrogen fuel cell policy in Malaysia. Sustainability 15: 4033. https://doi.org/10.3390/su15054033 doi: 10.3390/su15054033

|
| [2] |
Cheela VRS, John M, Dubey B (2021) Quantitative determination of energy potential of refuse derived fuel from the waste recovered from Indian landfill. Sustain Environ Res, 31. https://doi.org/10.1186/s42834-021-00097-5 doi: 10.1186/s42834-021-00097-5
|
| [3] |
Kamran M (2023) Energy storage in smart grids. Fundam Smart Grid Syst 3: 393–429. https://doi.org/10.1016/b978-0-323-99560-3.00001-6 doi: 10.1016/b978-0-323-99560-3.00001-6
|
| [4] |
Shatnawi N, Abu-Qdais H, Abu Qdais F (2021) Selecting renewable energy options: An application of multi-criteria decision making for Jordan. Sustain Sci Pract 17: 210–220. https://doi.org/10.1080/15487733.2021.1930715 doi: 10.1080/15487733.2021.1930715
|
| [5] | Hasliza MSN (2022) Is Malaysia ready to leave coal behind in renewable energy push? Malaysia Now. Available from: https://www.malaysianow.com/news/2022/04/13/is-malaysia-ready-to-leave-coal-behind-in-renewable-energy-push. |
| [6] | Earnings risk (2022) Earnings risk for TNB despite tariff hike. TNB. Available from: https://www.tnb.com.my/assets/newsclip/01022022a1.pdf. |
| [7] | Tenaga Nasional Berhad (TNB) (2023) Integrated annual report 2022. TNB. Available from: https://www.tnb.com.my/assets/annual_report/TNB_IAR_2022.pdf. |
| [8] |
Bertolino AM, Giganti P, Santos DD, et al. (2023) A matter of energy injustice? A comparative analysis of biogas development in Brazil and Italy. Energy Res Soc Sci 105: 103278 https://doi.org/10.1016/j.erss.2023.103278 doi: 10.1016/j.erss.2023.103278
|
| [9] |
Falcone PM (2023) Sustainable energy policies in developing countries: A review of challenges and opportunities. Energies, 16. https://doi.org/10.3390/en16186682 doi: 10.3390/en16186682
|
| [10] |
Barra C, Falcone PM (2024) Environmental performance of countries: Examining the effect of diverse institutional factors in a metafrontier approach. Socio-Econ Plan Sci 95: 101972. https://doi.org/10.1016/j.seps.2024.101972 doi: 10.1016/j.seps.2024.101972
|
| [11] | Global Carbon Budget (2024) Malaysia: What are the country's annual CO2 emissions? Our World Data. Available from: https://ourworldindata.org/co2/country/malaysia. |
| [12] |
Isaac K, Bada SO (2020) The co-combustion performance and reaction kinetics of refuse derived fuels with South African high ash coal. Heliyon 6: e03309. https://doi.org/10.1016/j.heliyon.2020.e03309 doi: 10.1016/j.heliyon.2020.e03309
|
| [13] |
Nasiri S, Hajinezhad A, Kianmehr MH, et al. (2023) Enhancing municipal solid waste efficiency through refuse-derived fuel pellets: Additive analysis, die retention time, and temperature impact. Energy Rep 10: 941–957. https://doi.org/10.1016/j.egyr.2023.07.039 doi: 10.1016/j.egyr.2023.07.039
|
| [14] |
Rahman MM, Khan I, Field DL, et al. (2022) Powering agriculture: Present status, future potential, and challenges of renewable energy applications. Renewable Energy 188: 731–749. https://doi.org/10.1016/j.renene.2022.02.065 doi: 10.1016/j.renene.2022.02.065
|
| [15] |
Karić N, Fazlić S, Šabanović E, et al. (2022) Bio-waste valorisation: Agricultural wastes as biosorbents for removal of (in)organic pollutants in wastewater treatment. Chem Eng J Adv 9: 100239. https://doi.org/10.1016/j.ceja.2021.100239 doi: 10.1016/j.ceja.2021.100239
|
| [16] |
Ivanova S, Vesnina A, Fotina N, et al. (2022) An overview of carbon footprint of coal mining to curtail greenhouse gas emissions. Sustainability 14: 15135. https://doi.org/10.3390/su142215135 doi: 10.3390/su142215135
|
| [17] |
Sibalan K, Suhaimi H, Hamdan Y, et al. (2021) Experimental analysis on the characteristic of empty fruit bunch, palm kernel shell, coconut shell, and rice husk for biomass boiler fuel. J Mech Eng Sci 15: 8300–8309. https://doi.org/10.15282/jmes.15.3.2021.08.0652 doi: 10.15282/jmes.15.3.2021.08.0652
|
| [18] |
Efiyanti L, Darmawan S, Saputra NA, et al. (2022) Quality evaluation of coconut shell activated carbon and its application as precursor for citronellal-scented aromatic briquette. Rasayan J Chem 15: 1608–1618. https://doi.org/10.31788/RJC.2022.1536799 doi: 10.31788/RJC.2022.1536799
|
| [19] |
Kalivodová M (2022) The determination of higher heating value by calculation based on elemental analysis. Paliva 14: 8–20. https://doi.org/10.35933/paliva.2022.01.02 doi: 10.35933/paliva.2022.01.02
|
| [20] |
Vilakazi L, Madyira D (2024) Estimation of gross calorific value of coal: A literature review. Int J Coal Prep Utilization, 1–15. https://doi.org/10.1080/19392699.2024.2339340 doi: 10.1080/19392699.2024.2339340
|
| [21] |
Mierzwa-Hersztek M, Gondek K, Jewiarz M, et al. (2019) Assessment of energy parameters of biomass and biochars, leachability of heavy metals and phytotoxicity of their ashes. J Mater Cycles Waste Manage 21: 786–800. https://doi.org/10.1007/s10163-019-00832-6 doi: 10.1007/s10163-019-00832-6
|
| [22] |
Park S (2022) Thermogravimetric analysis-based proximate analysis of agro-products and prediction of calorific. Energy Rep 8: 12038–12044. https://doi.org/10.1016/j.egyr.2022.09.040 doi: 10.1016/j.egyr.2022.09.040
|
| [23] |
Messineo A, Volpe R, Asdrubal F (2012) Evaluation of net energy obtainable from combustion of stabilized olive mill by-products. Energies 5: 1384–1397. https://doi.org/10.3390/en5051384 doi: 10.3390/en5051384
|
| [24] |
Paszkowski J, Domański M, Caban J, et al. (2020) The use of refuse-derived fuel (RDF) in the power industry. Agric Eng 24: 83–90. https://doi.org/10.1515/agriceng-2020-0029 doi: 10.1515/agriceng-2020-0029
|
| [25] |
Rominiyi O, Olaniyi T, Azeez T, et al. (2017) Synergetic effect of proximate and ultimate analysis on the heating value of municipal solid waste of Ado-Ekiti metropolis, southwest Nigeria. Curr J Appl Sci Technol 22: 1–12. https://doi.org/10.9734/cjast/2017/32953 doi: 10.9734/cjast/2017/32953
|
| [26] |
Demirbas A (2016) Calculation of higher heating values of fatty acids. Energy Sources A: Recovery Util Environ Eff 38: 2693–2697. https://doi.org/10.1080/15567036.2015.1115924 doi: 10.1080/15567036.2015.1115924
|
| [27] |
Cordero T, Marquez F, Rodriguez-Mirasol J, et al. (2001) Predicting heating values of lignocellulosics and carbonaceous materials from proximate analysis. Fuel 80: 1567–1571. https://doi.org/10.1016/S0016-2361(01)00034-5 doi: 10.1016/S0016-2361(01)00034-5
|
| [28] |
Yu ZT, Xu X, Hu YC, et al. (2022) Machine learning prediction for refuse-derived fuel calorific based on material composition. J Clean Prod 363: 132293. https://doi.org/10.1016/j.jclepro.2022.132293 doi: 10.1016/j.jclepro.2022.132293
|
| [29] |
Giere R, Querol X (2010) Solid fuels: Types, preparation, and applications. Elements 6: 365–371. https://doi.org/10.2113/gselements.6.5.365 doi: 10.2113/gselements.6.5.365
|
| [30] |
Jenkins BM, Baxter LL, Miles TR, et al. (1998) Combustion properties of biomass. Fuel Proc Technol 54: 17–46. https://doi.org/10.1016/S0378-3820(97)00059-3 doi: 10.1016/S0378-3820(97)00059-3
|
| [31] |
Werther J, Saenger M, Hartge EU, et al. (2000) Combustion of agricultural residues. Prog Energy Combust Sci 26: 1–27. https://doi.org/10.1016/S0360-1285(99)00005-2 doi: 10.1016/S0360-1285(99)00005-2
|
| [32] |
Beukering P, Sehker M (1999) Costs and benefits of waste incineration in a regional setting. Resour Conserv Recycl 26: 89–99. https://doi.org/10.1016/S0921-3449(98)00098-7 doi: 10.1016/S0921-3449(98)00098-7
|
| [33] |
Ragosnig AM (2010) Refuse-derived fuel: Mechanisms and sustainable utilization. Waste Manag 30: 2120–2132. https://doi.org/10.1016/j.wasman.2010.07.008 doi: 10.1016/j.wasman.2010.07.008
|
| [34] |
Al-Salem SM, Evangelisti S, Lettieri P (2014) Life cycle assessment of alternative technologies for municipal solid waste and refuse-derived fuel treatment. Energy 64: 131–140. https://doi.org/10.1016/j.cej.2014.01.066 doi: 10.1016/j.cej.2014.01.066
|
Figures(4) / Tables(5)

NY Abd Halim, NIS Muhammad. Investigation of moisture content and higher heating value in refuse-derived fuel from agricultural residues using statistical modelling[J]. AIMS Energy, 2025, 13(1): 1-12. doi: 10.3934/energy.2025001


 DownLoad: