Listeria monocytogenes, which causes human listeriosis after consumption of contaminated food, can adapt and survive under a wide range of physiological and chemical stresses. In this study, the overall proteomic response of the L. monocytogenes strain F2365—a strain with mutations limiting its ability to tolerate acidic conditions—to progressive non-thermal acidic inactivation was investigated. The challenge process was investigated in the early stationary growth phase where F2365 cultures were acidified (pH 3.0, HCl) at 5 min, 1 h, and 2 h, generating pH 4.8, pH 4.1, and pH 3.5, respectively, with protein abundance measured using iTRAQ. Approximately 73 proteins increased in abundance and 8 declined when acidic stress became non-growth-permissive (pH < 4.1) and inactivation accelerated to approximately 2 log units/h. The functional categories of responding proteins were broad but the proteins involved were specific in nature and did not include whole pathways. Many responses likely accentuate energy conservation and compensate vital metabolic processes. For example, further repression of FlaA, normally repressed under acidic stress, occurs accompanied by an increase in quinol oxidase subunit QoxA and glycerol kinase GlpK. Proteins maintaining cell wall integrity, such as Iap and CwlO, manifested the overall largest abundance increase trend. Virulence proteins were also induced, including InlA, InlC, Hyl, Mpl, PlcA, and PlcB, suggesting that acidification may have mimicked conditions inducing some host survival traits. The overall suite of proteins affected appears to be the "last ditch" responses to non-thermal inactivation above and beyond the standard protections afforded in the stationary-growth phase. The array of proteins found here may provide a deeper understanding of the physiological responses of this pathogen during non-thermal inactivation.
Citation: Donglai Zhang, Zongyu Liu, Mingchang Jia, John P. Bowman. Proteins of the food-borne pathogen Listeria monocytogenes strain F2365 relevant to lethal acidic stress and during rapid inactivation[J]. AIMS Agriculture and Food, 2024, 9(2): 445-471. doi: 10.3934/agrfood.2024026
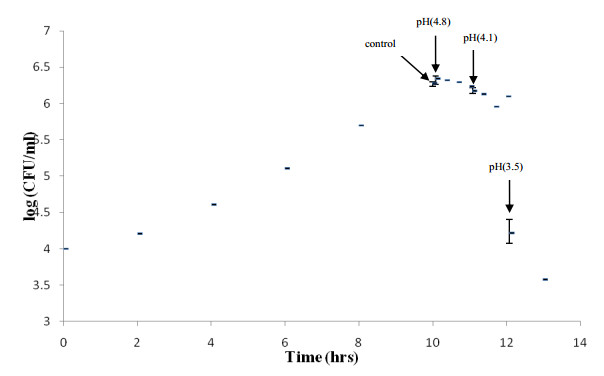
Listeria monocytogenes, which causes human listeriosis after consumption of contaminated food, can adapt and survive under a wide range of physiological and chemical stresses. In this study, the overall proteomic response of the L. monocytogenes strain F2365—a strain with mutations limiting its ability to tolerate acidic conditions—to progressive non-thermal acidic inactivation was investigated. The challenge process was investigated in the early stationary growth phase where F2365 cultures were acidified (pH 3.0, HCl) at 5 min, 1 h, and 2 h, generating pH 4.8, pH 4.1, and pH 3.5, respectively, with protein abundance measured using iTRAQ. Approximately 73 proteins increased in abundance and 8 declined when acidic stress became non-growth-permissive (pH < 4.1) and inactivation accelerated to approximately 2 log units/h. The functional categories of responding proteins were broad but the proteins involved were specific in nature and did not include whole pathways. Many responses likely accentuate energy conservation and compensate vital metabolic processes. For example, further repression of FlaA, normally repressed under acidic stress, occurs accompanied by an increase in quinol oxidase subunit QoxA and glycerol kinase GlpK. Proteins maintaining cell wall integrity, such as Iap and CwlO, manifested the overall largest abundance increase trend. Virulence proteins were also induced, including InlA, InlC, Hyl, Mpl, PlcA, and PlcB, suggesting that acidification may have mimicked conditions inducing some host survival traits. The overall suite of proteins affected appears to be the "last ditch" responses to non-thermal inactivation above and beyond the standard protections afforded in the stationary-growth phase. The array of proteins found here may provide a deeper understanding of the physiological responses of this pathogen during non-thermal inactivation.

| [1] |
Buchanan RL, Gorris LGM, Hayman MM, et al. (2017) A review of Listeria monocytogenes: An update on outbreaks, virulence, dose-response, ecology, and risk assessments. Food Control 75: 1–13. https://doi.org/10.1016/j.foodcont.2016.12.016 doi: 10.1016/j.foodcont.2016.12.016

|
| [2] |
Fan Z, Xie J, Li Y, et al. (2019) Listeriosis in mainland China: A systematic review. Int J Infect Dis 81: 17–24. https://doi.org/10.1016/j.ijid.2019.01.007 doi: 10.1016/j.ijid.2019.01.007
|
| [3] |
Bagatella S, Tavares-Gomes L, Oevermann A (2022) Listeria monocytogenes at the interface between ruminants and humans: A comparative pathology and pathogenesis review. Vet Pathol 59: 186–210. https://doi.org/10.1177/03009858211052659 doi: 10.1177/03009858211052659
|
| [4] |
Koopmans MM, Brouwer MC, Vázquez-Boland JA, et al. (2023) Human listeriosis. Clin Microbiol Rev 36: e0006019. https://doi.org/10.1128/cmr.00060-19 doi: 10.1128/cmr.00060-19
|
| [5] |
Lanciotti R, Braschi G, Patrignani F, et al. (2019) How Listeria monocytogenes shapes its proteome in response to natural antimicrobial compounds. Front Microbiol 10: 437. https://doi.org/10.3389/fmicb.2019.00437 doi: 10.3389/fmicb.2019.00437
|
| [6] |
Chen YA, Chen GW, Ku HH, et al. (2022) Differential proteomic analysis of Listeria monocytogenes during high-pressure processing. Biology 11: 1152. https://doi.org/10.3390/biology11081152 doi: 10.3390/biology11081152
|
| [7] | D'Onofrio F, Schirone M, Krasteva I, et al. (2023) A comprehensive investigation of protein expression profiles in L. monocytogenes exposed to thermal abuse, mild acid, and salt stress conditions. Front Microbiol 14: 1271787. https://doi.org/10.3389/fmicb.2023.1271787 |
| [8] | Zhang DL, Ross T, Bowman JP (2010) Physiological aspects of Listeria monocytogenes during inactivation accelerated by mild temperatures and otherwise non-growth permissive acidic and hyperosmotic conditions. Int J Food Microbiol 141: 177–185. |
| [9] | Zhang DL, McQuestin OJ, Mellefont LA, et al. (2010) The influence of non-lethal temperature on the rate of inactivation of vegetative bacteria in inimical environments may be independent of bacterial species. Food Microbiol 27: 453–459. |
| [10] | Bowman JP, Hages E, Nilsson RE, et al. (2012) Investigation of the Listeria monocytogenes Scott A acid tolerance response and associated physiological and phenotypic features via whole proteome analysis. J Proteome Res 11: 2409–2426. |
| [11] |
Manso B, Melero B, Stessl B, et al. (2020) The response to oxidative stress in Listeria monocytogenes is temperature dependent. Microorganisms 8: 521. https://doi.org/10.3390/microorganisms8040521 doi: 10.3390/microorganisms8040521
|
| [12] | Pittman JR, Buntyn JO, Posadas G, et al. (2014) Proteomic analysis of cross protection provided between cold and osmotic stress in Listeria monocytogenes. J Proteome Res 13: 1896–1904. |
| [13] |
Melian C, Castellano P, Segli F, et al. (2021) Proteomic analysis of Listeria monocytogenes fbunt during biofilm formation at 10 ℃ in response to lactocin AL705. Front Microbiol 12: 604126. https://doi.org/10.3389/fmicb.2021.604126 doi: 10.3389/fmicb.2021.604126
|
| [14] |
Shabala L, Lee SH, Cannesson P, et al. (2008) Acid and NaCl limits to growth of Listeria monocytogenes and influence of sequence of inimical acid and NaCl levels on inactivation kinetics. J Food Protect 71: 1169–1177. https://doi.org/10.4315/0362-028x-71.6.1169 doi: 10.4315/0362-028x-71.6.1169
|
| [15] | Ross T, Zhang D, McQuestin O (2008) Temperature is the main factor governing the rate of non-thermal inactivation of vegetative bacteria. Int J Food Microbiol 128: 129–135. |
| [16] |
Nightingale KK, Milillo SR, Ivy RA, et al. (2007) Listeria monocytogenes F2365 carries several authentic mutations potentially leading to truncated gene products, including inlB, and demonstrates atypical phenotypic characteristics. J Food Protect 70: 482–488. https://doi.org/10.4315/0362-028x-70.2.482 doi: 10.4315/0362-028x-70.2.482
|
| [17] |
Oliver HF, Orsi RH, Wiedmann M, et al. (2013) σ(B) plays a limited role in the ability of Listeria monocytogenes strain F2365 to survive oxidative and acid stress and in its virulence characteristics. J Food Protect 76: 2079–2086. https://doi.org/10.4315/0362-028X.JFP-12-542 doi: 10.4315/0362-028X.JFP-12-542
|
| [18] | Qin X, He S, Zhou X, et al. (2019) Quantitative proteomics reveals the crucial role of YbgC for Salmonella enterica serovar Enteritidis survival in egg white. Int J Food Microbiol 289: 115–126. |
| [19] | Wisniewski JR., Zougman A, Nagaraj N, et al. (2009) Universal sample preparation method for proteome analysis. Nat Methods 6: 359–362. |
| [20] | Ashburner M, Ball CA, Blake JA, et al. (2000). Gene ontology: Tool for the unification of biology. The Gene Ontology Consortium. Nat Genet 25: 25–29. |
| [21] | Gotz S, García-Gómez JM, Terol J, et al. (2008) High-throughput functional annotation and data mining with the last2GO suite. Nucleic Acids Res 36: 3420–3435. |
| [22] | Kanehisa M, Goto S, Sato Y, et al. (2012) KEGG for integration and interpretation of large-scale molecular data sets. Nucleic Acids Res 40: D109–D114. |
| [23] | Peterson AC, Russell JD, Bailey DJ, et al. (2012) Parallel reaction monitoring for high resolution and high mass accuracy quantitative, targeted proteomics. Mol Cell Proteomics 11: 1475–1488. |
| [24] |
MacLean B, Tomazela DM, Shulman N, et al. (2010) Skyline: An open source document editor for creating and analyzing targeted proteomics experiments. Bioinformatics 26: 966–968. https://doi.org/10.1093/bioinformatics/btq054 doi: 10.1093/bioinformatics/btq054
|
| [25] |
Melo J, Schrama D, Hussey S, et al. (2013) Listeria monocytogenes dairy isolates show a different proteome response to sequential exposure to gastric and intestinal fluids. Int J Food Microbiol 163: 51–63. https://doi.org/10.1016/j.ijfoodmicro.2013.03.001 doi: 10.1016/j.ijfoodmicro.2013.03.001
|
| [26] |
Chen GW, Chen YA, Chang HY, et al. (2021) Combined impact of high-pressure processing and slightly acidic electrolysed water on Listeria monocytogenes proteomes. Food Res Int 147: 110494. https://doi.org/10.1016/j.foodres.2021.110494 doi: 10.1016/j.foodres.2021.110494
|
| [27] |
D'Onofrio F, Schirone M, Paparella A, et al. (2023) Stress adaptation responses of a Listeria monocytogenes 1/2a strain via proteome profiling. Foods 12: 2166. https://doi.org/10.3390/foods12112166 doi: 10.3390/foods12112166
|
| [28] |
Zhang D, Bai YL, Bowman JP (2019) Impact of combined acidic and hyperosmotic shock conditions on the proteome of Listeria monocytogenes ATCC 19115 in a time-course study. J Food Quality 2019: 3075028. https://doi.org/10.1155/2019/3075028 doi: 10.1155/2019/3075028
|
| [29] |
Guan N, Liu L (2020) Microbial response to acid stress: mechanisms and applications. Appl Microbiol Biotech 104: 51–65. https://doi.org/10.1007/s00253-019-10226-1 doi: 10.1007/s00253-019-10226-1
|
| [30] |
Korovila I, Hugo M, Castro JP, et al. (2017) Proteostasis, oxidative stress and aging. Redox Biol 13: 550–567. https://doi.org/10.1016/j.redox.2017.07.008 doi: 10.1016/j.redox.2017.07.008
|
| [31] |
Schramm FD, Schroeder K, Jonas K (2020) Protein aggregation in bacteria. FEMS Microbiol Rev 44: 54–72. https://doi.org/10.1093/femsre/fuz026 doi: 10.1093/femsre/fuz026
|
| [32] |
Rothman JE, Schekman R (2011) Molecular mechanism of protein folding in the cell. Cell 146: 851–854. https://doi.org/10.1016/j.cell.2011.08.041 doi: 10.1016/j.cell.2011.08.041
|
| [33] |
Izquierdo-Fiallo K, Muñoz-Villagrán C, Orellana O, et al. (2023) Comparative genomics of the proteostasis network in extreme acidophiles. PLoS ONE 18: e0291164. https://doi.org/10.1371/journal.pone.0291164 doi: 10.1371/journal.pone.0291164
|
| [34] |
Grubaugh D, Regeimbal JM, Ghosh P, et al. (2018) The VirAB ABC transporter is required for virR regulation of Listeria monocytogenes virulence and resistance to nisin. Infect Immun 86: e00901-17. https://doi.org/10.1128/IAI.00901-17 doi: 10.1128/IAI.00901-17
|
| [35] |
Engelgeh T, Herrmann J, Jansen R, et al. (2023) Tartrolon sensing and detoxification by the Listeria monocytogenes timABR resistance operon. Mol Microbiol 120: 629–644. https://doi.org/10.1111/mmi.15178 doi: 10.1111/mmi.15178
|
| [36] | Brodiazhenko T, Turnbull KJ, Wu KJY, et al. (2022) Synthetic oxepanoprolinamide iboxamycin is active against Listeria monocytogenes despite the intrinsic resistance mediated by VgaL/Lmo0919 ABCF ATPase. JAC Antimicrob Resist 4: dlac061. https://doi.org/10.1093/jacamr/dlac061 |
| [37] | Reniere ML, Ukpabi GN, Harry SR, et al. (2010) The IsdG-family of haem oxygenases degrades haem to a novel chromophore. Mol Microbiol 75: 1529–1538. |
| [38] | Perveen S, Rashid N, Tang XF, et al. (2017) Anthranilate phosphoribosyltransferase from the hyperthermophilic archaeon Thermococcus kodakarensis shows maximum activity with zinc and forms a unique dimeric structure. FEBS Open Bio 7: 1217–1230. |
| [39] | Krishna Kumar VG, Paul A, Gazit E, et al. (2018) Mechanistic insights into remodeled Tau-derived PHF6 peptide fibrils by naphthoquinone-tryptophan hybrids. Sci Rep 8: 71. |
| [40] | Grubmüller S, Schauer K, Goebel W, et al. (2014) Analysis of carbon substrates used by Listeria monocytogenes during growth in J774A.1 macrophages suggests a bipartite intracellular metabolism. Front Cell Infect Microbiol 4: 156. https://doi.org/10.3389/fcimb.2014.00156 |
| [41] |
Pirovich DB, Da'dara AA, Skelly PJ (2021) Multifunctional Fructose 1, 6-Bisphosphate Aldolase as a Therapeutic Target. Front Mol Biosci 8: 719678. https://doi.org/10.3389/fmolb.2021.719678 doi: 10.3389/fmolb.2021.719678
|
| [42] | Wang G, Xia Y, Cui J, et al. (2014) The roles of moonlighting proteins in bacteria. Curr Issues Mol Biol 16: 15–22. |
| [43] | Paspaliari DK, Kastbjerg VG, Ingmer H, et al. (2017) Chitinase expression in Listeria monocytogenes is influenced by lmo0327, which encodes an internalin-like protein. Appl Environ Microbiol 83: e01283-17 |
| [44] | Sannino DR, Kraft CE, Edwards KA, et al. (2018) Thiaminase I provides a growth advantage by salvaging precursors from environmental thiamine and its analogs in Burkholderia thailandensis. Appl Environ Microbiol 84: e01268-18. https://doi.org/10.1128/AEM.01268-18 |
| [45] |
Corbett D, Goldrick M, Fernandes VE, et al. (2017) Listeria monocytogenes has both cytochrome bd-type and cytochrome aa3-type terminal oxidases, which allow growth at different oxygen levels, and both are important in infection. Infect Immun 85: e00354-17. https://doi.org/10.1128/IAI.00354-17 doi: 10.1128/IAI.00354-17
|
| [46] |
Gouin E, Adib-Conquy M, Balestrino D, et al. (2010). The Listeria monocytogenes InlC protein interferes with innate immune responses by targeting the IκB kinase subunit IKKα. PNAS 107: 17333–17338. https://doi.org/10.1073/pnas.1007765107 doi: 10.1073/pnas.1007765107
|
| [47] |
Garandeau C, Réglier-Poupet H, Dubail I, et al. (2002). The sortase SrtA of Listeria monocytogenes is involved in processing of internalin and in virulence. Infect Immun 70: 1382–1390. https://doi.org/10.1128/IAI.70.3.1382-1390.2002 doi: 10.1128/IAI.70.3.1382-1390.2002
|
| [48] |
Reniere ML, Whiteley AT, Hamilton KL, et al. (2015) Glutathione activates virulence gene expression of an intracellular pathogen. Nature 517: 170–173. https://doi.org/10.1038/nature14029 doi: 10.1038/nature14029
|
| [49] |
Gaballa A, Guariglia-Oropeza V, Wiedmann M, et al. (2019) Cross talk between SigB and PrfA in Listeria monocytogenes facilitates transitions between extra-and intracellular environments. Microbiol Mol Biol Rev 83: e00034-19. https://doi.org/10.1128/MMBR.00034-19 doi: 10.1128/MMBR.00034-19
|
| [50] |
Pinto D, São-José C, Santos MA, et al. (2013) Characterization of two resuscitation promoting factors of Listeria monocytogenes. Microbiology 159: 1390–1401. https://doi.org/10.1099/mic.0.067850-0 doi: 10.1099/mic.0.067850-0
|
| [51] |
Dell'Era S, Buchrieser C, Couvé E, et al. (2009) Listeria monocytogenes L-forms respond to cell wall deficiency by modifying gene expression and the mode of division. Mol Microbiol 73: 306–322. https://doi.org/10.1111/j.1365-2958.2009.06774.x doi: 10.1111/j.1365-2958.2009.06774.x
|
| [52] | Alharbi MAS (2018) Aging and recovery of Listeria monocytogenes ScottA. PhD Thesis, University of Tasmania. |
| [53] |
Györkei Á, Daruka L, Balogh D, et al. (2022) Proteome-wide landscape of solubility limits in a bacterial cell. Sci Rep 12: 6547. https://doi.org/10.1038/s41598-022-10427-1 doi: 10.1038/s41598-022-10427-1
|
| [54] |
Santos T, Viala D, Chambon C, et al. (2019) Listeria monocytogenes biofilm adaptation to different temperatures seen through shotgun proteomics. Front Nutr 6: 89. https://doi.org/10.3389/fnut.2019.00089 doi: 10.3389/fnut.2019.00089
|
| [55] |
Kamp HD, Higgins DE (2011) A protein thermometer controls temperature-dependent transcription of flagellar motility genes in Listeria monocytogenes. PLOS Pathogens 7: e1002153. https://doi.org/10.1371/journal.ppat.1002153 doi: 10.1371/journal.ppat.1002153
|
| [56] | Cesinger MR, Thomason MK, Edrozo MB, et al. (2020). Listeria monocytogenes SpxA1 is a global regulator required to activate genes encoding catalase and heme biosynthesis enzymes for aerobic growth. Mol Microbiol 114: 230–243 |
| [57] |
Fox EM, Allnutt T, Bradbury MI, et al. (2016) Comparative genomics of the Listeria monocytogenes ST204 Subgroup. Front Microbiol 7: 2057. https://doi.org/10.3389/fmicb.2016.02057 doi: 10.3389/fmicb.2016.02057
|
| [58] | Fischer MA, Engelgeh T, Rothe P, et al. (2022). Listeria monocytogenes genes supporting growth under standard laboratory cultivation conditions and during macrophage infection. Genome Res 32: 1711–1726. https://doi.org/10.1101/gr.276747.122 |
| [59] | Cui D, Li G, Zhao D, et al. (2015) Effect of quinoid redox mediators on the aerobic decolorization of azo dyes by cells and cell extracts from Escherichia coli. Environ Sci Pollut Res Int 22: 4621–4630. https://doi.org/10.1007/s11356-014-3698-6 |
| [60] |
Kim YG, Jeong JH, Ha NC, et al. (2011) Structural and functional analysis of the Lmo2642 cyclic nucleotide phosphodiesterase from Listeria monocytogenes. Proteins 79: 1205–1214. https://doi.org/10.1002/prot.22954 doi: 10.1002/prot.22954
|
| [61] |
Borisova M, Gaupp R, Duckworth A, et al. (2016) Peptidoglycan recycling in Gram-Positive bacteria Is crucial for survival in stationary phase. mBio 7: e00923-16. https://doi.org/10.1128/mBio.00923-16 doi: 10.1128/mBio.00923-16
|


Figures(6) / Tables(2)

Donglai Zhang, Zongyu Liu, Mingchang Jia, John P. Bowman. Proteins of the food-borne pathogen Listeria monocytogenes strain F2365 relevant to lethal acidic stress and during rapid inactivation[J]. AIMS Agriculture and Food, 2024, 9(2): 445-471. doi: 10.3934/agrfood.2024026


 DownLoad: