Aflatoxins are secondary carcinogenic fungal metabolites derived from the toxic various Aspergillus species. These fungi can easily infect nuts and grains. A global systematic review was done to extract data on the concentration of aflatoxins in different nuts. Besides, risk assessment was conducted on data. The scientific databases were searched systematically from 2000 to 2020. Based on the results, aflatoxin B1 (AFB1) had the most frequency in nut samples. The mean concentration of aflatoxin total (AFT) and AFB1 in nuts were as follows: peanut (37.85, 32.82 μg/kg), pistachio (31.42, 39.44 μg/kg), almond (3.54, 3.93 μg/kg), walnut (42.27, 22.23 μg/kg), hazelnut (17.33, 10.54 μg/kg), Brazil nut (4.61, 3.35 μg/kg), and other nuts (26.22, 7.38 μg/kg). According to country the margin of exposure (MOE) value for adult was as Argentina (21) > Congo (67) > India (117) > Bangladesh (175) > Cameroon (238) > Iran (357) > Bahrain (438) > Brazil (447) > Ghana (606) > South Africa (1017) > Egypt (1176) > USA (1505) > China (1526) > Cyprus (1588). The MOE of the consumers in some countries was considerably below the safety margin of 10,000. To conclude, nuts are highly consumed by different consumers, so it is necessary to emphasize strict control measures to prevent contamination of these foods with aflatoxins.
Citation: Arezoo Ebrahimi, Alireza Emadi, Majid Arabameri, Ahmad Jayedi, Anna Abdolshahi, Behdad Shokrolahi Yancheshmeh, Nabi Shariatifar. The prevalence of aflatoxins in different nut samples: A global systematic review and probabilistic risk assessment[J]. AIMS Agriculture and Food, 2022, 7(1): 130-148. doi: 10.3934/agrfood.2022009
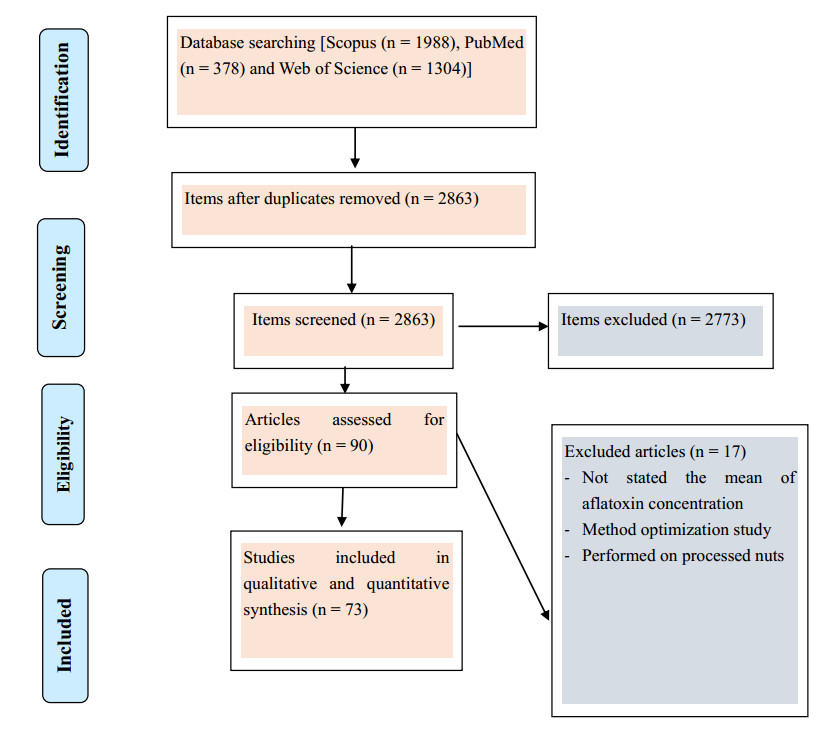
Aflatoxins are secondary carcinogenic fungal metabolites derived from the toxic various Aspergillus species. These fungi can easily infect nuts and grains. A global systematic review was done to extract data on the concentration of aflatoxins in different nuts. Besides, risk assessment was conducted on data. The scientific databases were searched systematically from 2000 to 2020. Based on the results, aflatoxin B1 (AFB1) had the most frequency in nut samples. The mean concentration of aflatoxin total (AFT) and AFB1 in nuts were as follows: peanut (37.85, 32.82 μg/kg), pistachio (31.42, 39.44 μg/kg), almond (3.54, 3.93 μg/kg), walnut (42.27, 22.23 μg/kg), hazelnut (17.33, 10.54 μg/kg), Brazil nut (4.61, 3.35 μg/kg), and other nuts (26.22, 7.38 μg/kg). According to country the margin of exposure (MOE) value for adult was as Argentina (21) > Congo (67) > India (117) > Bangladesh (175) > Cameroon (238) > Iran (357) > Bahrain (438) > Brazil (447) > Ghana (606) > South Africa (1017) > Egypt (1176) > USA (1505) > China (1526) > Cyprus (1588). The MOE of the consumers in some countries was considerably below the safety margin of 10,000. To conclude, nuts are highly consumed by different consumers, so it is necessary to emphasize strict control measures to prevent contamination of these foods with aflatoxins.

| [1] |
Witkowska AM, Waśkiewicz A, Zujko ME, et al. (2019) The consumption of nuts is associated with better dietary and lifestyle patterns in polish adults: results of WOBASZ and WOBASZ Ⅱ surveys. Nutrients 11: 1410. https://doi.org/10.3390/nu11061410 doi: 10.3390/nu11061410

|
| [2] |
Micha R, Khatibzadeh S, Shi P, et al. (2015) Global, regional and national consumption of major food groups in 1990 and 2010: a systematic analysis including 266 country-specific nutrition surveys worldwide. BMJ Open 5: e008705. https://doi.org/10.1136/bmjopen-2015-008705 doi: 10.1136/bmjopen-2015-008705
|
| [3] |
Neale EP, Tran G, Brown RC (2020) Barriers and facilitators to nut consumption: A narrative review. Int J Environ Res Public Health 17: 9127. https://doi.org/10.3390/ijerph17239127 doi: 10.3390/ijerph17239127
|
| [4] |
Blomhoff R, Carlsen MH, Andersen LF, et al. (2006) Health benefits of nuts: potential role of antioxidants. Br J Nutr 96: S52-S60. https://doi.org/10.1017/BJN20061864 doi: 10.1017/BJN20061864
|
| [5] |
Sheridan MJ, Cooper JN, Erario M, et al. (2007) Pistachio nut consumption and serum lipid levels. J Am Coll Nutr 26: 141-148. https://doi.org/10.1080/07315724.2007.10719595 doi: 10.1080/07315724.2007.10719595
|
| [6] |
Varga J, Frisvad JC, Samson R (2011) Two new aflatoxin producing species, and an overview of Aspergillus section Flavi. Stud Mycol 69: 57-80. https://doi.org/10.3114/sim.2011.69.05 doi: 10.3114/sim.2011.69.05
|
| [7] |
Pildain MB, Frisvad JC, Vaamonde G, et al. (2008) Two novel aflatoxin-producing Aspergillus species from Argentinean peanuts. Int J Syst Evol Microbiol 58: 725-735. https://doi.org/10.1099/ijs.0.65123-0 doi: 10.1099/ijs.0.65123-0
|
| [8] |
Mutegi C, Ngugi H, Hendriks S, et al. (2009) Prevalence and factors associated with aflatoxin contamination of peanuts from Western Kenya. Int J Food Microbiol 130: 27-34. https://doi.org/10.1016/j.ijfoodmicro.2008.12.030 doi: 10.1016/j.ijfoodmicro.2008.12.030
|
| [9] |
Ammida N, Micheli L, Piermarini S, et al. (2006) Detection of aflatoxin B1 in barley: Comparative study of immunosensor and HPLC. Anal Lett 39: 1559-1572. https://doi.org/10.1080/00032710600713248 doi: 10.1080/00032710600713248
|
| [10] |
Afsah-Hejri L, Jinap S, Arzandeh S, et al. (2011) Optimization of HPLC conditions for quantitative analysis of aflatoxins in contaminated peanut. Food Control 22: 381-388. https://doi.org/10.1016/j.foodcont.2010.09.007 doi: 10.1016/j.foodcont.2010.09.007
|
| [11] |
Misihairabgwi J, Ezekiel C, Sulyok M, et al. (2019) Mycotoxin contamination of foods in Southern Africa: A 10-year review (2007-2016). Crit Rev Food Sci Nutr 59: 43-58. https://doi.org/10.1080/10408398.2017.1357003 doi: 10.1080/10408398.2017.1357003
|
| [12] |
Sharma S, Gupta D, Sharma YP (2015) Natural Incidence of Aflatoxins, Ochratoxin A, Patulin and Their Co-Occurrence in Chilgoza Pine Nuts Marketed in Jammu, India. Proc Natl Acad Sci India Sect B Biol Sci 85: 45-50. https://doi.org/10.1007/s40011-014-0326-7 doi: 10.1007/s40011-014-0326-7
|
| [13] |
Wang Y, Nie J, Yan Z, et al. (2018) Occurrence and co-occurrence of mycotoxins in nuts and dried fruits from China. Food Control 88: 181-189. https://doi.org/10.1016/j.foodcont.2018.01.013 doi: 10.1016/j.foodcont.2018.01.013
|
| [14] | Kazemi A, Mohtadi Nia J, Vahed Jabbari M, et al. (2007) Survey of food stuff to carcinogenic mycotoxins. The 3rd Congress of Medical Plants 24: 386. |
| [15] |
Cheraghali A, Yazdanpanah H, Doraki N, et al. (2007) Incidence of aflatoxins in Iran pistachio nuts. Food Chem Toxicol 45: 812-816. https://doi.org/10.1016/j.fct.2006.10.026 doi: 10.1016/j.fct.2006.10.026
|
| [16] |
Medina A, Gilbert MK, Mack BM, et al. (2017) Interactions between water activity and temperature on the Aspergillus flavus transcriptome and aflatoxin B1 production. Int J Food Microbiol 256: 36-44. https://doi.org/10.1016/j.ijfoodmicro.2017.05.020 doi: 10.1016/j.ijfoodmicro.2017.05.020
|
| [17] |
Petroczi A, Nepusz T, Taylor G, et al. (2011) Network analysis of the RASFF database: a mycotoxin perspective. World Mycotoxin J 4: 329-338. https://doi.org/10.3920/WMJ2010.1271 doi: 10.3920/WMJ2010.1271
|
| [18] |
Molyneux RJ, Mahoney N, Kim JH, et al. (2007) Mycotoxins in edible tree nuts. Int J Food Microbiol 119: 72-78. https://doi.org/10.1016/j.ijfoodmicro.2007.07.028 doi: 10.1016/j.ijfoodmicro.2007.07.028
|
| [19] | International Agency for Research on Cancer (1993) Some naturally occurring substances: Food items and constituents, heterocyclic aromatic amines and mycotoxins: World Health Organization. |
| [20] | IARC (2012) Aflatoxins, IARC Monographs on the Evaluation of Carcinogenic Risks on Humans. |
| [21] | Wogan G (1975) Dietary factors and special epidemiological situations of liver cancer in Thailand and Africa. Cancer Res 35: 3499-3502. |
| [22] | International Agency for Research on Cancer (2002) Some traditional herbal medicines, some mycotoxins, naphthalene and styrene: World Health Organization. |
| [23] |
Villa P, Markaki P (2009) Aflatoxin B1 and ochratoxin A in breakfast cereals from Athens market: occurrence and risk assessment. Food Control 20: 455-461. https://doi.org/10.1016/j.foodcont.2008.07.012 doi: 10.1016/j.foodcont.2008.07.012
|
| [24] |
Chiavaro E, Dall'Asta C, Galaverna G, et al. (2001) New reversed-phase liquid chromatographic method to detect aflatoxins in food and feed with cyclodextrins as fluorescence enhancers added to the eluent. J Chromatogr A 937: 31-40. https://doi.org/10.1016/S0021-9673(01)01300-0 doi: 10.1016/S0021-9673(01)01300-0
|
| [25] |
Juan C, Ritieni A, Mañes J (2012) Determination of trichothecenes and zearalenones in grain cereal, flour and bread by liquid chromatography tandem mass spectrometry. Food Chem 134: 2389-2397. https://doi.org/10.1016/j.foodchem.2012.04.051 doi: 10.1016/j.foodchem.2012.04.051
|
| [26] |
Yu FY, Gribas AV, Vdovenko MM, et al. (2013) Development of ultrasensitive direct chemiluminescent enzyme immunoassay for determination of aflatoxin B1 in food products. Talanta 107: 25-29. https://doi.org/10.1016/j.talanta.2012.12.047 doi: 10.1016/j.talanta.2012.12.047
|
| [27] | Ghaednia B, Bayat M, Sohrabi Haghdoost I, et al. (2013) Effects of aflatoxin B1 on growth performance, health indices, phagocytic activity and histopathological alteration in Fenneropenaeus indicus. Iran J Fish Sci 12: 723-737. |
| [28] |
Nakai VK, de Oliveira Rocha L, Gonçalez E, et al. (2008) Distribution of fungi and aflatoxins in a stored peanut variety. Food Chem 106: 285-290. https://doi.org/10.1016/j.foodchem.2007.05.087 doi: 10.1016/j.foodchem.2007.05.087
|
| [29] |
Marin S, Ramos A, Cano-Sancho G, et al. (2013) Mycotoxins: Occurrence, toxicology, and exposure assessment. Food Chem Toxicol 60: 218-237. https://doi.org/10.1016/j.fct.2013.07.047 doi: 10.1016/j.fct.2013.07.047
|
| [30] |
Chain EPoCitF, Schrenk D, Bignami M, et al. (2020) Risk assessment of aflatoxins in food. EFSA Journal 18: e06040. https://doi.org/10.2903/j.efsa.2020.6040 doi: 10.2903/j.efsa.2020.6040
|
| [31] |
Jahanbakhsh M, Afshar A, Momeni Feeli S, et al. (2021) Probabilistic health risk assessment (Monte Carlo simulation method) and prevalence of aflatoxin B1 in wheat flours of Iran. Int J Environ Anal Chem 101: 1074-1085. https://doi.org/10.1080/03067319.2019.1676421 doi: 10.1080/03067319.2019.1676421
|
| [32] |
Karimi F, Shariatifar N, Rezaei M, et al. (2021) Quantitative measurement of toxic metals and assessment of health risk in agricultural products food from Markazi Province of Iran. Int J Food Contam 8: 2. https://doi.org/10.1186/s40550-021-00083-0 doi: 10.1186/s40550-021-00083-0
|
| [33] |
Kiani A, Ahmadloo M, Moazzen M, et al. (2021) Monitoring of polycyclic aromatic hydrocarbons and probabilistic health risk assessment in yogurt and butter in Iran. Food Sci Nutr 9: 2114-2128. https://doi.org/10.1002/fsn3.2180 doi: 10.1002/fsn3.2180
|
| [34] |
Yaminifar S, Aeenehvand S, Ghelichkhani G, et al. (2021) The measurement and health risk assessment of polychlorinated biphenyls in butter samples using the QuEChERS/GC-MS method. Int J Dairy Technol 74:737-46. https://doi.org/10.1111/1471-0307.12805 doi: 10.1111/1471-0307.12805
|
| [35] | EPA (2015) United States Environmental Protection Agency, Quantitative Risk Assessment Calculations, National Academy Press, Washington 13: 7-9. |
| [36] |
Nabizadeh S, Shariatifar N, Shokoohi E, et al. (2018) Prevalence and probabilistic health risk assessment of aflatoxins B 1, B 2, G 1, and G 2 in Iranian edible oils. Environ Sci Pollut Res 25: 35562-35570. https://doi.org/10.1007/s11356-018-3510-0 doi: 10.1007/s11356-018-3510-0
|
| [37] | Akbari-Adergani B, Poorasad M, Esfandiari Z (2018) Sunset yellow, tartrazine and sodium benzoate in orange juice distributed in Iranian market and subsequent exposure assessment. Int Food Res J 25: 975-981. |
| [38] |
Rasouli Z, Akbari-Adergani B (2016) Assessment of aspartame exposure due to consumption of some imported chewing gums by microwave digestion and high performance liquid chromatography analysis. Orient J Chem 32: 1649-1658. https://doi.org/10.13005/ojc/320342 doi: 10.13005/ojc/320342
|
| [39] | EPA (2010) Application of the Margin of Exposure (MoE) Approach to Substances in Food that are Genotoxic and Carcinogenic Example: Benzo[a]pyrene and polycyclic aromatic hydrocarbons, Application of the Margin of Exposure (MoE) Approach to Substances in Food that are Genotoxic and Carcinogenic Example: Benzo[a]pyrene and polycyclic aromatic hydrocarbons 48: 2-24. https://doi.org/10.1016/j.fct.2009.09.039 |
| [40] |
Authority EFS (2007) Opinion of the scientific panel on contaminants in the food chain[CONTAM] related to the potential increase of consumer health risk by a possible increase of the existing maximum levels for aflatoxins in almonds, hazelnuts and pistachios and derived products. EFSA Journal 5: 446. https://doi.org/10.2903/j.efsa.2007.446 doi: 10.2903/j.efsa.2007.446
|
| [41] |
Foerster C, Muñoz K, Delgado-Rivera L, et al. (2020) Occurrence of relevant mycotoxins in food commodities consumed in Chile. Mycotoxin Res 36: 63-72. https://doi.org/10.1007/s12550-019-00369-5 doi: 10.1007/s12550-019-00369-5
|
| [42] | US Environmental Protection Agency (2001) Risk Assessment Guidance for Superfund (RAGS) Volume Ⅲ. Available from: https://www.epa.gov/sites/default/files/2015-09/documents/rags3adt_complete.pdf |
| [43] |
Saghafi M, Shariatifar N, Alizadeh Sani M, et al. (2021) Analysis and probabilistic health risk assessment of some trace elements contamination and sulphur dioxide residual in raisins. Int J Environ Anal Chem 2021: 1986037. https://doi.org/10.1080/03067319.2021.1986037 doi: 10.1080/03067319.2021.1986037
|
| [44] |
Moazzen M, Shariatifar N, Arabameri M, et al. (2022) Measurement of Polycyclic Aromatic Hydrocarbons in Baby Food Samples in Tehran, Iran With Magnetic-Solid-Phase-Extraction and Gas-Chromatography/Mass-Spectrometry Method: A Health Risk Assessment. Front Nutr 9: 833158. https://doi.org/10.3389/fnut.2022.833158 doi: 10.3389/fnut.2022.833158
|
| [45] |
Shariatifar N, Moazzen M, Arabameri M, et al. (2021) Measurement of polycyclic aromatic hydrocarbons (PAHs) in edible mushrooms (raw, grilled and fried) using MSPE-GC/MS method: a risk assessment study. Appl Biol Chem 64: 61. https://doi.org/10.1186/s13765-021-00634-1 doi: 10.1186/s13765-021-00634-1
|
| [46] |
Rezaei H, Moazzen M, Shariatifar N, et al. (2021) Measurement of phthalate acid esters in non-alcoholic malt beverages by MSPE-GC/MS method in Tehran city: chemometrics. Environ Sci Pollut Res 28: 51897-51907. https://doi.org/10.1007/s11356-021-14290-x doi: 10.1007/s11356-021-14290-x
|
| [47] |
Yaminifar S, Aeenehvand S, Ghelichkhani G, et al. (2021) The measurement and health risk assessment of polychlorinated biphenyls in butter samples using the QuEChERS/GC-MS method. Int J Dairy Technol 74: 737-46. https://doi.org/10.1111/1471-0307.12805 doi: 10.1111/1471-0307.12805
|
| [48] |
Moradi M, Bolandi M, Arabameri M, et al. (2021) Semi-volume gluten-free bread: effect of guar gum, sodium caseinate and transglutaminase enzyme on the quality parameters. J Food Meas Charact 15: 2344-51. https://doi.org/10.1007/s11694-021-00823-y doi: 10.1007/s11694-021-00823-y
|
| [49] |
Heydarieh A, Arabameri M, Ebrahimi A, et al. (2020) Determination of Magnesium, Calcium and Sulphate Ion Impurities in Commercial Edible Salt. J Chem Health Risks 10: 93-102. https://doi.org/ 10.22034/jchr.2020.1883343.1067 doi: 10.22034/jchr.2020.1883343.1067
|
| [50] | Diella G, Caggiano G, Ferrieri F, et al. (2018) Aflatoxin contamination in nuts marketed in Italy: Preliminary results. Ann Ig 30: 401-409. |
| [51] |
Ding XX, Li PW, Bai YZ, et al. (2012) Aflatoxin B-1 in post-harvest peanuts and dietary risk in China. Food Control 23: 143-148. https://doi.org/10.1016/j.foodcont.2011.06.026 doi: 10.1016/j.foodcont.2011.06.026
|
| [52] |
El tawila MM, Neamatallah A, Serdar SA (2013) Incidence of aflatoxins in commercial nuts in the holy city of Mekkah. Food Control 29: 121-124. https://doi.org/10.1016/j.foodcont.2012.06.004 doi: 10.1016/j.foodcont.2012.06.004
|
| [53] |
Christofidou M, Kafouris D, Christodoulou M, et al. (2015) Occurrence, surveillance, and control of mycotoxins in food in Cyprus for the years 2004-2013. Food Agric Immunol 26: 880-895. https://doi.org/10.1080/09540105.2015.1039499 doi: 10.1080/09540105.2015.1039499
|
| [54] |
Hoeltz M, Einloft TC, Oldoni VP, et al. (2012) The occurrence of aflatoxin B 1 contamination in peanuts and peanut products marketed in southern brazil. Braz Arch Biol Technol 55: 313-317. https://doi.org/10.1590/S1516-89132012000200019 doi: 10.1590/S1516-89132012000200019
|
| [55] | Commission CA (1995) Codex general standard for contaminants and toxins in food and feed. Codex Standard 193: 1-14. |
| [56] |
Fernández Pinto V, Patriarca A, Locani O, et al. (2001) Natural co-occurrence of aflatoxin and cyclopiazonic acid in peanuts grown in Argentina. Food Addit Contam 18: 1017-1020. https://doi.org/10.1080/02652030110057125 doi: 10.1080/02652030110057125
|
| [57] |
Freitas VP, Brigido BM (1998) Occurrence of aflatoxins B1, B2, G1, and G2 in peanuts and their products marketed in the region of Campinas, Brazil in 1995 and 1996. Food Addit Contam 15: 807-811. https://doi.org/10.1080/02652039809374714 doi: 10.1080/02652039809374714
|
| [58] |
Liu Y, Wu F (2010) Global burden of aflatoxin-induced hepatocellular carcinoma: a risk assessment. Environ Health Perspect 118: 818-824. https://doi.org/10.1289/ehp.0901388 doi: 10.1289/ehp.0901388
|
| [59] |
Sabran MR, Jamaluddin R, Mutalib MSA (2012) Screening of aflatoxin M1, a metabolite of aflatoxin B1 in human urine samples in Malaysia: a preliminary study. Food Control 28: 55-58. https://doi.org/10.1016/j.foodcont.2012.04.048 doi: 10.1016/j.foodcont.2012.04.048
|
| [60] |
Zhang W, Liu Y, Liang B, et al. (2020) Probabilistic risk assessment of dietary exposure to aflatoxin B 1 in Guangzhou, China. Sci Rep 10: 7973. https://doi.org/10.1038/s41598-020-64295-8 doi: 10.1038/s41598-020-64295-8
|
| [61] |
Taghizadeh SF, Rezaee R, Badibostan H, et al. (2020) Aflatoxin B1 in walnuts: a probabilistic cancer risk assessment for Iranians. Toxicol Environ Chem 2020: 1791868. https://doi.org/10.1080/02772248.2020.1791868 doi: 10.1080/02772248.2020.1791868
|
| [62] |
Do TH, Tran SC, Le CD, et al. (2020) Dietary exposure and health risk characterization of aflatoxin B1, ochratoxin A, fumonisin B1, and zearalenone in food from different provinces in Northern Vietnam. Food Control 112: 107108. https://doi.org/10.1016/j.foodcont.2020.107108 doi: 10.1016/j.foodcont.2020.107108
|
| [63] |
Cano-Sancho G, Marin S, Ramos A, et al. (2010) Biomonitoring of Fusarium spp. mycotoxins: perspectives for an individual exposure assessment tool. Food Sci Technol Int 16: 266-276. https://doi.org/10.1177/1082013210368884 doi: 10.1177/1082013210368884
|
 agrfood-07-01-009-Supplementary.pdf agrfood-07-01-009-Supplementary.pdf |
 |


Figures(4) / Tables(3)

Arezoo Ebrahimi, Alireza Emadi, Majid Arabameri, Ahmad Jayedi, Anna Abdolshahi, Behdad Shokrolahi Yancheshmeh, Nabi Shariatifar. The prevalence of aflatoxins in different nut samples: A global systematic review and probabilistic risk assessment[J]. AIMS Agriculture and Food, 2022, 7(1): 130-148. doi: 10.3934/agrfood.2022009


 DownLoad: