This study was conducted to investigate first the bacterial contamination by Enterobacteriaceae, fecal coliforms and the prevalence of Salmonella spp. and second to identify the main associated risk factors in Algerian farms, slaughterhouses and butcheries during a two-years period. Thus, a cross-sectional study was performed using a simple random sampling method to target 20 farms, 10 slaughterhouses and 5 butcheries. A structured questionnaire was further used to assess hygienic status of the farms and slaughterhouses. A total of 265 samples were collected from wall, floor, litter, food, water and animals' samples composed mainly of meat, neck skin and liver. Samples from walls and floors, from different sites were analyzed to evaluate the overall contamination and the hygiene of sites for Total viable bacteria, Enterobacteriaceae counts and Fecal coliforms counts. Furthermore, E.coli and salmonella spp. were identified in all samples. The overall contamination by sampling sites expressed as log10 CFU/g (mean ± SD) for Total Aerobic Microbial Count, Enterobacteriaceae count and fecal coliforms counts were around 4.71 ± 1.1, 4.73 ± 1.3 and 4.68 ± 1.2 respectively. The findings evidenced that the prevalence of E.coli and Salmonella spp. were 63.40% and 18.49% respectively. The highest rate of E.coli contamination was for poultry farms (70%), beef farms (64%) and butcheries (74.54%) followed by poultry meat slaughterhouses (60%) and sheep farms (48%) while beef slaughterhouses have the lowest rate of contamination (33.84%). For salmonella spp. the contamination was found to be mainly in poultry meat slaughterhouses (31.11%), butcheries (25.45%), followed by poultry farms (22%), beef farms (20%) and sheep farms (12%) while beef slaughterhouses have the lowest rate of contamination (4.61%). This study evidenced multifactor effects of microbial contamination in farms such as animal density, litter hygiene and scraping, manure storage, water and pest control, contact with other animals and decontamination process. Overall, this trial indicated a high rate of microbial contamination for which further studies are needed to determine all the potential risk factors in order to evaluate the corrective effects.
Citation: Khireddine Ghougal, Amira Leila Dib, Nedjoua Lakhdara, Melisa Lamri, Sameh Baghezza, Abdennour Azizi, Rayane Merrad, Ahmed Zouikri, Daoud Cheraitia, Messaoud Trouni, Hichem Soualah, Elena Moreno, Elena Espigares, Mohammed Gagaoua. Risk factors related to bacterial contamination by Enterobacteriaceae and fecal coliforms and the prevalence of Salmonella spp. in Algerian farms, slaughterhouses and butcheries: a two-year follow-up study[J]. AIMS Agriculture and Food, 2021, 6(3): 768-785. doi: 10.3934/agrfood.2021046
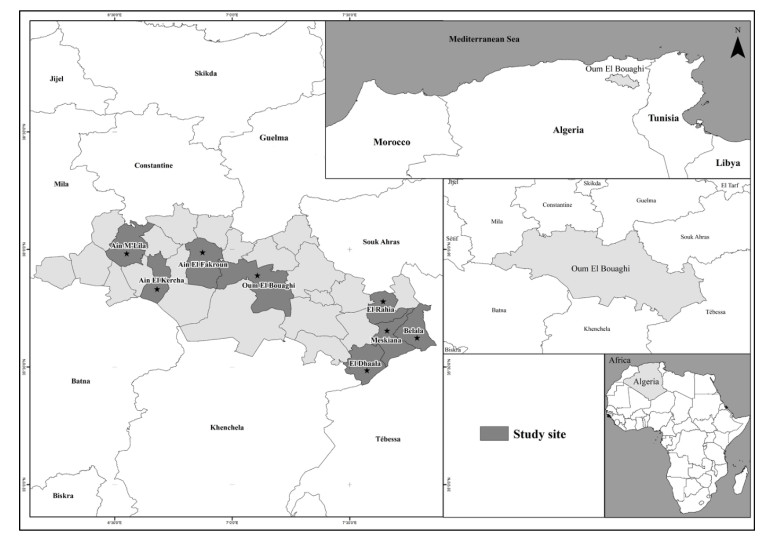
This study was conducted to investigate first the bacterial contamination by Enterobacteriaceae, fecal coliforms and the prevalence of Salmonella spp. and second to identify the main associated risk factors in Algerian farms, slaughterhouses and butcheries during a two-years period. Thus, a cross-sectional study was performed using a simple random sampling method to target 20 farms, 10 slaughterhouses and 5 butcheries. A structured questionnaire was further used to assess hygienic status of the farms and slaughterhouses. A total of 265 samples were collected from wall, floor, litter, food, water and animals' samples composed mainly of meat, neck skin and liver. Samples from walls and floors, from different sites were analyzed to evaluate the overall contamination and the hygiene of sites for Total viable bacteria, Enterobacteriaceae counts and Fecal coliforms counts. Furthermore, E.coli and salmonella spp. were identified in all samples. The overall contamination by sampling sites expressed as log10 CFU/g (mean ± SD) for Total Aerobic Microbial Count, Enterobacteriaceae count and fecal coliforms counts were around 4.71 ± 1.1, 4.73 ± 1.3 and 4.68 ± 1.2 respectively. The findings evidenced that the prevalence of E.coli and Salmonella spp. were 63.40% and 18.49% respectively. The highest rate of E.coli contamination was for poultry farms (70%), beef farms (64%) and butcheries (74.54%) followed by poultry meat slaughterhouses (60%) and sheep farms (48%) while beef slaughterhouses have the lowest rate of contamination (33.84%). For salmonella spp. the contamination was found to be mainly in poultry meat slaughterhouses (31.11%), butcheries (25.45%), followed by poultry farms (22%), beef farms (20%) and sheep farms (12%) while beef slaughterhouses have the lowest rate of contamination (4.61%). This study evidenced multifactor effects of microbial contamination in farms such as animal density, litter hygiene and scraping, manure storage, water and pest control, contact with other animals and decontamination process. Overall, this trial indicated a high rate of microbial contamination for which further studies are needed to determine all the potential risk factors in order to evaluate the corrective effects.

| [1] | MADR (2019) Ministère de l'agriculture et du développement rural: Statistiques agricoles et production animale. |
| [2] | Sraïri MT (2011) Le développement de l'élevage au Maroc: succès relatifs et dépendance alimentaire. Le Courrier de l'environnement de l'INRA 60: 91-101. |
| [3] |
Heredia N, García S (2018) Animals as sources of food-borne pathogens: A review. Anim Nutr 4: 250-255. doi: 10.1016/j.aninu.2018.04.006

|
| [4] |
Hemalata V, Virupakshaiah D (2016) Isolation and identification of food borne pathogens from spoiled food samples. Int J Curr Microbiol Appl Sci 5: 1017-1025. doi: 10.20546/ijcmas.2016.506.108
|
| [5] |
Aklilu A, Kahase D, Dessalegn M, et al. (2015) Prevalence of intestinal parasites, salmonella and shigella among apparently health food handlers of Addis Ababa University student's cafeteria, Addis Ababa, Ethiopia. BMC Res Notes 8: 1-6. doi: 10.1186/s13104-014-0967-x
|
| [6] |
Hoffmann S, Devleesschauwer B, Aspinall W, et al. (2017) Attribution of global foodborne disease to specific foods: Findings from a World Health Organization structured expert elicitation. PLoS One 12: e0183641. doi: 10.1371/journal.pone.0183641
|
| [7] | İnanç A, Mustafa AS (2018) Antibiotic Resistance of Escherichia coli O157: H7 Isolated from Chicken Meats. KSÜ Doğa Bilimleri Dergisi 21: 7-12. |
| [8] |
Zhao X, Lin CW, Wang J, et al. (2014) Advances in rapid detection methods for foodborne pathogens. J Microbiol Biotechnol 24: 297-312. doi: 10.4014/jmb.1310.10013
|
| [9] |
Elmonir W, Abo-Remela E, Sobeih A (2018) Public health risks of Escherichia coli and Staphylococcus aureus in raw bovine milk sold in informal markets in Egypt. J Infect Dev Countries 12: 533-541. doi: 10.3855/jidc.9509
|
| [10] |
Allocati N, Masulli M, Alexeyev MF, et al. (2013) Escherichia coli in Europe: An overview. Int J Environ Res Public Health 10: 6235-6254. doi: 10.3390/ijerph10126235
|
| [11] |
Amézquita-López BA, Soto-Beltrán M, Lee BG, et al. (2018) Isolation, genotyping and antimicrobial resistance of Shiga toxin-producing Escherichia coli. J of Microbiol, Immunol Infect 51: 425-434. doi: 10.1016/j.jmii.2017.07.004
|
| [12] | Djeffal S, Mamache B, Elgroud R, et al. (2018) Prevalence and risk factors for Salmonella spp. contamination in broiler chicken farms and slaughterhouses in the northeast of Algeria. Vet World 11: 1102. |
| [13] | Dib AL, Chahed A, Lakhdara N, et al. (2019) Preliminary investigation of the antimicrobial and mechanisms of resistance of Enterobacteria isolated from minced meat in the Northeast of Algeria: The case of butchers from Constantine. Integr Food Nutr Metab 6: 1-7. |
| [14] | OIE (2006) International Office of Epizootic: Guide to good farming practices for animal production food safety. Revue scientifique et technique (International Office of Epizootics) 25: 823-836. |
| [15] | Sobur MA, Sabuj AAM, Sarker R, et al. (2019) Antibiotic-resistant Escherichia coli and Salmonella spp. associated with dairy cattle and farm environment having public health significance. Vet World 12: 984. |
| [16] |
Ibrahim RA, Cryer TL, Lafi SQ, et al. (2019) Identification of Escherichia coli from broiler chickens in Jordan, their antimicrobial resistance, gene characterization and the associated risk factors. BMC Vet Res 15: 1-16. doi: 10.1186/s12917-019-1901-1
|
| [17] |
Barlow RS, Mcmillan KE, Duffy LL, et al. (2015) Prevalence and antimicrobial resistance of Salmonella and Escherichia coli from Australian cattle populations at slaughter. J of food Prot 78: 912-920. doi: 10.4315/0362-028X.JFP-14-476
|
| [18] |
Rodriguez-Rivera LD, Cummings KJ, Loneragan GH, et al. (2016) Salmonella prevalence and antimicrobial susceptibility among dairy farm environmental samples collected in Texas. Foodborne Pathog Dis 13: 205-211. doi: 10.1089/fpd.2015.2037
|
| [19] |
Pangloli P, Dje Y, Oliver S, et al. (2003) Evaluation of methods for recovery of Salmonella from dairy cattle, poultry, and swine farms. J Food Prot 66: 1987-1995. doi: 10.4315/0362-028X-66.11.1987
|
| [20] |
Jaja IF, Bhembe NL, Green E, et al. (2019) Molecular characterisation of antibiotic-resistant Salmonella enterica isolates recovered from meat in South Africa. Acta Tropica 190: 129-136. doi: 10.1016/j.actatropica.2018.11.003
|
| [21] | Hajian S, Rahimi E, Mommtaz H (2011) A 3-year study of Escherichia coli O157: H7 in cattle, camel, sheep, goat, chicken and beef minced meat, 2011 International Conference on Food Engineering and Biotechnology (IPCBEE), 163-165. |
| [22] | Nouichi S, Hamdi TM (2009) Superficial bacterial contamination of ovine and bovine carcasses at El-Harrach slaughterhouse (Algeria). Europ J Sci Res 38: 474-485. |
| [23] | Chong ES, Bidin Z, Bakar N, et al. (2017) Bacterial contamination on beef carcass at selected abattoirs located in Selangor, Malaysia. Malaysian Appl Biol 46: 37-43. |
| [24] |
Duffy L, Small A, Fegan N (2010) Concentration and prevalence of Escherichia coli O157 and Salmonella serotypes in sheep during slaughter at two Australian abattoirs. Aust Vetj 88: 399-404. doi: 10.1111/j.1751-0813.2010.00623.x
|
| [25] |
Lee GY, Jang HI, Hwang IG, et al. (2009) Prevalence and classification of pathogenic Escherichia coli isolated from fresh beef, poultry, and pork in Korea. Int J Food Microbiol 134: 196-200. doi: 10.1016/j.ijfoodmicro.2009.06.013
|
| [26] |
Thorsteinsdottir T, Haraldsson G, Fridriksdottir V, et al. (2010) Prevalence and genetic relatedness of antimicrobial‐resistant escherichia coli isolated from animals, foods and humans in Iceland. Zoonoses Public Health 57: 189-196. doi: 10.1111/j.1863-2378.2009.01256.x
|
| [27] | Ray B (2004) Microbial stress response in the food environment."Fund Food Microbiol". CRC press LLC., New York. |
| [28] |
Phillips D, Sumner J, Alexander JF, et al. (2001) Microbiological quality of Australian beef. J Food Prot 64: 692-696. doi: 10.4315/0362-028X-64.5.692
|
| [29] |
Collobert JF, Dorey F, Dieuleveux V, et al. (2002) Qualité bactériologique de surface de carcasses de bovins. Sci Des Aliments 22: 327-334. doi: 10.3166/sda.22.327-334
|
| [30] | Berends B, Van Knapen F, Snijders J, et al. (1997) Identification and quantification of risk factors regarding Salmonella spp. on pork carcasses. Int J Food Microbiol 36: 199-206. |
| [31] | Jarallah EM, Sahib SI, Yassen K (2014) Isolation and identification of some pathogenic bacterial species contaminated from meats in butchers shops and kebab restaurants in AL-Kut city. Euphrates J Agri Sci 4: 30-37. |
| [32] |
Bantawa K, Rai K, Limbu DS, et al. (2018) Food-borne bacterial pathogens in marketed raw meat of Dharan, eastern Nepal. BMC Res Notes 11: 1-5. doi: 10.1186/s13104-018-3722-x
|
| [33] | Salifou C, Boko K, Attakpa Y, et al. (2013) Evaluation de la qualité bactériologique de viande fraîche de bovins abattus aux abattoirs de Cotonou-Porto-Novo au cours de la chaîne de distribution. J Ani & Plant Sci 17: 2567-2579. |
| [34] |
Adeyanju GT, Ishola O (2014) Salmonella and Escherichia coli contamination of poultry meat from a processing plant and retail markets in Ibadan, Oyo State, Nigeria. Springerplus 3: 1-9. doi: 10.1186/2193-1801-3-139
|
| [35] | Makwana P, Nayak J, Brahmbhatt M, et al. (2015) Detection of Salmonella spp. from chevon, mutton and its environment in retail meat shops in Anand city (Gujarat), India. Vet World 8: 388. |
| [36] | Mansour AMA, Ishlak AMM, Haj-Saeed BA (2019) Evaluation of bacterial contamination on local and imported mutton in meat markets in Benghazi-Libya. Int J Agri Sci 4: 77-83. |
| [37] |
Andrés S, Jiménez A, Sánchez J, et al. (2007) Evaluation of some etiological factors predisposing to diarrhoea in lambs in "La Serena"(Southwest Spain). Small Ruminant Res 70: 272-275. doi: 10.1016/j.smallrumres.2006.04.004
|
| [38] | Kudva IT, Blanch K, Hovde CJ (1998) Analysis of Escherichia coli O157: H7 survival in ovine or bovine manure and manure slurry. Appl Environ Microbiol 64: 3166-3174. |
| [39] | Daniel D (2012) Le parasitisme printanier des agneaux à l'herbe. Réussir Pâ tre. |
| [40] |
Elder RO, Keen JE, Siragusa GR, et al. (2000) Correlation of enterohemorrhagic Escherichia coli O157 prevalence in feces, hides, and carcasses of beef cattle during processing. Proc Natio Acad Sci 97: 2999-3003. doi: 10.1073/pnas.97.7.2999
|
| [41] | Shere J, Bartlett K, Kaspar C (1998) Longitudinal study of Escherichia coli O157: H7 dissemination on four dairy farms in Wisconsin. Appl Environ Microbiol 64: 1390-1399. |
| [42] |
Tablante NL, Myint MS, Johnson YJ, et al. (2002) A survey of biosecurity practices as risk factors affecting broiler performance on the Delmarva Peninsula. Avian Dis 46: 730-734. doi: 10.1637/0005-2086(2002)046[0730:ASOBPA]2.0.CO;2
|
| [43] | Wilkins W, Rajić A, Waldner C, et al. (2010) Distribution of Salmonella serovars in breeding, nursery, and grow-to-finish pigs, and risk factors for shedding in ten farrow-to-finish swine farms in Alberta and Saskatchewan. Can J Vet Res 74: 81-90. |
| [44] | Gonzalez M, Lainez M, Vega S, et al. (2015) Sources for salmonella contamination during pig production in eastern Spain. J Anim Vet Sci 2: 37-42. |
| [45] | Bensid A (2018) Hygiène et inspection des viandes rouges. Algérie : Djelfainfo. |
| [46] |
Eisel W, Linton R, Muriana P (1997) A survey of microbial levels for incoming raw beef, environmental sources, and ground beef in a red meat processing plant. Food Microbiol 14: 273-282. doi: 10.1006/fmic.1996.0094
|
| [47] | Childers A, Keahey E, Kotula A (1977) Reduction of Salmonella and fecal contamination of pork during swine slaughter. J Am Vet Med Asso 171: 1161-1164. |
| [48] |
Haileselassie M, Taddele H, Adhana K, et al. (2013) Food safety knowledge and practices of abattoir and butchery shops and the microbial profile of meat in Mekelle City, Ethiopia. Asian Pac J Trop Biom 3: 407-412. doi: 10.1016/S2221-1691(13)60085-4
|
| [49] | Adebowale O, Alonge D, Agbede S, et al. (2010) Bacteriological assessment of quality of water used at the Bodija municipal abattoir, Ibadan, Nigeria. Sahel J Vet Sci 9: 63-67. |
Figures(1) / Tables(6)

Khireddine Ghougal, Amira Leila Dib, Nedjoua Lakhdara, Melisa Lamri, Sameh Baghezza, Abdennour Azizi, Rayane Merrad, Ahmed Zouikri, Daoud Cheraitia, Messaoud Trouni, Hichem Soualah, Elena Moreno, Elena Espigares, Mohammed Gagaoua. Risk factors related to bacterial contamination by Enterobacteriaceae and fecal coliforms and the prevalence of Salmonella spp. in Algerian farms, slaughterhouses and butcheries: a two-year follow-up study[J]. AIMS Agriculture and Food, 2021, 6(3): 768-785. doi: 10.3934/agrfood.2021046


 DownLoad: