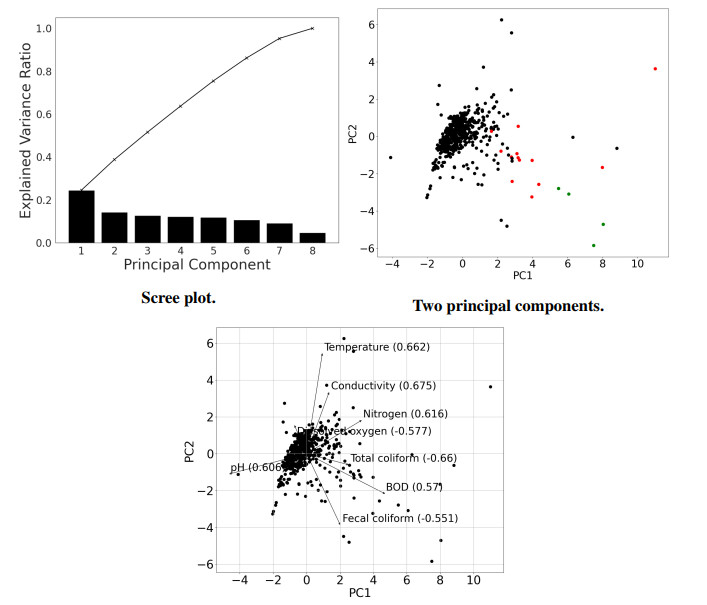
Biochemical oxygen demand (BOD) is an important water quality measurement but takes five days or more to obtain. This may result in delays in taking corrective action in water treatment. Our goal was to develop a BOD predictive model that uses other water quality measurements that are quicker than BOD to obtain; namely pH, temperature, nitrogen, conductivity, dissolved oxygen, fecal coliform, and total coliform. Principal component analysis showed that the data spread was in the direction of the BOD eigenvector. The vectors for pH, temperature, and fecal coliform contributed the greatest to data variation, and dissolved oxygen negatively correlated to BOD. K-means clustering suggested three clusters, and t-distributed stochastic neighbor embedding showed that BOD had a strong influence on variation in the data. Pearson correlation coefficients indicated that the strongest positive correlations were between BOD, and fecal and total coliform, as well as nitrogen. The largest negative correlation was between dissolved oxygen, and BOD. Multiple linear regression (MLR) using fecal, and total coliform, dissolved oxygen, and nitrogen to predict BOD, and training/test data of 80%/20% and 90%/10% had performance indices of RMSE = 2.21 mg/L, r = 0.48 and accuracy of 50.1%, and RMSE = 2.18 mg/L, r = 0.54 and an accuracy of 55.5%, respectively. BOD prediction was better than previous MLR models. Increasing the percentage of the training set above 80% improved the model accuracy but did not significantly impact its prediction. Thus, MLR can be used successfully to estimate BOD in water using other water quality measurements that are quicker to obtain.
Citation: Isaiah Kiprono Mutai, Kristof Van Laerhoven, Nancy Wangechi Karuri, Robert Kimutai Tewo. Using multiple linear regression for biochemical oxygen demand prediction in water[J]. Applied Computing and Intelligence, 2024, 4(2): 125-137. doi: 10.3934/aci.2024008
Biochemical oxygen demand (BOD) is an important water quality measurement but takes five days or more to obtain. This may result in delays in taking corrective action in water treatment. Our goal was to develop a BOD predictive model that uses other water quality measurements that are quicker than BOD to obtain; namely pH, temperature, nitrogen, conductivity, dissolved oxygen, fecal coliform, and total coliform. Principal component analysis showed that the data spread was in the direction of the BOD eigenvector. The vectors for pH, temperature, and fecal coliform contributed the greatest to data variation, and dissolved oxygen negatively correlated to BOD. K-means clustering suggested three clusters, and t-distributed stochastic neighbor embedding showed that BOD had a strong influence on variation in the data. Pearson correlation coefficients indicated that the strongest positive correlations were between BOD, and fecal and total coliform, as well as nitrogen. The largest negative correlation was between dissolved oxygen, and BOD. Multiple linear regression (MLR) using fecal, and total coliform, dissolved oxygen, and nitrogen to predict BOD, and training/test data of 80%/20% and 90%/10% had performance indices of RMSE = 2.21 mg/L, r = 0.48 and accuracy of 50.1%, and RMSE = 2.18 mg/L, r = 0.54 and an accuracy of 55.5%, respectively. BOD prediction was better than previous MLR models. Increasing the percentage of the training set above 80% improved the model accuracy but did not significantly impact its prediction. Thus, MLR can be used successfully to estimate BOD in water using other water quality measurements that are quicker to obtain.

| [1] |
T. Ahmad, K. Ahmad, M. Alam, Sustainable management of water treatment sludge through 3'R' concept, J. Clean. Prod., 124 (2016), 1–13. http://dx.doi.org/10.1016/j.jclepro.2016.02.073 doi: 10.1016/j.jclepro.2016.02.073

|
| [2] |
R. O. Carey, K. W. Migliaccio, Contribution of wastewater treatment plant effluents to nutrient dynamics in aquatic systems: a review, Environ. Manage., 44 (2009), 205–217. http://dx.doi.org/10.1007/s00267-009-9309-5 doi: 10.1007/s00267-009-9309-5
|
| [3] |
G. Crini, E. Lichtfouse, Advantages and disadvantages of techniques used for wastewater treatment, Environ. Chem. Lett., 17 (2019), 145–155. http://dx.doi.org/10.1007/s10311-018-0785-9 doi: 10.1007/s10311-018-0785-9
|
| [4] |
B. E. Igere, A. I. Okoh, U. U. Nwodo, Wastewater treatment plants and release: the vase of odin for emerging bacterial contaminants, resistance and determinant of environmental wellness, Emerging Contaminants, 6 (2020), 212–224. http://dx.doi.org/10.1016/j.emcon.2020.05.003 doi: 10.1016/j.emcon.2020.05.003
|
| [5] |
C. Holeton, P. A. Chambers, L. Grace, Wastewater release and its impacts on canadian waters, Can. J. Fish. Aquat. Sci., 68 (2011), 1836–1859. http://dx.doi.org/10.1139/f2011-096 doi: 10.1139/f2011-096
|
| [6] |
R. Jha, C. Ojha, K. Bhatia, Development of refined bod and do models for highly polluted kali river in india, J. Environ. Eng., 133 (2007), 839–852. http://dx.doi.org/10.1061/(ASCE)0733-9372(2007)133:8(839) doi: 10.1061/(ASCE)0733-9372(2007)133:8(839)
|
| [7] |
P. Yu, J. Cao, V. Jegatheesan, X. Du, A real-time bod estimation method in wastewater treatment process based on an optimized extreme learning machine, Appl. Sci., 9 (2019), 523. http://dx.doi.org/10.3390/app9030523 doi: 10.3390/app9030523
|
| [8] |
K. S. Ooi, Z. Y. Chen, P. E. Poh, J. Cui, Bod5 prediction using machine learning methods, Water Supply, 22 (2022), 1168–1183. http://dx.doi.org/10.2166/ws.2021.202 doi: 10.2166/ws.2021.202
|
| [9] |
M. I. Jordan, T. M. Mitchell, Machine learning: trends, perspectives, and prospects, Science, 349 (2015), 255–260. http://dx.doi.org/10.1126/science.aaa8415 doi: 10.1126/science.aaa8415
|
| [10] |
K. B. Newhart, R. W. Holloway, A. S. Hering, T. Y. Cath, Data-driven performance analyses of wastewater treatment plants: a review, Water Research, 157 (2019), 498–513. http://dx.doi.org/10.1016/j.watres.2019.03.030 doi: 10.1016/j.watres.2019.03.030
|
| [11] |
D. Wang, S. Thunéll, U. Lindberg, L. Jiang, J. Trygg, M. Tysklind, et al., A machine learning framework to improve effluent quality control in wastewater treatment plants, Sci. Total Environ., 784 (2021), 147138. http://dx.doi.org/10.1016/j.scitotenv.2021.147138 doi: 10.1016/j.scitotenv.2021.147138
|
| [12] |
A. E. Bilali, A. Taleb, Prediction of irrigation water quality parameters using machine learning models in a semi-arid environment, Journal of the Saudi Society of Agricultural Sciences, 19 (2020), 439–451. http://dx.doi.org/10.1016/j.jssas.2020.08.001 doi: 10.1016/j.jssas.2020.08.001
|
| [13] |
O. P. Okeke, I. I. Aminu, A. Rotimi, B. Najashi, M. Jibril, A. S. Ibrahim, et al., Performance analysis and control of wastewater treatment plant using adaptive neuro-fuzzy inference system (ANFIS) and multi-linear regression (MLR) techniques, GSC Advanced Engineering and Technology, 4 (2022), 001–016. http://dx.doi.org/10.30574/gscaet.2022.4.2.0033 doi: 10.30574/gscaet.2022.4.2.0033
|
| [14] |
V. Nourani, G. Elkiran, S. Abba, Wastewater treatment plant performance analysis using artificial intelligence–-an ensemble approach, Water Sci. Technol., 78 (2018), 2064–2076. http://dx.doi.org/10.2166/wst.2018.477 doi: 10.2166/wst.2018.477
|
| [15] |
Y. El Hammoudani, F. Dimane, Assessing behavior and fate of micropollutants during wastewater treatment: statistical analysis, Environ. Eng. Res., 26 (2021), 200359. http://dx.doi.org/10.4491/eer.2020.359 doi: 10.4491/eer.2020.359
|
| [16] |
S. Rahmat, W. A. H. Altowayti, N. Othman, S. M. Asharuddin, F. Saeed, S. Basurra, et al., Prediction of wastewater treatment plant performance using multivariate statistical analysis: a case study of a regional sewage treatment plant in melaka, malaysia, Water, 14 (2022), 3297. http://dx.doi.org/10.3390/w14203297 doi: 10.3390/w14203297
|
| [17] |
H. Z. Abyaneh, Evaluation of multivariate linear regression and artificial neural networks in prediction of water quality parameters, J. Environ. Health Sci. Engineer., 12 (2014), 40. http://dx.doi.org/10.1186/2052-336X-12-40 doi: 10.1186/2052-336X-12-40
|
| [18] | K. S. Kumar, P. S. Kumar, M. J. R. Babu, Performance evaluation of waste water treatment plant, International Journal of Engineering Science and Technology, 2 (2010), 7785–7796. |
| [19] | U. Agrawal, Water quality data, Kaggle, 2020. Available from: https://www.kaggle.com/datasets/utcarshagrawal/water-quality-data. |
| [20] |
D. Kobak, P. Berens, The art of using t-sne for single-cell transcriptomics, Nat. Commun., 10 (2019), 5416. http://dx.doi.org/10.1038/s41467-019-13056-x doi: 10.1038/s41467-019-13056-x
|
| [21] | F. Pedregosa, Scikit-learn: machine learning in python fabian, J. Mach. Learn. Res., 12 (2011), 2825. |
| [22] | A. Zollanvari, Supervised learning in practice: the first application using scikit-learn, In: Machine learning with Python: theory and implementation, Cham: Springer, 2023,111–131. http://dx.doi.org/10.1007/978-3-031-33342-2_4 |
| [23] |
M. A. Razi, K. Athappilly, A comparative predictive analysis of neural networks (NNs), nonlinear regression and classification and regression tree (CART) models, Expert Syst. Appl., 29 (2005), 65–74. http://dx.doi.org/10.1016/j.eswa.2005.01.006 doi: 10.1016/j.eswa.2005.01.006
|
| [24] |
D. Chicco, M. J. Warrens, G. Jurman, The coefficient of determination r-squared is more informative than smape, mae, mape, mse and rmse in regression analysis evaluation, PeerJ Comput. Sci., 7 (2021), e623. http://dx.doi.org/10.7717/peerj-cs.623 doi: 10.7717/peerj-cs.623
|
| [25] |
A. Rechkemmer, M. Yin, When confidence meets accuracy: exploring the effects of multiple performance indicators on trust in machine learning models, Proceedings of the 2022 CHI Conference on Human Factors in Computing Systems, 2022,535. http://dx.doi.org/10.1145/3491102.3501967 doi: 10.1145/3491102.3501967
|
| [26] |
G. I. Webb, M. J. Pazzani, D. Billsus, Machine learning for user modeling, User Model. User-Adap., 11 (2001), 19–29. http://dx.doi.org/10.1023/A:1011117102175 doi: 10.1023/A:1011117102175
|
| [27] |
J. L. Lerios, M. V. Villarica, Pattern extraction of water quality prediction using machine learning algorithms of water reservoir, Int. J. Mech. Eng. Rob. Res., 8 (2019), 992–997. http://dx.doi.org/10.18178/ijmerr.8.6.992-997 doi: 10.18178/ijmerr.8.6.992-997
|
| [28] | P. M. Kroonenberg, Applied multiway data analysis, Hoboken: John Wiley & Sons, 2008. |
| [29] |
P. Fränti, R. Mariescu-Istodor, A. Akram, M. Satokangas, E. Reissell, Can we optimize locations of hospitals by minimizing the number of patients at risk? BMC Health Serv. Res., 23 (2023), 415. http://dx.doi.org/10.1186/s12913-023-09375-x doi: 10.1186/s12913-023-09375-x
|
| [30] | T. M. Kodinariya, P. R. Makwana, Review on determining number of cluster in k-means clustering, International Journal of Advance Research in Computer Science and Management Studies, 1 (2013), 90–95. |
| [31] |
E. Dogan, B. Sengorur, R. Koklu, Modeling biological oxygen demand of the melen river in turkey using an artificial neural network technique, J. Environ. Manage., 90 (2009), 1229–1235. http://dx.doi.org/10.1016/j.jenvman.2008.06.004 doi: 10.1016/j.jenvman.2008.06.004
|
| [32] |
P. Schober, C. Boer, L. A. Schwarte, Correlation coefficients: appropriate use and interpretation, Anesth. Analg., 126 (2018), 1763–1768. http://dx.doi.org/10.1213/ANE.0000000000002864 doi: 10.1213/ANE.0000000000002864
|
| [33] |
W. Cui, Z. Sun, H. Ma, S. Wu, The correlation analysis of atmospheric model accuracy based on the pearson correlation criterion, IOP Conf. Ser.: Mater. Sci. Eng., 780 (2020), 032045. http://dx.doi.org/10.1088/1757-899X/780/3/032045 doi: 10.1088/1757-899X/780/3/032045
|
| [34] |
G. K. Uyanık, N. Güler, A study on multiple linear regression analysis, Procedia-Social and Behavioral Sciences, 106 (2013), 234–240. http://dx.doi.org/10.1016/j.sbspro.2013.12.027 doi: 10.1016/j.sbspro.2013.12.027
|
| [35] |
A. Rácz, D. Bajusz, K. Héberger, Effect of dataset size and train/test split ratios in qsar/qspr multiclass classification, Molecules, 26 (2021), 1111. http://dx.doi.org/10.3390/molecules26041111 doi: 10.3390/molecules26041111
|
| [36] |
D. Güçlü, Ş. Dursun, Artificial neural network modelling of a large-scale wastewater treatment plant operation, Bioprocess Biosyst. Eng., 33 (2010), 1051–1058. http://dx.doi.org/10.1007/s00449-010-0430-x doi: 10.1007/s00449-010-0430-x
|
| [37] |
M. M. Hamed, M. G. Khalafallah, E. A. Hassanien, Prediction of wastewater treatment plant performance using artificial neural networks, Environ. Modell. Softw., 19 (2004), 919–928. http://dx.doi.org/10.1016/j.envsoft.2003.10.005 doi: 10.1016/j.envsoft.2003.10.005
|
| [38] | S. A. Rebuffi, S. Gowal, D. A. Calian, F. Stimberg, O. Wiles, T. A. Mann, Data augmentation can improve robustness, Proceedings of the 35th International Conference on Neural Information Processing Systems, 2024, 29935–29948. |
| [39] |
S. R. Shams, A. Jahani, S. Kalantary, M. Moeinaddini, N. Khorasani, The evaluation on artificial neural networks (ANN) and multiple linear regressions (MLR) models for predicting SO$_{2}$ concentration, Urban Clim., 37 (2021), 100837. http://dx.doi.org/10.1016/j.uclim.2021.100837 doi: 10.1016/j.uclim.2021.100837
|
| [40] |
Q. Zhao, P. Fränti, Wb-index: a sum-of-squares based index for cluster validity, Data Knowl. Eng., 92 (2014), 77–89. http://dx.doi.org/10.1016/j.datak.2014.07.008 doi: 10.1016/j.datak.2014.07.008
|
| [41] |
P. Fränti, Efficiency of random swap clustering, J. Big Data, 5 (2018), 13. http://dx.doi.org/10.1186/s40537-018-0122-y doi: 10.1186/s40537-018-0122-y
|
| [42] |
P. Fränti, S. Sieranoja, K. Wikström, T. Laatikainen, Clustering diagnoses from 58 million patient visits in finland between 2015 and 2018, JMIR Med. Inform., 10 (2022), e35422. http://dx.doi.org/10.2196/35422 doi: 10.2196/35422
|


Figures(4) / Tables(4)
Isaiah Kiprono Mutai, Kristof Van Laerhoven, Nancy Wangechi Karuri, Robert Kimutai Tewo. Using multiple linear regression for biochemical oxygen demand prediction in water[J]. Applied Computing and Intelligence, 2024, 4(2): 125-137. doi: 10.3934/aci.2024008


 DownLoad: