Ant cuticle texture presumably provides some type of function, and therefore is useful to research for ecological applications and bioinspired designs. In this study, we employ statistical image texture analysis and deep machine learning methods to classify similar ant species based on morphological features. We establish a public database of ant cuticle images for research. We provide a comparative study of the performance of image texture classification and deep machine learning methods on this ant cuticle dataset. Our results show that the deep learning methods give higher accuracy than statistical methods in recognizing ant cuticle textures. Our experiments also reveal that the deep learning networks designed for image texture performs better than the general deep learning networks.
Citation: Noah Gardner, John Paul Hellenbrand, Anthony Phan, Haige Zhu, Zhiling Long, Min Wang, Clint A. Penick, Chih-Cheng Hung. Investigation of ant cuticle dataset using image texture analysis[J]. Applied Computing and Intelligence, 2022, 2(2): 133-151. doi: 10.3934/aci.2022008
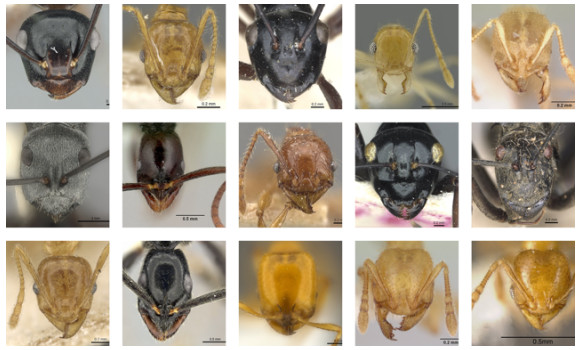
Ant cuticle texture presumably provides some type of function, and therefore is useful to research for ecological applications and bioinspired designs. In this study, we employ statistical image texture analysis and deep machine learning methods to classify similar ant species based on morphological features. We establish a public database of ant cuticle images for research. We provide a comparative study of the performance of image texture classification and deep machine learning methods on this ant cuticle dataset. Our results show that the deep learning methods give higher accuracy than statistical methods in recognizing ant cuticle textures. Our experiments also reveal that the deep learning networks designed for image texture performs better than the general deep learning networks.

| [1] |
R. Beaman and N. Cellinese, Mass digitization of scientific collections: New opportunities to transform the use of biological specimens and underwrite biodiversity science, ZooKeys, 209 (2012), 7–17. https://doi.org/10.3897/zookeys.209.3313 doi: 10.3897/zookeys.209.3313

|
| [2] |
M. H. Bharati, J. J. Liu and J. F. MacGregor, Image texture analysis: methods and comparisons, Chemometr. Intell. Lab., 72 (2004), 57–71. https://doi.org/10.1016/j.chemolab.2004.02.005 doi: 10.1016/j.chemolab.2004.02.005
|
| [3] | B. Bolton, Identification guide to the ant genera of the world, Harvard University Press, Cambridge, Mass, 1994. |
| [4] |
A. C. Bovik, M. Clark and W. S. Geisler, Multichannel texture analysis using localized spatial filters, IEEE T. Pattern Anal., 12 (1990), 55–73. https://doi.org/10.1109/34.41384 doi: 10.1109/34.41384
|
| [5] |
A. Brückner, M. Heethoff and N. Blüthgen, The relationship between epicuticular long-chained hydrocarbons and surface area - volume ratios in insects (Diptera, Hymenoptera, Lepidoptera), PLOS ONE, 12 (2017), e0175001, https://doi.org/10.1371/journal.pone.0175001 doi: 10.1371/journal.pone.0175001
|
| [6] | Z. Chen, F. Li, Y. Quan, Y. Xu and H. Ji, Deep Texture Recognition via Exploiting Cross-Layer Statistical Self-Similarity, in 2021 IEEE/CVF Conference on Computer Vision and Pattern Recognition (CVPR), (2021), 5231–5240. |
| [7] |
D. Chicco, M. J. Warrens and G. Jurman, The matthews correlation coefficient (mcc) is more informative than cohen's kappa and brier score in binary classification assessment, IEEE Access, 9 (2021), 78368–78381. https://doi.org/10.1109/ACCESS.2021.3084050 doi: 10.1109/ACCESS.2021.3084050
|
| [8] |
K. K. Chung, J. F. Schumacher, E. M. Sampson, R. A. Burne, P. J. Antonelli and A. B. Brennan, Impact of engineered surface microtopography on biofilm formation of Staphylococcus aureus, Biointerphases, 2 (2007), 89–94. https://doi.org/10.1116/1.2751405 doi: 10.1116/1.2751405
|
| [9] | M. Cimpoi, S. Maji and A. Vedaldi, Deep filter banks for texture recognition and segmentation, in 2015 IEEE Conference on Computer Vision and Pattern Recognition (CVPR), (2015), 3828–3836. https://doi.org/10.1109/CVPR.2015.7299007 |
| [10] |
G. R. Cross and A. K. Jain, Markov random field texture models, IEEE T. Pattern Anal., PAMI-5 (1983), 25–39. https://doi.org/10.1109/TPAMI.1983.4767341 doi: 10.1109/TPAMI.1983.4767341
|
| [11] |
C. R. Currie, Coevolved Crypts and Exocrine Glands Support Mutualistic Bacteria in Fungus-Growing Ants, Science, 311 (2006), 81–83. https://doi.org/10.1126/science.1119744 doi: 10.1126/science.1119744
|
| [12] | J. Deng, W. Dong, R. Socher, L.-J. Li, K. Li and L. Fei-Fei, ImageNet: A large-scale hierarchical image database, in 2009 IEEE Conference on Computer Vision and Pattern Recognition, (2009), 248–255. |
| [13] | L. Feng and B. Bhanu, Automated identification and retrieval of moth images with semantically related visual attributes on the wings, in 2013 IEEE International Conference on Image Processing, (2013), 2577–2581. |
| [14] | K. Fukunaga, Introduction to statistical pattern recognition, Elsevier, 2013. |
| [15] | J. A. Glick and K. Miller, Insect Classification With Heirarchical Deep Convolutional Neural Networks, Convolutional Neural Networks for Visual Recognition, (2016). |
| [16] |
C. C. Gotlieb and H. E. Kreyszig, Texture descriptors based on co-occurrence matrices, Computer Vision, Graphics, and Image Processing, 51 (1990), 70–86. https://doi.org/10.1016/S0734-189X(05)80063-5 doi: 10.1016/S0734-189X(05)80063-5
|
| [17] | P. J. Gullan and P. S. Cranston, The Insects: an Outline of Entomology, Wiley, Hoboken, 2009. |
| [18] |
S. Gunderson and R. Schiavone, The insect exoskeleton: A natural structural composite, JOM, 41 (1989), 60–63. https://doi.org/10.1007/BF03220386 doi: 10.1007/BF03220386
|
| [19] |
Z. Han, H. Feng, W. Yin, S. Niu, J. Zhang and D. Chen, An Efficient Bionic Anti-Erosion Functional Surface Inspired by Desert Scorpion Carapace, Tribol. T., 58 (2015), 357–364. https://doi.org/10.1080/10402004.2014.971996 doi: 10.1080/10402004.2014.971996
|
| [20] |
R. M. Haralick, K. Shanmugam and I. Dinstein, Textural Features for Image Classification, IEEE Transactions on Systems, Man, and Cybernetics, SMC-3 (1973), 610–621. https://doi.org/10.1109/TSMC.1973.4309314 doi: 10.1109/TSMC.1973.4309314
|
| [21] |
R. M. Haralick and L. G. Shapiro, Image segmentation techniques, Computer vision, graphics, and image processing, 29 (1985), 100–132. https://doi.org/10.1016/S0734-189X(85)90153-7 doi: 10.1016/S0734-189X(85)90153-7
|
| [22] | R. A. Harris, A Glossary Of Surface Sculpturing, Occasional Papers in Entomology, 28 (1979), 1–31. |
| [23] |
J. Hasan, H. K. Webb, V. K. Truong, S. Pogodin, V. A. Baulin, G. S. Watson, et al., Selective bactericidal activity of nanopatterned superhydrophobic cicada Psaltoda claripennis wing surfaces, Appl. Microbiol. Biot., 97 (2013), 9257–9262. https://doi.org/10.1007/s00253-012-4628-5 doi: 10.1007/s00253-012-4628-5
|
| [24] |
M. Hassner and J. Sklansky, The use of markov random fields as models of texture, Image Modeling, (1981), 185–198. https://doi.org/10.1016/B978-0-12-597320-5.50015-2 doi: 10.1016/B978-0-12-597320-5.50015-2
|
| [25] | K. He, X. Zhang, S. Ren and J. Sun, Deep Residual Learning for Image Recognition, in 2016 IEEE Conference on Computer Vision and Pattern Recognition (CVPR), (2016), 770–778. https://doi.org/10.1109/CVPR.2016.90 |
| [26] | J. Hellenbrand and C. Penick, Ant cuticle sculpturing: diversity, classification, and function, submitted for publication. |
| [27] | Y. Hu, Z. Long and G. AlRegib, Multi-Level Texture Encoding and Representation (Multer) Based on Deep Neural Networks, in 2019 IEEE International Conference on Image Processing (ICIP), (2019), 4410–4414. https://doi.org/10.1109/ICIP.2019.8803640 |
| [28] | C.-C. Hung, E. Song and Y. Lan, Image Texture Analysis: Foundations, Models and Algorithms, Springer International Publishing, Cham, 2019. |
| [29] | C.-C. Hung, S. Yang and C. M. Laymon, Use of characteristic views in image classification, in 16th International Conference on Pattern Recognition, ICPR 2002, (2002), 949–952. https://doi.org/10.1109/ICPR.2002.1048462 |
| [30] |
R. A. Johnson, A. Kaiser, M. Quinlan and W. Sharp, Effect of cuticular abrasion and recovery on water loss rates in queens of the desert harvester ant Messor pergandei, J. Exp. Biol., 214 (2011), 3495–3506. https://doi.org/10.1242/jeb.054304 doi: 10.1242/jeb.054304
|
| [31] |
T. Kasinathan and S. R. Uyyala, Machine learning ensemble with image processing for pest identification and classification in field crops, Neural Computing and Applications, 33 (2021), 7491–7504. https://doi.org/10.1007/s00521-020-05497-z doi: 10.1007/s00521-020-05497-z
|
| [32] |
A. Krizhevsky, I. Sutskever and G. E. Hinton, ImageNet classification with deep convolutional neural networks, Commun. ACM, 60 (2017), 84–90. https://doi.org/10.1145/3065386 doi: 10.1145/3065386
|
| [33] | S. Lim, S. Kim and D. Kim, Performance effect analysis for insect classification using convolutional neural network, in 2017 7th IEEE International Conference on Control System, Computing and Engineering (ICCSCE), (2017), 210–215. https://doi.org/10.1109/ICCSCE.2017.8284406 |
| [34] |
L. Liu, J. Chen, P. Fieguth, G. Zhao, R. Chellappa and M. Pietikäinen, From BoW to CNN: Two Decades of Texture Representation for Texture Classification, Int. J. Comput. Vision, 127 (2019), 74–109. https://doi.org/10.1007/s11263-018-1125-z doi: 10.1007/s11263-018-1125-z
|
| [35] |
L. Liu, R. Wang, C. Xie, P. Yang, F. Wang, S. Sudirman, et al., PestNet: An End-to-End Deep Learning Approach for Large-Scale Multi-Class Pest Detection and Classification, IEEE Access, 7 (2019), 45301–45312. https://doi.org/10.1109/ACCESS.2019.2909522 doi: 10.1109/ACCESS.2019.2909522
|
| [36] |
S. Lloyd, Least squares quantization in pcm, IEEE T. Inform. Theory, 28 (1982), 129–137. https://doi.org/10.1109/TIT.1982.1056489 doi: 10.1109/TIT.1982.1056489
|
| [37] |
D. G. Lowe, Distinctive Image Features from Scale-Invariant Keypoints, Int. J. Comput. Vision, 60 (2004), 91–110. https://doi.org/10.1023/B:VISI.0000029664.99615.94 doi: 10.1023/B:VISI.0000029664.99615.94
|
| [38] |
S. Mao, D. Rajan and L. T. Chia, Deep residual pooling network for texture recognition, Pattern Recogn., 112 (2021), 107817. https://doi.org/10.1016/j.patcog.2021.107817 doi: 10.1016/j.patcog.2021.107817
|
| [39] |
A. C. R. Marques, M. M. Raimundo, E. M. B. Cavalheiro, L. F. P. Salles, C. Lyra and F. J. V. Zuben, Ant genera identification using an ensemble of convolutional neural networks, PLOS ONE, 13 (2018), e0192011. https://doi.org/10.1371/journal.pone.0192011 doi: 10.1371/journal.pone.0192011
|
| [40] |
M. Martineau, D. Conte, R. Raveaux, I. Arnault, D. Munier and G. Venturini, A survey on image-based insect classification, Pattern Recogn., 65 (2017), 273–284. https://doi.org/10.1016/j.patcog.2016.12.020 doi: 10.1016/j.patcog.2016.12.020
|
| [41] |
S. Muthukrishnan, S. Mun, M. Y. Noh, E. R. Geisbrecht and Y. Arakane, Insect Cuticular Chitin Contributes to Form and Function, Curr. Pharm. Design, 26 (2020), 3530–3545. https://doi.org/10.2174/1381612826666200523175409 doi: 10.2174/1381612826666200523175409
|
| [42] | T. Ojala, M. Pietikäinen and T. Mäenpää, Gray Scale and Rotation Invariant Texture Classification with Local Binary Patterns, in European conference on Computer Vision - ECCV 2000, (2000), 404–420. Springer, Berlin, Heidelberg. https://doi.org/10.1007/3-540-45054-8_27 |
| [43] |
J. Peeples, W. Xu and A. Zare, Histogram Layers for Texture Analysis, IEEE Transactions on Artificial Intelligence, 3 (2021), 541–552. https://dx.doi.org/10.1109/TAI.2021.3135804 doi: 10.1109/TAI.2021.3135804
|
| [44] | C. Penick, G. Cope, S. Morankar, Y. Mistry, A. Grishin, N. Chawla, et al., The comparative approach to bio-inspired design: integrating biodiversity and biologists into the design process, Intergrative and Comparative Biology, (2022). |
| [45] | V. Perrichot and B. Fisher, AntWeb: digitizing Recent and fossil insects for an online database of the ants of the world, in Digital Fossil International Conference, (2012). |
| [46] |
C. J. C. Rees, Form and function in corrugated insect wings, Nature, 256 (1975), 200–203. https://doi.org/10.1038/256200a0 doi: 10.1038/256200a0
|
| [47] | A. Sheikh, N. Rehman and R. Kumar, Diverse adaptations in insects: A review, Journal of entomology and zoology studies, 5 (2017), 343–350. |
| [48] | K. Simonyan and A. Zisserman, Very Deep Convolutional Networks for Large-Scale Image Recognition, arXiv: 1409.1556 [cs]. |
| [49] | X. Sun, Robust texture classification based on machine learning, PhD thesis, Deakin University, 2014. |
| [50] |
H. Tiittanen, L. Holm, P. Törönen, H. Tiittanen, L. Holm and P. Törönen, Novel split quality measures for stratified multilabel cross validation with application to large and sparse gene ontology datasets, Applied Computing and Intelligence, 2 (2022), 49–62. https://doi.org/10.3934/aci.222003 doi: 10.3934/aci.222003
|
| [51] | J. C. Urteaga-Reyesvera and A. Possani-Espinosa, Scorpions: Classification of poisonous species using shape features, in 2016 International Conference on Electronics, Communications and Computers (CONIELECOMP), (2016), 125–129. https://doi.org/10.1109/CONIELECOMP.2016.7438563 |
| [52] |
G. S. Watson, J. A. Watson and B. W. Cribb, Diversity of Cuticular Micro- and Nanostructures on Insects: Properties, Functions, and Potential Applications, Annu. Rev. Entomol., 62 (2017), 185–205. https://doi.org/10.1146/annurev-ento-031616-035020 doi: 10.1146/annurev-ento-031616-035020
|
| [53] | J. Xue, H. Zhang and K. Dana, Deep Texture Manifold for Ground Terrain Recognition, in 2018 IEEE/CVF Conference on Computer Vision and Pattern Recognition, (2018), 558–567. https://dx.doi.org/10.1109/CVPR.2018.00065 |
| [54] | W. Zhai, Y. Cao, Z.-J. Zha, H. Xie and F. Wu, Deep Structure-Revealed Network for Texture Recognition, in 2020 IEEE/CVF Conference on Computer Vision and Pattern Recognition (CVPR), (2020), 11007–11016. https://dx.doi.org/10.1109/CVPR42600.2020.01102 |
| [55] | W. Zhai, Y. Cao, J. Zhang and Z.-J. Zha, Deep Multiple-Attribute-Perceived Network for Real-World Texture Recognition, in 2019 IEEE/CVF International Conference on Computer Vision (ICCV), (2019), 3612–3621. https://dx.doi.org/10.1109/ICCV.2019.00371 |
| [56] | H. Zhang, J. Xue and K. Dana, Deep TEN: Texture Encoding Network, in 2017 IEEE Conference on Computer Vision and Pattern Recognition (CVPR), (2017), 2896–2905. https://dx.doi.org/10.1109/CVPR.2017.309 |
| [57] |
H. Zhiwu, Z. Junqiu, G. Chao, W. Li and L. Ren, Erosion Resistance of Bionic Functional Surfaces Inspired from Desert Scorpions, Langmuir, 28 (2012), 2914–2921. https://doi.org/10.1021/la203942r doi: 10.1021/la203942r
|


Figures(7) / Tables(2)
Noah Gardner, John Paul Hellenbrand, Anthony Phan, Haige Zhu, Zhiling Long, Min Wang, Clint A. Penick, Chih-Cheng Hung. Investigation of ant cuticle dataset using image texture analysis[J]. Applied Computing and Intelligence, 2022, 2(2): 133-151. doi: 10.3934/aci.2022008


 DownLoad: