Despite hypnosis showing efficacy in treating nicotine dependence, its neurobiological impacts on a smokers' brain function remain underexplored. Thirty-three smokers underwent electroencephalography (EEG) recording during pre- and post-hypnosis sessions, each 8 minutes long, alongside Tobacco Craving Questionnaire (TCQ) assessments. Four distinct EEG microstate classes (A, B, C, D) were identified. Daily cigarette consumption negatively correlated with the microstate A duration (r = −0.39, P = 0.03). Hypnosis increased the microstate A parameters while decreasing those of microstate B. Reduced microstate B parameters positively correlated with lower TCQ scores (r = 0.46, P = 0.02). Post-hypnosis, there was a decreased variability and sample entropy in low-frequency theta-band signals, indicating a shift towards more ordered theta oscillations. This shift was inversely related to the microstate D parameters and positively correlated with the microstate C occurrences. Dynamic changes in the brain microstates and theta oscillations elucidate the neurological mechanisms underlying hypnotherapy's effectiveness in treating smoking addiction. These findings provide new insights into the mechanisms by which hypnosis influences brain function and offer potential biomarkers for the treatment of smoking addiction, thus deepening our understanding of therapeutic approaches for substance use disorders.
Citation: Mi Zhang, Junjie Ren, Ni Li, Yongyi Li, Linxi Yang, Wenzhuo Wei, Juan Qiu, Xiaochu Zhang, Xiaoming Li. Hypnosis efficacy on nicotine addiction: An analysis of EEG microstates and brain oscillation entropy[J]. AIMS Neuroscience, 2025, 12(1): 15-31. doi: 10.3934/Neuroscience.2025002
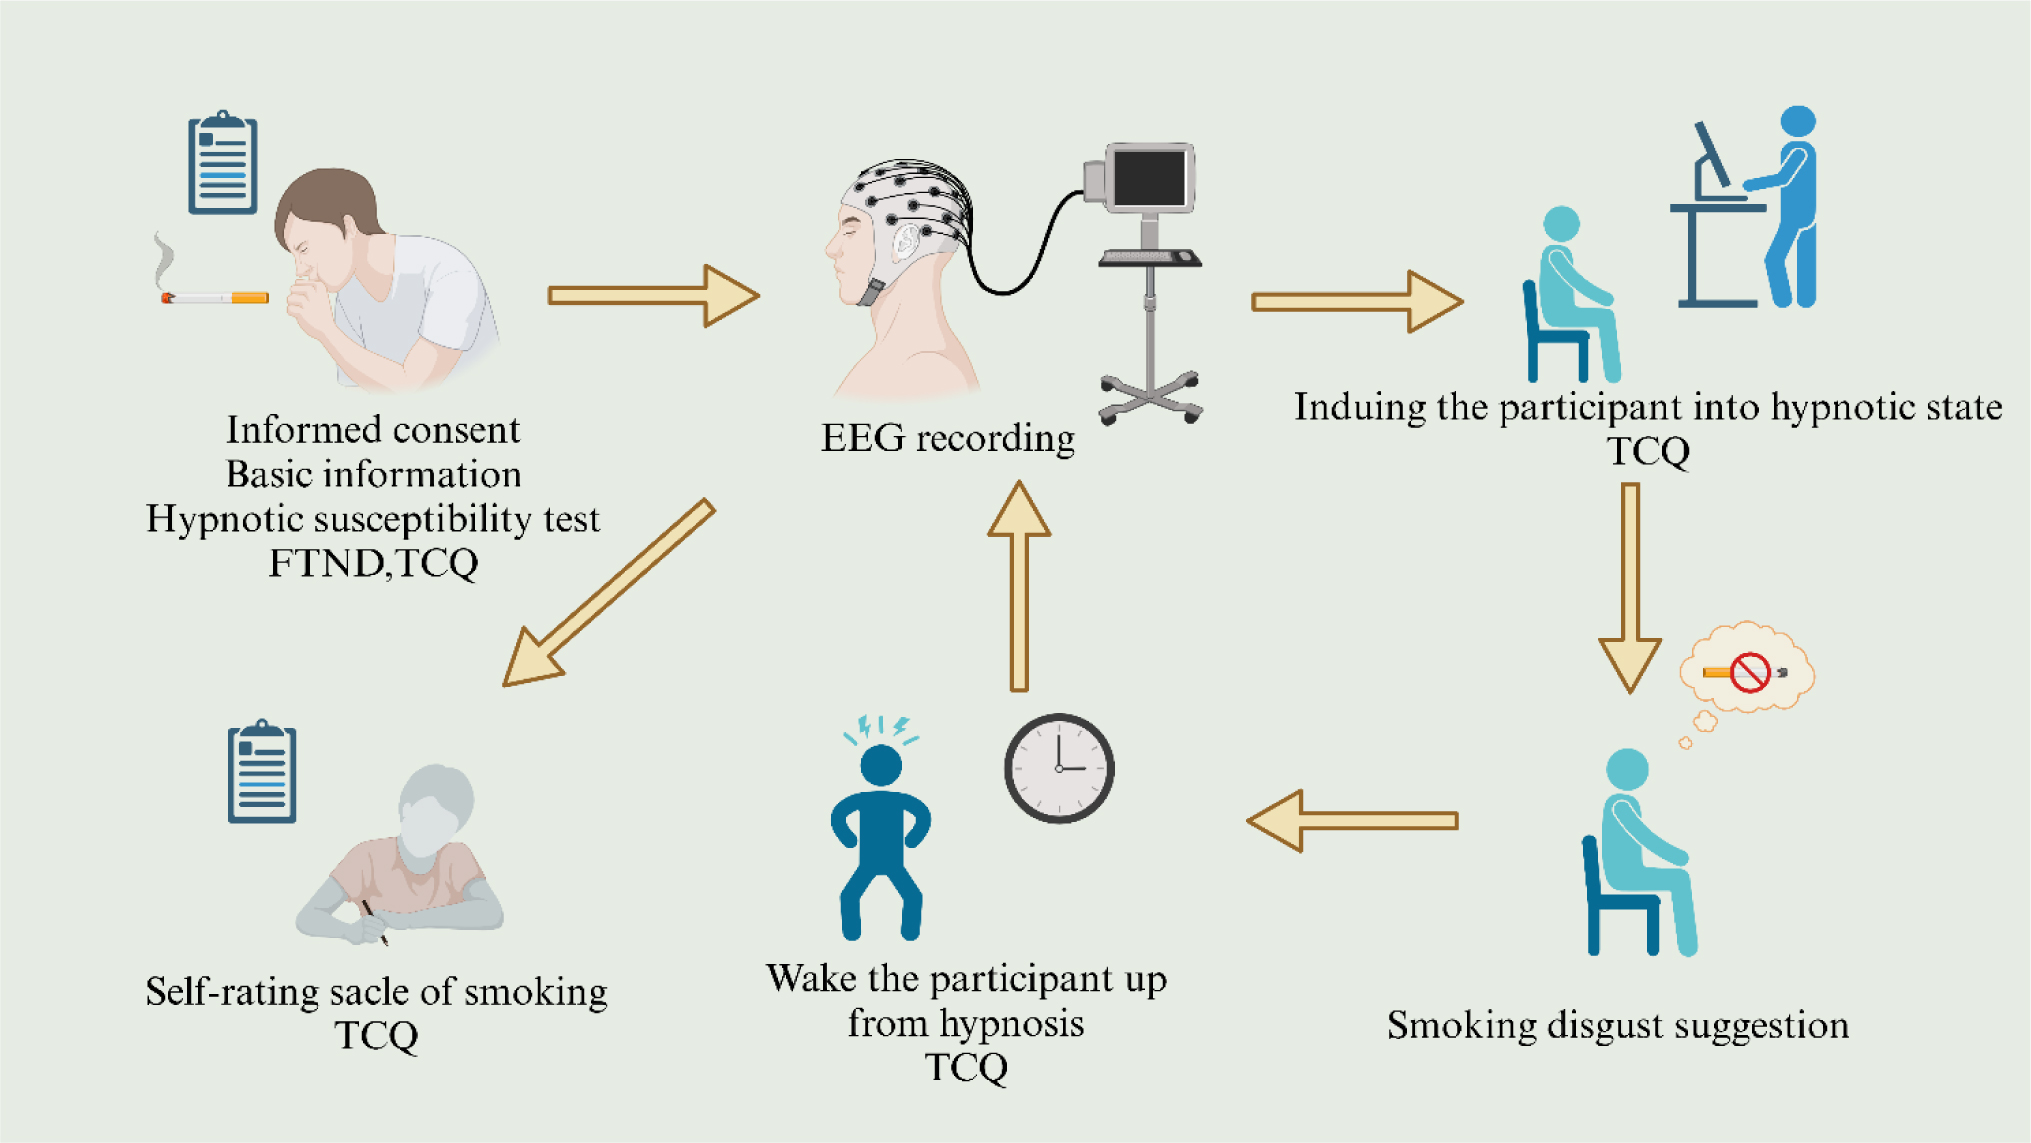
Despite hypnosis showing efficacy in treating nicotine dependence, its neurobiological impacts on a smokers' brain function remain underexplored. Thirty-three smokers underwent electroencephalography (EEG) recording during pre- and post-hypnosis sessions, each 8 minutes long, alongside Tobacco Craving Questionnaire (TCQ) assessments. Four distinct EEG microstate classes (A, B, C, D) were identified. Daily cigarette consumption negatively correlated with the microstate A duration (r = −0.39, P = 0.03). Hypnosis increased the microstate A parameters while decreasing those of microstate B. Reduced microstate B parameters positively correlated with lower TCQ scores (r = 0.46, P = 0.02). Post-hypnosis, there was a decreased variability and sample entropy in low-frequency theta-band signals, indicating a shift towards more ordered theta oscillations. This shift was inversely related to the microstate D parameters and positively correlated with the microstate C occurrences. Dynamic changes in the brain microstates and theta oscillations elucidate the neurological mechanisms underlying hypnotherapy's effectiveness in treating smoking addiction. These findings provide new insights into the mechanisms by which hypnosis influences brain function and offer potential biomarkers for the treatment of smoking addiction, thus deepening our understanding of therapeutic approaches for substance use disorders.

| [1] |
Danaei G, Vander Hoorn S, Lopez AD, et al. (2005) Causes of cancer in the world: comparative risk assessment of nine behavioural and environmental risk factors. Lancet 366: 1784-1793. https://dx.doi.org/10.1016/S0140-6736(05)67725-2 
|
| [2] |
Picciotto MR, Kenny PJ (2021) Mechanisms of Nicotine Addiction. Cold Spring Harb Perspect Med 11: a039610. https://dx.doi.org/10.1101/cshperspect.a039610
|
| [3] |
Harris KK, Zopey M, Friedman TC (2016) Metabolic effects of smoking cessation. Nat Rev Endocrinol 12: 684. https://dx.doi.org/10.1038/nrendo.2016.171
|
| [4] |
Betts JM, Dowd AN, Forney M, et al. (2021) A Meta-Analysis of Cue Reactivity in Tobacco Cigarette Smokers. Nicotine Tob Res 23: 249-258. https://dx.doi.org/10.1093/ntr/ntaa147
|
| [5] |
Kenford SL, Smith SS, Wetter DW, et al. (2002) Predicting relapse back to smoking: contrasting affective and physical models of dependence. J Consult Clin Psychol 70: 216-227. https://doi.org/10.1037/0022-006X.70.1.216
|
| [6] |
Hasan FM, Zagarins SE, Pischke KM, et al. (2014) Hypnotherapy is more effective than nicotine replacement therapy for smoking cessation: Results of a randomized controlled trial. Complement Ther Med 22: 1-8. https://dx.doi.org/10.1016/j.ctim.2013.12.012
|
| [7] |
Li XM, Chen LJ, Ma R, et al. (2020) The neural mechanisms of immediate and follow-up of the treatment effect of hypnosis on smoking craving. Brain Imaging Behav 14: 1487-1497. https://dx.doi.org/10.1007/s11682-019-00072-0
|
| [8] |
Elkins GR, Rajab MH (2004) Clinical hypnosis for smoking cessation: preliminary results of a three-session intervention. Int J Clin Exp Hypn 52: 73-81. https://dx.doi.org/10.1076/iceh.52.1.73.23921
|
| [9] |
Riegel B (2013) Hypnosis for smoking cessation: group and individual treatment-a free choice study. Int J Clin Exp Hypn 61: 146-161. https://dx.doi.org/10.1080/00207144.2013.753824
|
| [10] |
Spiegel D, Frischholz EJ, Fleiss JL, et al. (1993) Predictors of smoking abstinence following a single-session restructuring intervention with self-hypnosis. Am J Psychiatry 150: 1090-1097. https://dx.doi.org/10.1176/ajp.150.7.1090
|
| [11] |
Etter JF, Perneger TV (2001) Attitudes toward nicotine replacement therapy in smokers and ex-smokers in the general public. Clin Pharmacol Ther 69: 175-183. https://dx.doi.org/10.1067/mcp.2001.113722
|
| [12] |
Kihlstrom JF (2013) Neuro-hypnotism: prospects for hypnosis and neuroscience. Cortex 49: 365-374. https://dx.doi.org/10.1016/j.cortex.2012.05.016
|
| [13] |
Oakley DA, Halligan PW (2013) Hypnotic suggestion: opportunities for cognitive neuroscience. Nat Rev Neurosci 14: 565-576. https://dx.doi.org/10.1038/nrn3538
|
| [14] |
Thatcher RW (2012) Coherence, phase differences, phase shift, and phase lock in EEG/ERP analyses. Dev Neuropsychol 37: 476-496. https://dx.doi.org/10.1016/j.neuroimage.2010.02.009
|
| [15] |
Bréchet L, Brunet D, Birot G, et al. (2019) Capturing the spatiotemporal dynamics of self-generated, task-initiated thoughts with EEG and fMRI. Neuroimage 194: 82-92. https://dx.doi.org/10.1016/j.neuroimage.2019.03.029
|
| [16] |
Kaiser RH, Andrews-Hanna JR, Wager TD, et al. (2015) Large-Scale Network Dysfunction in Major Depressive Disorder A Meta-analysis of Resting-State Functional Connectivity. JAMA Psychiatry 72: 603-611. https://dx.doi.org/10.1001/jamapsychiatry.2015.0071
|
| [17] |
Milz P, Pascual-Marqui RD, Achermann P, et al. (2017) The EEG microstate topography is predominantly determined by intracortical sources in the alpha band. Neuroimage 162: 353-361. https://dx.doi.org/10.1016/j.neuroimage.2017.08.058
|
| [18] |
Chu CG, Wang X, Cai LH, et al. (2020) Spatiotemporal EEG microstate analysis in drug-free patients with Parkinson's disease. Neuroimage Clin 25: 102132. https://dx.doi.org/ARTN102132
|
| [19] |
Koenig T, Prichep L, Lehmann D, et al. (2002) Millisecond by millisecond, year by year: normative EEG microstates and developmental stages. Neuroimage 16: 41-48. https://dx.doi.org/10.1006/nimg.2002.1070
|
| [20] |
Andreou C, Faber PL, Leicht G, et al. (2014) Resting-state connectivity in the prodromal phase of schizophrenia: insights from EEG microstates. Schizophr Res 152: 513-520. https://dx.doi.org/10.1016/j.schres.2013.12.008
|
| [21] |
Van de Ville D, Britz J, Michel CM (2010) EEG microstate sequences in healthy humans at rest reveal scale-free dynamics. Proc Natl Acad Sci U S A 107: 18179-18184. https://dx.doi.org/10.1073/pnas.1007841107
|
| [22] |
Vellante F, Ferri F, Baroni G, et al. (2020) Euthymic bipolar disorder patients and EEG microstates: a neural signature of their abnormal self experience?. J Affect Disorders 272: 326-334. https://dx.doi.org/10.1016/j.jad.2020.03.175
|
| [23] |
Britz J, Van De Ville D, Michel CM (2010) BOLD correlates of EEG topography reveal rapid resting-state network dynamics. Neuroimage 52: 1162-1170. https://dx.doi.org/10.1016/j.neuroimage.2010.02.052
|
| [24] |
Khanna A, Pascual-Leone A, Michel CM, et al. (2015) Microstates in resting-state EEG: Current status and future directions. Neurosci Biobehav R 49: 105-113. https://dx.doi.org/10.1016/j.neubiorev.2014.12.010
|
| [25] |
Li X, Dong F, Zhang Y, et al. (2022) Altered resting-state electroencephalography microstate characteristics in young male smokers. Front Psychiatry 13: 1008007. https://dx.doi.org/10.3389/fpsyt.2022.1008007
|
| [26] |
Bochet A, Sperdin HF, Rihs TA, et al. (2021) Early alterations of large-scale brain networks temporal dynamics in young children with autism. Commun Biol 4: 968. https://dx.doi.org/10.1038/s42003-021-02494-3
|
| [27] |
Baradits M, Bitter I, Czobor P (2020) Multivariate patterns of EEG microstate parameters and their role in the discrimination of patients with schizophrenia from healthy controls. Psychiatry Res 288: 112938. https://dx.doi.org/10.1016/j.psychres.2020.112938
|
| [28] |
Qi Y, Liu Y, Yan Z, et al. (2023) Spontaneous brain microstates correlate with impaired inhibitory control in internet addiction disorder. Psychiatry Res Neuroimaging 334: 111686. https://dx.doi.org/10.1016/j.pscychresns.2023.111686
|
| [29] |
Gan H, Bu J, Zeng GQ, et al. (2023) Correlation between abnormal brain network activity and electroencephalogram microstates on exposure to smoking-related cues. BJPsych Open 9: e31. https://dx.doi.org/10.1192/bjo.2022.641
|
| [30] |
Akar SA, Kara S, Latifoğlu F, et al. (2016) Analysis of the Complexity Measures in the EEG of Schizophrenia Patients. Int J Neural Syst 26: 1650008. https://dx.doi.org/10.1142/s0129065716500088
|
| [31] |
Bosl W, Tierney A, Tager-Flusberg H, et al. (2011) EEG complexity as a biomarker for autism spectrum disorder risk. BMC Med 9: 18. https://dx.doi.org/10.1186/1741-7015-9-18
|
| [32] |
de la Cruz DM, Mañas S, Pereda E, et al. (2007) Maturational changes in the interdependencies between cortical brain areas of neonates during sleep. Cereb Cortex 17: 583-590. https://dx.doi.org/10.1093/cercor/bhk002
|
| [33] |
Richman JS, Moorman JR (2000) Physiological time-series analysis using approximate entropy and sample entropy. Am J Physiol Heart Circ Physiol 278: H2039-49. https://dx.doi.org/10.1152/ajpheart.2000.278.6.H2039
|
| [34] |
Schartner MM, Pigorini A, Gibbs SA, et al. (2017) Global and local complexity of intracranial EEG decreases during NREM sleep. Neurosci Conscious 2017: niw022. https://dx.doi.org/10.1093/nc/niw022
|
| [35] |
Martínez Vivot R, Pallavicini C, Zamberlan F, et al. (2020) Meditation Increases the Entropy of Brain Oscillatory Activity. Neuroscience 431: 40-51. https://dx.doi.org/10.1016/j.neuroscience.2020.01.033
|
| [36] |
Li X, Ma R, Pang L, et al. (2017) Delta coherence in resting-state EEG predicts the reduction in cigarette craving after hypnotic aversion suggestions. Sci Rep 7: 2430. https://dx.doi.org/10.1038/s41598-017-01373-4
|
| [37] |
Li X, Chen L, Ma R, et al. (2019) The top-down regulation from the prefrontal cortex to insula via hypnotic aversion suggestions reduces smoking craving. Hum Brain Mapp 40: 1718-1728. https://dx.doi.org/10.1002/hbm.24483
|
| [38] |
Heatherton TF, Kozlowski LT, Frecker RC, et al. (1991) The Fagerström Test for Nicotine Dependence: a revision of the Fagerström Tolerance Questionnaire. Br J Addict 86: 1119-1127. https://dx.doi.org/10.1111/j.1360-0443.1991.tb01879.x
|
| [39] |
Heishman SJ, Singleton EG, Pickworth WB (2008) Reliability and validity of a Short Form of the Tobacco Craving Questionnaire. Nicotine Tob Res 10: 643-651. https://dx.doi.org/10.1080/14622200801908174
|
| [40] | Zofnass JSJP (2006) Trance and Treatment: Clinical Uses of Hypnosis, Second Edition. Psychosomatics . American Psychiatric Publishing 281-282. https://doi.org/10.1176/appi.psy.46.3.281 |
| [41] |
Delorme A, Makeig S (2004) EEGLAB: an open source toolbox for analysis of single-trial EEG dynamics including independent component analysis. J Neurosci Methods 134: 9-21. https://dx.doi.org/10.1016/j.jneumeth.2003.10.009
|
| [42] |
Lehmann D, Ozaki H, Pal I (1987) EEG alpha map series: brain micro-states by space-oriented adaptive segmentation. Electroencephalogr Clin Neurophysiol 67: 271-288. https://dx.doi.org/10.1016/0013-4694(87)90025-3
|
| [43] |
Takahashi T, Cho RY, Mizuno T, et al. (2010) Antipsychotics reverse abnormal EEG complexity in drug-naive schizophrenia: a multiscale entropy analysis. Neuroimage 51: 173-182. https://dx.doi.org/10.1016/j.neuroimage.2010.02.009
|
| [44] |
Olesen SS, Gram M, Jackson CD, et al. (2016) Electroencephalogram variability in patients with cirrhosis associates with the presence and severity of hepatic encephalopathy. J Hepatol 65: 517-523. https://dx.doi.org/10.1016/j.jhep.2016.05.004
|
| [45] |
Koenig T, Lehmann D, Merlo MC, et al. (1999) A deviant EEG brain microstate in acute, neuroleptic-naive schizophrenics at rest. Eur Arch Psychiatry Clin Neurosci 249: 205-211. https://dx.doi.org/10.1007/s004060050088
|
| [46] |
Michel CM, Koenig T (2018) EEG microstates as a tool for studying the temporal dynamics of whole-brain neuronal networks: A review. Neuroimage 180: 577-593. https://dx.doi.org/10.1016/j.neuroimage.2017.11.062
|
| [47] |
Bi Y, Yuan K, Guan Y, et al. (2017) Altered resting state functional connectivity of anterior insula in young smokers. Brain Imaging Behav 11: 155-165. https://dx.doi.org/10.1007/s11682-016-9511-z
|
| [48] |
Fedota JR, Stein EA (2015) Resting-state functional connectivity and nicotine addiction: prospects for biomarker development. Ann N Y Acad Sci 1349: 64-82. https://dx.doi.org/10.1111/nyas.12882
|
| [49] |
Lin F, Wu G, Zhu L, et al. (2015) Altered brain functional networks in heavy smokers. Addict Biol 20: 809-819. https://dx.doi.org/10.1111/adb.12155
|
| [50] |
Janes AC, Betts J, Jensen JE, et al. (2016) Dorsal anterior cingulate glutamate is associated with engagement of the default mode network during exposure to smoking cues. Drug Alcohol Depend 167: 75-81. https://dx.doi.org/10.1016/j.drugalcdep.2016.07.021
|
| [51] |
Hanlon CA, Dowdle LT, Naselaris T, et al. (2014) Visual cortex activation to drug cues: a meta-analysis of functional neuroimaging papers in addiction and substance abuse literature. Drug Alcohol Depend 143: 206-212. https://dx.doi.org/10.1016/j.drugalcdep.2014.07.028
|
| [52] |
Marks KR, Roberts W, Stoops WW, et al. (2014) Fixation time is a sensitive measure of cocaine cue attentional bias. Addiction 109: 1501-8. https://dx.doi.org/10.1111/add.12635
|
| [53] |
Miller MA, Fillmore MT (2010) The effect of image complexity on attentional bias towards alcohol-related images in adult drinkers. Addiction 105: 883-890. https://dx.doi.org/10.1111/j.1360-0443.2009.02860.x
|
| [54] |
Tarailis P, Koenig T, Michel CM, et al. (2024) The Functional Aspects of Resting EEG Microstates: A Systematic Review. Brain Topogr 37: 181-217. https://dx.doi.org/10.1007/s10548-023-00958-9
|
| [55] |
Su X, Li L, Griffiths SM, et al. (2015) Smoking behaviors and intentions among adolescents in rural China: the application of the Theory of Planned Behavior and the role of social influence. Addict Behav 48: 44-51. https://dx.doi.org/10.1016/j.addbeh.2015.04.005
|
 neurosci-12-01-002-s001.pdf neurosci-12-01-002-s001.pdf |
 |


Figures(5) / Tables(2)

Mi Zhang, Junjie Ren, Ni Li, Yongyi Li, Linxi Yang, Wenzhuo Wei, Juan Qiu, Xiaochu Zhang, Xiaoming Li. Hypnosis efficacy on nicotine addiction: An analysis of EEG microstates and brain oscillation entropy[J]. AIMS Neuroscience, 2025, 12(1): 15-31. doi: 10.3934/Neuroscience.2025002


 DownLoad: