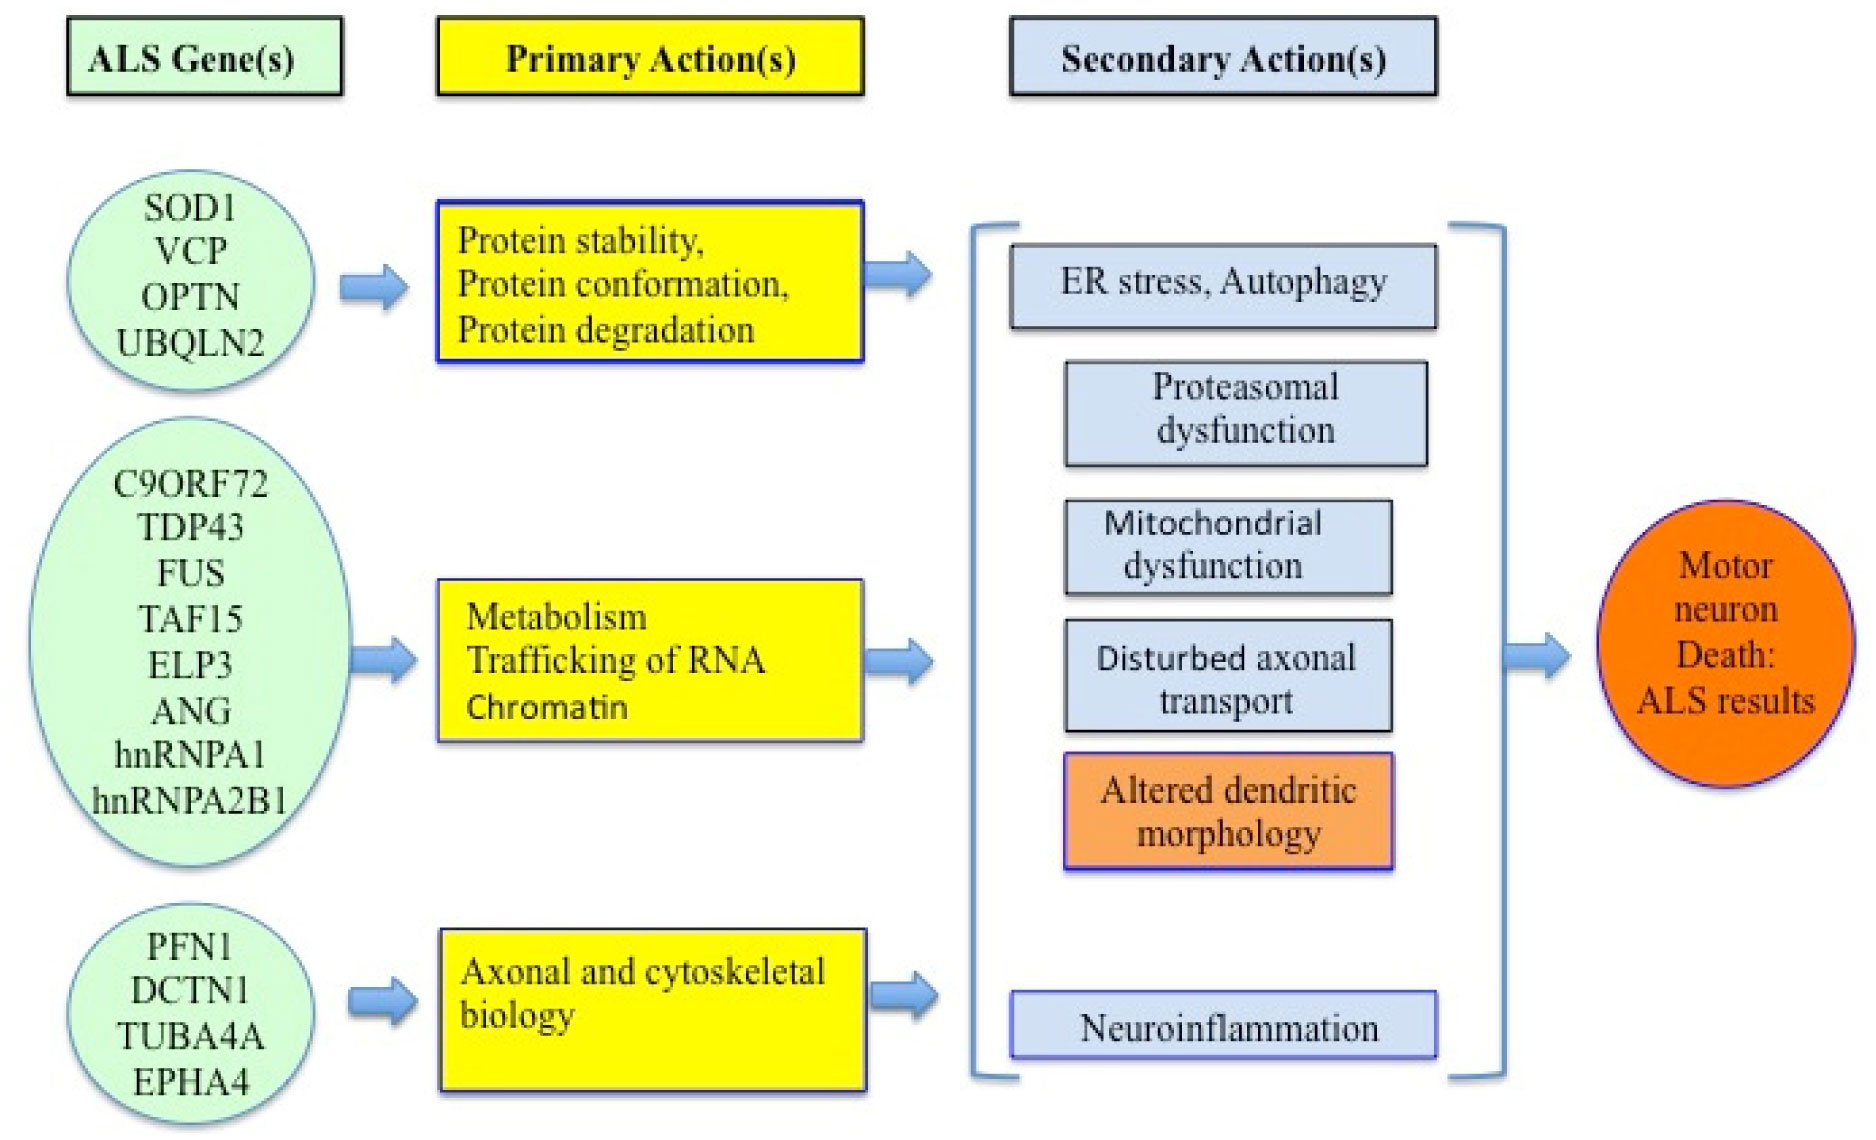
Amyotrophic lateral sclerosis (ALS) is a fatal neurodegenerative disease in adults involving non-demyelinating motor disorders. About 90% of ALS cases are sporadic, while 10–12% of cases are due to some genetic reasons. Mutations in superoxide dismutase 1 (SOD1), TAR, c9orf72 (chromosome 9 open reading frame 72) and VAPB genes are commonly found in ALS patients. Therefore, the mechanism of ALS development involves oxidative stress, endoplasmic reticulum stress, glutamate excitotoxicity and aggregation of proteins, neuro-inflammation and defective RNA function. Cholesterol and LDL/HDL levels are also associated with ALS development. As a result, sterols could be a suitable biomarker for this ailment. The main mechanisms of ALS development are reticulum stress, neuroinflammation and RNA metabolism. The multi-nature development of ALS makes it more challenging to pinpoint a treatment.
Citation: Ashok Chakraborty, Anil Diwan. Biomarkers and molecular mechanisms of Amyotrophic Lateral Sclerosis[J]. AIMS Neuroscience, 2022, 9(4): 423-443. doi: 10.3934/Neuroscience.2022023
Amyotrophic lateral sclerosis (ALS) is a fatal neurodegenerative disease in adults involving non-demyelinating motor disorders. About 90% of ALS cases are sporadic, while 10–12% of cases are due to some genetic reasons. Mutations in superoxide dismutase 1 (SOD1), TAR, c9orf72 (chromosome 9 open reading frame 72) and VAPB genes are commonly found in ALS patients. Therefore, the mechanism of ALS development involves oxidative stress, endoplasmic reticulum stress, glutamate excitotoxicity and aggregation of proteins, neuro-inflammation and defective RNA function. Cholesterol and LDL/HDL levels are also associated with ALS development. As a result, sterols could be a suitable biomarker for this ailment. The main mechanisms of ALS development are reticulum stress, neuroinflammation and RNA metabolism. The multi-nature development of ALS makes it more challenging to pinpoint a treatment.
Alzheimer's Disease
ATXN2 Gene-Product
Amyotrophic Lateral Sclerosis
Hereditary spastic paralysis
α-amino-3-hydroxy-5-methyl-4-isoxazolepropionic acid
Low Density Lipoprotein
Ataxia with Oculomotor Apraxia Type 2
Metalloproteinase-2
Familial ALS
Metalloproteinase-9
Sporadic ALS
Neurofilament Light Chain
Apolipoprotein E
α-Amino-3-Hydroxy-5-Methyl-4-Isoxazole-propionic Acid
ATXN2 Gene-Product
Parkinson's Disease
C-C Chemokine Receptor Type 2
Phosphorylated Neurofilament Heavy Chain
Chromosome 9 Open Reading Frame 72
Optineurin
Charcot-Marie-Tooth disease type 4
CD134 (TNFRSF4)
C-Reactive Protein
Primary lateral sclerosis
Cerebrospinal Fluid
RNA-binding protein
Frontotemporal Dementia
Ribonucleic acid
Enzyme-Linked Immunosorbent Assay
Reactive Oxygen Species
Extracellular Matrix Metalloproteinase Inducer
Spinocerebellar Ataxia, Autosomal Recessive 1
U.S. Food and Drug Administration
Spinal muscular atrophy
FIG4 Phosphoinositide 5-Phosphatase
Superoxide Dismutase 1
Frontotemporal disorder
TAR DNA-Binding Protein 43
Frontotemporal lobar degeneration
TAR DNA Binding Protein
Fused in Sarcoma
Tumor Necrosis Factor-
Granulocyte Macrophage Colony Stimulating Factor
Vesicle-associated Membrane Protein-associated Protein B
High-density lipoprotein
Valosin Containing Protein
High Density Lipoprotein
Wiskott–Aldrich syndrome protein
Apolipoprotein E
Wide Range C-Reactive Protein

| [1] |
Kumar DR, Aslinia F, Yale SH, et al. (2011) Jean-Martin Charcot: the father of neurology. Clin Med Res 9: 46-49. https://doi.org/10.3121/cmr.2009.883 
|
| [2] |
Swinnen B, Robberecht W (2014) The phenotypic variability of amyotrophic lateral sclerosis. Nat Rev Neurol 10: 661-670. https://doi.org/10.1038/nrneurol.2014.184
|
| [3] | Kaufman David Myland (2007) Peripheral Nerve Disorders. In, Clinical Neurology for Psychiatrists Pages 61-85. ISBN 9781416030744, https://doi.org/10.1016/B978-1-4160-3074-4.10005-0 |
| [4] |
Mathis S, Goizet C, Soulages A, et al. (2019) Genetics of amyotrophic lateral sclerosis: a review. J Neurol Sci 399: 217-226. https://doi.org/10.1016/j.jns.2019.02.030
|
| [5] |
Cook C, Petrucelli L (2019) Genetic convergence brings clarity to the enigmatic red line in ALS. Neuron 101: 1057-1069. https://doi.org/10.1016/j.neuron.2019.02.032
|
| [6] | Bozzoni V, Pansarasa O, Diamanti L, et al. (2016) Amyotrophic lateral sclerosis and environmental factors. Funct Neurol 31: 7-19. https://doi.org/10.11138/FNeur/2016.31.1.007 |
| [7] |
Malek AM, Barchowsky A, Bowser R, et al. (2015) Exposure to hazardous air pollutants and the risk of amyotrophic lateral sclerosis. Environ Pollut 197: 181-6. https://doi.org/10.1016/j.envpol.2014.12.010
|
| [8] | Wang MD, Little J, Gomes J, et al. (2016) Identification of risk factors associated with onset and progression of amyotrophic lateral sclerosis using systematic review and meta-analysis. Neurotoxicology pii: S0161-813X(16)30116-4. https://doi.org/10.1016/j.neuro.2016.06.015 |
| [9] | Appel SH, Zhao W, Beers DR, et al. (2011) The microglial-motoneuron dialogue in ALS. Acta Myol 30: 4-8. |
| [10] |
Pasinelli P, Brown RH (2006) Molecular biology of amyotrophic lateral sclerosis: insights from genetics. Nat Rev Neurosci 7: 710-723. https://doi.org/10.1038/nrn1971
|
| [11] |
Czaplinski A, Yen AA, Simpson EP, et al. (2006) Slower disease progression and prolonged survival in contemporary patients with amyotrophic lateral sclerosis: is the natural history of amyotrophic lateral sclerosis changing?. Arch Neurol 63: 1139-1143. https://doi.org/10.1001/archneur.63.8.1139
|
| [12] |
Ueno H, Kobatake K, Matsumoto M, et al. (2011) Severe brain atrophy after long-term survival seen in siblings with familial amyotrophic lateral sclerosis and a mutation in the optineurin gene: a case series. J Med Case Re 5: 573. https://doi.org/10.1186/1752-1947-5-573
|
| [13] |
Benatar M, Boylan K, Jeromin A, et al. (2016) ALS biomarkers for therapy development: state of the field and future directions. Muscle Nerve 53: 169-182. https://doi.org/10.1002/mus.24979
|
| [14] |
Poesen K, Van Damme P (2019) Diagnostic and prognostic performance of neurofilaments in ALS. Front Neurol 9: 1167. https://doi.org/10.3389/fneur.2018.01167
|
| [15] |
Zetterberg H, Jacobsson J, Rosengren L, et al. (2007) Cerebrospinal fluid neurofilament light levels in amyotrophic lateral sclerosis: impact of SOD1 genotype. Eur J Neurol 14: 1329-1333. https://doi.org/10.1111/j.1468-1331.2007.01972.x
|
| [16] |
Gendron TF, Daughrity LM, Heckman MG, et al. (2017) Phosphorylated neurofilament heavy chain: a biomarker of survival for C9ORF72-associated amyotrophic lateral sclerosis. Ann Neurol 82: 139-146. https://doi.org/10.1002/ana.24980
|
| [17] |
Lu CH, Macdonald-Wallis C, Gray E, et al. (2015) Neurofilament light chain: a prognostic biomarker in amyotrophic lateral sclerosis. Neurology 84: 2247-2257. https://doi.org/10.1212/WNL.0000000000001642
|
| [18] |
Vu LT, Bowser R (2017) Fluid-based biomarkers for amyotrophic lateral sclerosis. Neurotherapeutics 14: 119-134. https://doi.org/10.1007/s13311-016-0503-x
|
| [19] |
Fortea J, Carmona-Iragui M, Benejam B, et al. (2018) Plasma and CSF biomarkers for the diagnosis of Alzheimer's disease in adults with Down syndrome: a cross-sectional study. Lancet Neurol 17: 860-869. https://doi.org/10.1016/S1474-4422(18)30285-0
|
| [20] |
Bowser R, Turner MR, Shefner J (2011) Biomarkers in amyotrophic lateral sclerosis: opportunities and limitations. Nat Rev Neurol 7: 631-638. https://doi.org/10.1038/nrneurol.2011.151
|
| [21] |
Benatar M, Wuu J, Lombardi V, et al. (2019) Neurofilaments in pre-symptomatic ALS and the impact of genotype. Amyotroph Lateral Scler Frontotemporal Degener 20: 538-548. https://doi.org/10.1080/21678421.2019.1646769
|
| [22] |
Chen X, Chen Y, Wei Q, et al. (2016) Assessment of a multiple biomarker panel for diagnosis of amyotrophic lateral sclerosis. BMC Neurol 16: 173. https://doi.org/10.1186/s12883-016-0689-x
|
| [23] |
Zhou YN, Chen YH, Dong SQ, et al. (2021) Role of Blood Neurofilaments in the Prognosis of Amyotrophic Lateral Sclerosis: A Meta-Analysis. Front Neurol 12: 712245. https://doi.org/10.3389/fneur.2021.712245
|
| [24] | Steinacker P, Feneberg E, Weishaupt J, et al. (2016) Neurofilaments in the diagnosis of motoneuron diseases: a prospective study on 455 patients. J Neurol Neurosurg Psychiatry 87: 12-20. https://doi.org/10.1136/jnnp-2015-311387 |
| [25] |
Chipika RH, Finegan E, Li Hi Shing S, et al. (2019) Tracking a fast-moving disease: longitudinal markers, monitoring, and clinical trial endpoints in ALS. Front Neurol 10: 229. https://doi.org/10.3389/fneur.2019.00229
|
| [26] |
Jara JH, Gautam M, Kocak N, et al. (2019) MCP1-CCR2 and neuroinflammation in the ALS motor cortex with TDP-43 pathology. J Neuroinflammation 16: 196. https://doi.org/10.1186/s12974-019-1589-y
|
| [27] |
Lu CH, Allen K, Oei F, et al. (2016) Systemic inflammatory response and neuromuscular involvement in amyotrophic lateral sclerosis. Neurol Neuroimmunol Neuroinflamm 3: e244. https://doi.org/10.1212/NXI.0000000000000244
|
| [28] |
Lunetta C, Lizio A, Maestri E, et al. (2017) Serum C-reactive protein as a prognostic biomarker in amyotrophic lateral sclerosis. JAMA Neurol 74: 660-667. https://doi.org/10.1001/jamaneurol.2016.6179
|
| [29] | Beuche W, Yushchenko M, Mäder M, et al. (2000) Matrix metalloproteinase-9 is elevated in serum of patients with amyotrophic lateral sclerosis. Neuro Rep 11: 3419-3422. https://doi.org/10.1097/00001756-200011090-00003 |
| [30] |
Ilzecka J (2001) EMMPRIN levels in serum of patients with amyotrophic lateral sclerosis. Acta Neurol Scand 124: 424-428. https://doi.org/10.1111/j.1600-0404.2011.01519.x
|
| [31] |
Simpson EP, Henry YK, Henkel JS, et al. (2004) Increased lipid peroxidation in sera of ALS patients: a potential biomarker of disease burden. Neurology 62: 1758-1765. https://doi.org/10.1212/WNL.62.10.1758
|
| [32] |
Babu GN, Kumar A, Chandra R, et al. (2008) Elevated inflammatory markers in a group of amyotrophic lateral sclerosis patients from northern India. Neurochem Res 33: 1145-1149. https://doi.org/10.1007/s11064-007-9564-x
|
| [33] |
Kharel S, Ojha R, Preethish-Kumar V, et al. (2022) C-reactive protein levels in patients with amyotrophic lateral sclerosis: A systematic review. Brain Behav 12: e2532. https://doi.org/10.1002/brb3.2532
|
| [34] |
Zhang R, Gascon R, Miller RG, et al. (2006) MCP-1 chemokine receptor CCR2 is decreased on circulating monocytes in sporadic amyotrophic lateral sclerosis (sALS). J Neuroimmunol 179: 87-93. https://doi.org/10.1016/j.jneuroim.2006.06.008
|
| [35] | Liu GT, Hwang CS, Hsieh CH, et al. (2013) Eosinophil-derived neurotoxin is elevated in patients with amyotrophic lateral sclerosis. Mediat Inflamm 2013: 421389. https://doi.org/10.1155/2013/421389 |
| [36] |
Kuhle J, Lindberg RLP, Regeniter A, et al. (2009) Increased levels of inflammatory chemokines in amyotrophic lateral sclerosis. Eur J Neurol 16: 771-774. https://doi.org/10.1111/j.1468-1331.2009.02560.x
|
| [37] |
Ilzecka J (2011) Granzymes A and B levels in serum of patients with amyotrophic lateral sclerosis. Clin Biochem 44: 650-653. https://doi.org/10.1016/j.clinbiochem.2011.02.006
|
| [38] |
Hwang CS, Liu GT, Chang MD, et al. (2013) Elevated serum autoantibody against high mobility group box 1 as a potent surrogate biomarker for amyotrophic lateral sclerosis. Neurobiol Dis 58: 13-18. https://doi.org/10.1016/j.nbd.2013.04.013
|
| [39] |
Moreau C, Devos D, Brunaud-Danel V, et al. (2005) Elevated IL-6 and TNF-α levels in patients with ALS: inflammation or hypoxia?. Neurology 65: 1958-1960. https://doi.org/10.1212/01.wnl.0000188907.97339.76
|
| [40] |
Baron P, Bussini S, Cardin V, et al. (2005) Production of monocyte chemoattractant protein-1 in amyotrophic lateral sclerosis. Muscle Nerve 32: 541-544. https://doi.org/10.1002/mus.20376
|
| [41] |
Zhu Y, Li M, Zhang J, et al. (2022) Association Between CReactive Protein and Risk of Amyotrophic Lateral Sclerosis: A Mendelian Randomization Study. Front Genet 13: 919031. https://doi.org/10.3389/fgene.2022.919031
|
| [42] |
Cereda C, Baiocchi C, Bongioanni P, et al. (2008) TNF and sTNFR1/2 plasma levels in ALS patients. J Neuroimmunol 194: 123-131. https://doi.org/10.1016/j.jneuroim.2007.10.028
|
| [43] |
Dupuis L, Pradat PF, Ludolph AC, et al. (2011) Energy metabolism in amyotrophic lateral sclerosis. Lancet Neurol 10: 75-82. https://doi.org/10.1016/S1474-4422(10)70224-6
|
| [44] | Sokolowska B, Jozwik A, Niebroj-Dobosz I, et al. (2009) Evaluation of matrix metalloproteinases in serum of patients with amyotrophic lateral sclerosis with pattern recognition methods. J Physiol Pharmacol 60: 117-120. |
| [45] |
Gao J, Wang D, Liu D, et al. (2015) Tumor necrosis factor-related apoptosis-inducing ligand induces the expression of proinflammatory cytokines in macrophages and re-educates tumor-associated macrophages to an antitumor phenotype. Mol Biol Cell 26: 3178-89. https://doi.org/10.1091/mbc.e15-04-0209
|
| [46] | Iłzecka J (2012) Serum soluble OX40 in patients with amyotrophic lateral sclerosis. Acta Clin Croat 51: 3-7. |
| [47] |
Iłzecka J (2009) Serum-soluble receptor for advanced glycation end product levels in patients with amyotrophic lateral sclerosis. Acta Neurol Scand 120: 119-122. https://doi.org/10.1111/j.1600-0404.2008.01133.x
|
| [48] |
Iłzecka J (2008) Decreased serum-soluble TRAIL levels in patients with amyotrophic lateral sclerosis. Acta Neurol Scand 117: 343-346. https://doi.org/10.1111/j.1600-0404.2007.00947.x
|
| [49] |
Dupuis L, Corcia P, Ferganietal A (2008) Dyslipidemiaisaprotective factor in amyotrophic lateral sclerosis. Neurology 70: 1004-1009. https://doi.org/10.1212/01.wnl.0000285080.70324.27
|
| [50] | Ilzecka J, Stelmasiak Z, Dobosz B (2001) Interleukin-1β converting enzyme/Caspase-1 (ICE/Caspase-1) and soluble APO-1/Fas/CD 95 receptor in amyotrophic lateral sclerosis patients. Acta Neurol Scand 103: 255-258. https://doi.org/10.1034/j.1600-0404.2001.103004255.x |
| [51] |
Iłzecka J (2012) Serum caspase-9 levels are increased in patients with amyotrophic lateral sclerosis. Neurol Sci 33: 825-829. https://doi.org/10.1007/s10072-011-0837-4
|
| [52] |
Staats KA, Borchelt DR, Tansey MG, et al. (2022) Blood-based biomarkers of inflammation in amyotrophic lateral sclerosis. Mol Neurodegener 17: 11. https://doi.org/10.1186/s13024-022-00515-1
|
| [53] |
Mitchell RM, Simmons Z, Beard JL, et al. (2010) Plasma biomarkers associated with ALS and their relationship to iron homeostasis. Muscle Nerve 42: 95-103. https://doi.org/10.1002/mus.21625
|
| [54] | Robelin L, De Aguilar JLG (2014) Blood Biomarkers for Amyotrophic Lateral Sclerosis: Myth or Reality?. BioMed Res Inter : Article ID 525097. https://doi.org/10.1155/2014/525097 |
| [55] |
Keizman D, Rogowski O, Berlineretal S (2009) Low-grade systemic inflammation in patients with amyotrophic lateral sclerosis. Acta Neurol Scand 119: 383-389. https://doi.org/10.1111/j.1600-0404.2008.01112.x
|
| [56] |
Lacomblez L, Doppler V, Beucler I, et al. (2002) APOE: a potential marker of disease progression in ALS. Neurology 58: 1112-1114. https://doi.org/10.1212/WNL.58.7.1112
|
| [57] |
Wilson ME, Boumaza I, Lacomis D, et al. (2010) Cystatin C: a candidate biomarker for amyotrophic lateral sclerosis. PLoS ONE 5: Article ID e15133. https://doi.org/10.1371/journal.pone.0015133
|
| [58] |
Fang F, Kwee LC, Allen KD, et al. (2010) Association between blood lead and the risk of amyotrophic lateral sclerosis. Am J Epidemiol 171: 1126-1133. https://doi.org/10.1093/aje/kwq063
|
| [59] |
Roos PM, Vesterberg O, Syversen T, et al. (2013) Metal concentrations in cerebrospinal fluid and blood plasma from patients with amyotrophic lateral sclerosis. Biol Trace Elem Res 151: 159-170. https://doi.org/10.1007/s12011-012-9547-x
|
| [60] |
Mantovani S, Garbelli S, Pasini A, et al. (2009) Immune system alterations in sporadic amyotrophic lateral sclerosis patients suggest an ongoing neuroinflammatory process. J Neuroimm 210: 73-79. https://doi.org/10.1016/j.jneuroim.2009.02.012
|
| [61] |
Simone IL, Ruggieri M, Tortelli R, et al. (2011) Serum N-acetylaspartate level in amyotrophic lateral sclerosis. Arch Neurol 68: 1308-1312. https://doi.org/10.1001/archneurol.2011.217
|
| [62] |
Gaiottino J, Norgren N, Dobson R, et al. (2013) Increased neurofilament light chain blood levels in neurodegenerative neurological diseases. PLoS ONE 8: Article ID e75091. https://doi.org/10.1371/journal.pone.0075091
|
| [63] |
Tortelli R, Ruggieri M, Cortese R, et al. (2012) Elevated cerebrospinal fluid neurofilament light levels in patients with amyotrophic lateral sclerosis: a possible marker of disease severity and progression. Eur J Neurol 19: 1561-1567. https://doi.org/10.1111/j.1468-1331.2012.03777.x
|
| [64] |
DeJesus-Hernandez M, Mackenzie IR, Boeve BF, et al. (2011) Expanded GGGGCC hexanucleotide repeat in noncoding region of C9ORF72 causes chromosome 9p-linked FTD and ALS. Neuron 72: 245-256. https://doi.org/10.1016/j.neuron.2011.09.011
|
| [65] |
Sreedharan J, Blair IP, Tripathietal VB (2008) TDP-43mutations in familial and sporadic amyotrophic lateral sclerosis. Science 319: 1668-1672. https://doi.org/10.1126/science.1154584
|
| [66] |
Verstraete E, Kuiperij HB, VanBlitterswijketal MM (2012) TDP-43 plasma levels are higher in amyotrophic lateral sclerosis. Amyotroph Lateral Sc 13: 446-451. https://doi.org/10.3109/17482968.2012.703208
|
| [67] |
Noto YI, Shibuya K, Satoetal Y (2011) Elevated CSFTDP-43 levels in amyotrophic lateral sclerosis: specificity, sensitivity, and a possible prognostic value. Amyotroph Lateral Sc 12: 140-143. https://doi.org/10.3109/17482968.2010.541263
|
| [68] |
Ganesalingam J, An J, Shaw CE, et al. (2011) Combination of neurofilament heavy chain and complement C3 as CSF biomarkers for ALS. J Neurochem 117: 528-537. https://doi.org/10.1111/j.1471-4159.2011.07224.x
|
| [69] |
Boylan KB, Glass JD, Crooketal JE (2013) Phosphorylated neurofilament heavy subunit (pNF-H) in peripheral blood and CSF as a potential prognostic biomarker in Amyotrophic Lateral Sclerosis. J Neurol Neurosur Ps 84: 467-472. https://doi.org/10.1136/jnnp-2012-303768
|
| [70] |
Belzil VV, Bauer PO, Prudencio M, et al. (2013) Reduced C9orf72 gene expression in c9FTD/ALS is caused by histone trimethylation, an epigenetic event detectable in blood. Acta Neuropathol 126: 895-905. https://doi.org/10.1007/s00401-013-1199-1
|
| [71] |
Rentzos M, Evangelopoulos E, Sereti E, et al. (2012) Alterations of T cell subsets in ALS: a systemic immune activation?. Acta Neurol Scand 125: 260-264. https://doi.org/10.1111/j.1600-0404.2011.01528.x
|
| [72] |
Brettschneider J, Petzold A, Süßmuth SD, et al. (2006) Axonal damage markers in cerebrospinal fluid are increased in ALS. Neurology 66: 852-856. https://doi.org/10.1212/01.wnl.0000203120.85850.54
|
| [73] | Ganesalingam J, An J, Bowser R, et al. (2013) PNfH is a promising biomarker for ALS. Amyotroph Lat Scl Fr 14: 146-149. https://doi.org/10.3109/21678421.2012.729596 |
| [74] |
Turner MR, Hardiman O, Benatar M, et al. (2013) Controversies and priorities in amyotrophic lateral sclerosis. Lancet Neurol 12: 310-322. https://doi.org/10.1016/S1474-4422(13)70036-X
|
| [75] |
Mitchell J, Paul P, Chen HJ, et al. (2010) Familial amyotrophic lateral sclerosis is associated with a mutation in D-amino acid oxidase. Proc Natl Acad Sci USA 107: 7556-7561. https://doi.org/10.1073/pnas.0914128107
|
| [76] |
Barker RF, Hopkinson DA (1977) The genetic and biochemical properties of the D-amino acid oxidases in human tissues. Ann Hum Genet 41: 27-42. https://doi.org/10.1111/j.1469-1809.1977.tb01959.x
|
| [77] |
Rosen DR, Siddique T, Patterson D, et al. (1993) Mutations in Cu/Zn superoxide dismutase gene are associated with familial amyotrophic lateral sclerosis. Nature 362: 59-62. https://doi.org/10.1038/364362c0
|
| [78] |
Deng HX, Hentati A, Tainer JA, et al. (1993) Amyotrophic lateral sclerosis and structural defects in Cu,Zn superoxide dismutase. Science 261: 1047-1051. https://doi.org/10.1126/science.8351519
|
| [79] |
Buratti E, Baralle FE (2001) Characterization and functional implications of the RNA binding properties of nuclear factor TDP-43, a novel splicing regulator of CFTR exon 9. J Biol Chem 276: 36337-36343. https://doi.org/10.1074/jbc
|
| [80] |
Wang HY, Wang IF, Bose J, et al. (2004) Structural diversity and functional implications of the eukaryotic TDP gene family. Genomics 83: 130-139. https://doi.org/10.1016/S0888-7543(03)00214-3
|
| [81] |
Neumann M, Sampathu DM, Kwong LK, et al. (2006) Ubiquitinated TDP-43 in frontotemporal lobar degeneration and amyotrophic lateral sclerosis. Science 314: 130-133. https://doi.org/10.1126/science.1134108
|
| [82] |
Zinszner H, Sok J, Immanuel D, et al. (1997) TLS (FUS) binds RNA in vivo and engages in nucleo-cytoplasmic shuttling. J Cell Sci 110: 1741-1750. https://doi.org/10.1242/jcs.110.15.1741
|
| [83] |
Ayala YM, Zago P, D'Ambrogio A, et al. (2008) Structural determinants of the cellular localization and shuttling of TDP-43. J Cell Sci 121: 3778-3785. https://doi.org/10.1242/jcs.038950
|
| [84] |
Fujii R, Takumi T (2005) TLS facilitates transport of mRNA encoding an actin-stabilizing protein to dendritic spines. J Cell Sci 118: 5755-5765. https://doi.org/10.1242/jcs.02692
|
| [85] |
Fujii R, Okabe S, Urushido T, et al. (2005) The RNA binding protein TLS is translocated to dendritic spines by mGluR5 activation and regulates spine morphology. Curr Biol 15: 587-593. https://doi.org/10.1016/j.cub.2005.01.058
|
| [86] |
van Blitterswijk M, DeJesus-Hernandez M, Rademakers R (2012) How do C9ORF72 repeat expansions cause amyotrophic lateral sclerosis and frontotemporal dementia. Curr Opin Neurol 25: 689-700. https://doi.org/10.1097/WCO.0b013e32835a3efb
|
| [87] |
Suzuki H, Kanekura K, Levine TP, et al. (2009) ALS-linked P56S-VAPB, an aggregated loss-of-function mutant of VAPB, predisposes motor neurons to ER stress-related death by inducing aggregation of co-expressed wild-type VAPB. J Neurochem 108: 973-985. https://doi.org/10.1111/j.1471-4159.2008.05857.x
|
| [88] |
Beckman JS, Crow JP (1993) Pathological implications of nitric oxide, superoxide and peroxynitrite formation. Biochem. Soc. Trans 21: 330-334. https://doi.org/10.1042/bst0210330
|
| [89] | ALS Association. https://www.als.org/research/research-we-fund/scientific-focus-areas/genetics. |
| [90] |
Ishikawa H, Yasui K, Oketa Y, et al. (2012) Increased expression of valosin-containing protein in the skin of patients with amyotrophic lateral sclerosis. J Clin Neurosci 19: 522-526. https://doi.org/10.1016/j.jocn.2011.05.044
|
| [91] |
Hadano S, Hand CK, Osuga H, et al. (2001) A gene encoding a putative GTPase regulator is mutated in familial amyotrophic lateral sclerosis 2. Nature Genet 29: 166-173. https://doi.org/10.1038/ng1001-166
|
| [92] |
Cai H, Shim H, Lai C, et al. (2008) ALS2/alsin knockout mice and motor neuron diseases. Neurodegener Dis 5: 359-366. https://doi.org/10.1159/000151295
|
| [93] |
Gros-Louis F, Kriz J, Kabashi E, et al. (2008) Als2 mRNA splicing variants detected in KO mice rescue severe motor dysfunction phenotype in Als2 knock-down zebrafish. Hum Mol Genet 17: 2691-2702. https://doi.org/10.1093/hmg/ddn171
|
| [94] |
Skourti-Stathaki K, Proudfoot NJ, Gromak N (2011) Human senataxin resolves RNA/DNA hybrids formed at transcriptional pause sites to promote Xrn2-dependenttermination. Mol Cell 42: 794-805. https://doi.org/10.1016/j.molcel.2011.04.026
|
| [95] |
Padhi AK, Kumar H, Vasaikar SV, et al. (2012) Mechanisms of loss of functions of human angiogenin variants implicated in amyotrophic lateral sclerosis. PLoS One 7: e32479. https://doi.org/10.1371/journal.pone.0032479
|
| [96] |
Maruyama H, Morino H, Ito H, et al. (2010) Mutations of optineurin in amyotrophic lateral sclerosis. Nature 465: 223-226. https://doi.org/10.1038/nature08971
|
| [97] |
Hentati A, Ouahchi K, Pericak-Vance MA, et al. (1998) Linkage of a commoner form of recessive amyotrophic lateral sclerosis to chromosome 15q15-q22 markers. Neurogenetics 2: 55-60. https://doi.org/10.1007/s100480050052
|
| [98] |
Stevanin G, Santorelli FM, Azzedine H, et al. (2007) Mutations in SPG11, encoding spatacsin, are a major cause of spastic paraplegia with thin corpus callosum. Nat Genet 39: 366-372. https://doi.org/10.1038/ng1980
|
| [99] |
Murmu RP, Martin E, Rastetter A, et al. (2011) Cellular distribution and subcellular localization of spatacsin and spastizin, two proteins involved in hereditary spastic paraplegia. Mol Cell Neurosci 47: 191-202. https://doi.org/10.1016/j.mcn.2011.04.004
|
| [100] |
Michell RH, Dove SK (2009) A protein complex that regulates PtdIns(3,5)P2 levels. EMBO J 28: 86-97. https://doi.org/10.1038/emboj.2008.270
|
| [101] |
Chow CY, Zhang Y, Dowling JJ, et al. (2007) Mutation of FIG 4 causes neurodegeneration in the pale tremor mouse and patients with CMT4J. Nature 448: 68-72. https://doi.org/10.1038/nature05876
|
| [102] |
Zhang Y, Zolov SN, Chow CY, et al. (2007) Loss of Vac14, a regulator of the signaling lipid phosphatidylinositol 3,5-biphosphate, results in neurodegeneration in mice. Proc Natl Acad Sci USA 104: 17518-17523. https://doi.org/10.1073/pnas.0702275104
|
| [103] |
Luty AA, Kwok JB, Dobson-Stone C, et al. (2010) Sigma nonopioid intracellular receptor 1 mutations cause frontotemporal lobar degeneration-motor neuron disease. Ann Neurol 68: 639-649. https://doi.org/10.1002/ana.22274
|
| [104] |
Al-Saif A, Al-Mohanna F, Bohlega S (2011) A mutation in sigma-1 receptor causes juvenile amyotrophic lateral sclerosis. Ann Neurol 70: 913-919. https://doi.org/10.1002/ana.22534
|
| [105] |
Morita M, Al-Chalabi A, Andersen PM, et al. (2006) A locus on chromosome 9p confers susceptibility to ALS and frontotemporal dementia. Neurology 66: 839-844. https://doi.org/10.1212/01.wnl.0000200048.53766.b4
|
| [106] |
Münch C, Sedlmeier R, Meyer T, et al. (2004) Point mutations of the p150 subunit of dynactin (DCTN1) gene in ALS. Neurology 63: 724-726. https://doi.org/10.1212/01.WNL.0000134608.83927.B1
|
| [107] |
Laird FM, Farah MH, Ackerley S, et al. (2008) Motor neuron disease occurring in a mutant dynactin mouse model is characterized by defects in vesicular trafficking. J Neurosci 28: 1997-2005. https://doi.org/10.1523/JNEUROSCI.4231-07.2008
|
| [108] |
Puls I, Jonnakuty C, LaMonte BH, et al. (2003) Mutant dynactin in motor neuron disease. Nat Genet 33: 455-456. https://doi.org/10.1038/ng1123
|
| [109] |
Vasko MR, Guo C, Thompson EL, et al. (2011) The repair function of the multifunctional DNA repair/redox protein APE1 is neuroprotective after ionizing radiation. DNA Repair (Amst) 10: 942-952. https://doi.org/10.1016/j.dnarep.2011.06.004
|
| [110] |
Belly A, Bodon G, Blot B, et al. (2010) CHMP2B mutants linked to frontotemporal dementia impair maturation of dendritic spines. J Cell Sci 123: 2943-2954. https://doi.org/10.1242/jcs.068817
|
| [111] |
Ghazi-Noori S, Froud KE, Mizielinska S, et al. (2012) Progressive neuronal inclusion formation and axonal degeneration in CHMP2B mutant transgenic mice. Brian 135: 819-832. https://doi.org/10.1093/brain/aws006
|
| [112] |
Mersiyanova IV, Perepelov AV, Polyakov AV, et al. (2000) A new variant of Charcot-Marie-Tooth disease type 2 is probably the result of a mutation in the neurofilament-light gene. Am J Hum Gene 67: 37-46. https://doi.org/10.1086/302962
|
| [113] |
Skvortsova V, Shadrina M, Slominsky P, et al. (2004) Analysis of heavy neurofilament subunit gene polymorphism in Russian patients with sporadic motor neuron disease (MND). Eur J Hum Genet 12: 241-244. https://doi.org/10.1038/sj.ejhg.5201144
|
| [114] |
Al-Chalabi A, Andersen PM, Nilsson P, et al. (1999) Deletions of the heavy neurofilament subunit tail in amyotrophic lateral sclerosis. Hum Molec Genet 8: 157-164. https://doi.org/10.1093/hmg/8.2.157
|
| [115] |
Giordano G, Cole TB, Furlong CE, et al. (2011) Paraoxonase 2 (PON2) in the mouse central nervous system: a neuroprotective role?. Toxicol Appl Pharmacol 256: 369-378. https://doi.org/10.1016/j.taap.2011.02.014
|
| [116] |
Ticozzi N, LeClerc AL, Keagle PJ, et al. (2010) Paraoxonase gene mutations in amyotrophic lateral sclerosis. Ann Neurol 68: 102-107. https://doi.org/10.1002/ana.21993
|
| [117] |
Mizuno Y, Fujita Y, Takatama M, et al. (2011) Peripherin partially localizes in Bunina bodies in amyotrophic lateral sclerosis. J Neurol Sci 302: 14-18. https://doi.org/10.1016/j.jns.2010.12.023
|
| [118] |
Beaulieu JM, Nguyen MD, Julien JP (1999) Late onset of motor neurons in mice overexpressing wild-type peripherin. J Cell Biol 147: 531-544. https://doi.org/10.1083/jcb.147.3.531
|
| [119] | Corrado L, Carlomagno Y, Falasco L, et al. (2011) A novel peripherin gene (PRPH) mutation identified in one sporadic amyotrophic lateral sclerosis patient. Neurobiol Aging 32: e1-e6. https://doi.org/10.1016/j.neurobiolaging.2010.02.011 |
| [120] |
Elden AC, Kim HJ, Hart MP, et al. (2010) Ataxin-2 intermediate-length polyglutamine expansions are associated with increased risk for ALS. Nature 466: 1069-1075. https://doi.org/10.1038/nature09320
|
| [121] |
Baker M, Mackenzie IR, Pickering-Brown SM, et al. (2006) Mutations in progranulin cause tau-negative frontotemporal dementia linked to chromosome 17. Nature 442: 916-919. https://doi.org/10.1038/nature05016
|
| [122] |
Schymick JC, Yang Y, Andersen PM, et al. (2007) Progranulin mutations and amyotrophic lateral sclerosis or amyotrophic lateral sclerosis-frontotemporal dementia phenotypes. J Neurol Neurosurg Psychiatry 78: 754-756. https://doi.org/10.1136/jnnp.2006.109553
|
| [123] |
Oosthuyse B, Moons L, Storkebaum E, et al. (2001) Deletion of the hypoxia-response element in the vascular endothelial growth factor promoter causes motor neuron degeneration. Nat Genet 28: 131-138. https://doi.org/10.1038/88842
|
| [124] |
Brockington A (2006) Expression of vascular endothelial growth factor and its receptors in the central nervous system in amyotrophic lateral sclerosis. J Neuropathol Exp Neurol 65: 26-36. https://doi.org/10.1097/01.jnen.0000196134.51217.74
|
| [125] |
Lambrechts D, Poesen K, Fernández-Santiago R, et al. (2009) Meta-analysis of vascular endothelial growth factor variations in amyotrophic lateral sclerosis: increased susceptibility in male carriers of the -2578AA genotype. J Med Genet 46: 840-846. https://doi.org/10.1136/jmg.2008.058222
|
| [126] |
Lefebvre S, Burlet P, Liu Q, et al. (1997) Correlation between severity and SMN protein level in spinal muscular atrophy. Nat Genet 16: 265-269. https://doi.org/10.1038/ng0797-265
|
| [127] |
Veldink JH, Kalmijn S, Van der Hout AH, et al. (2005) SMN genotypesproducing less SMN protein increase susceptibility to and severity of sporadic ALS. Neurology 65: 820-825. https://doi.org/10.1212/01.wnl.0000174472.03292.dd
|
| [128] |
Corcia P, Mayeux-Portas V, Khoris J, et al. (2002) Amyotrophic Lateral Sclerosis. Abnormal SMN1 gene copy number is a susceptibility factor for amyotrophic lateral sclerosis. Ann Neurol 51: 243-246. https://doi.org/10.1002/ana.10104
|
| [129] |
Blokhuis AM, Groen EJ, Koppers M, et al. (2013) Protein aggregation in amyotrophic lateral sclerosis. Acta Neuropathol 125: 777-794. https://doi.org/10.1007/s00401-013-1125-6
|
| [130] |
Arai T, Hasegawa M, Akiyama H, et al. (2006) TDP-43 is a component of ubiquitin-positive tau-negative inclusions in frontotemporal lobar degeneration and amyotrophic lateral sclerosis. Biochem Biophys Res Commun 351: 602-611. https://doi.org/10.1016/j.bbrc.2006.10.093
|
| [131] |
Neumann M, Roeber S, Kretzschmar HA, et al. (2009b) Abundant FUS-immunoreactive pathology in neuronal intermediate filament inclusion disease. Acta Neuropathol 118: 605-616. https://doi.org/10.1007/s00401-009-0581-5
|
| [132] |
Doi H, Koyano S, Suzuki Y, et al. (2010) The RNA-binding protein FUS/TLS is a common aggregate-interacting protein in polyglutamine diseases. Neurosci Res 66: 131-133. https://doi.org/10.1016/j.neures.2009.10.004
|
| [133] |
Ferraiuolo L, Kirby J, Grierson AJ, et al. (2011) Molecular pathways of motor neuron injury in amyotrophic lateral sclerosis. Nat Rev Neurol 7: 616-630. https://doi.org/10.1038/nrneurol.2011.152
|
| [134] |
Nishitoh H, Kadowaki H, Nagai A, et al. (2008) ALS-linked mutant SOD1 induces ER stress- and ASK1-dependent motor neuron death by targeting Derlin-1. Genes Dev 22: 1451-1464. https://doi.org/10.1101/gad.1640108
|
| [135] |
Oyanagi K, Yamazaki M, Takahashi H, et al. (2008) Spinal anterior horn cells in sporadic amyotrophic lateral sclerosis show ribosomal detachment from, and cisternal distention of the rough endoplasmic reticulum. Neuropathol Appl Neurobiol 34: 650-658. https://doi.org/10.1111/j.1365-2990.2008.00941.x
|
| [136] |
Mattiazzi M, D'Aurelio M, Gajewski CD, et al. (2002) Mutated human SOD1 causes dysfunction of oxidative phosphorylation in mitochondria of transgenic mice. J Biol Chem 277: 29626-29633. https://doi.org/10.1074/jbc.M203065200
|
| [137] |
Rothstein JD, Martin LJ, Kuncl RW (1992) Decreased glutamate transport by the brain and spinal cord in amyotrophic lateral sclerosis. N Engl J Med 326: 1464-1468. https://doi.org/10.1056/NEJM199205283262204
|
| [138] |
Plaitakis A, Constantakakis E (1993) Altered metabolism of excitatory amino acids, N-acetyl-aspartate and N-acetyl-aspartyl-glutamate in amyotrophic lateral sclerosis. Brain Res Bull 30: 381-386. https://doi.org/10.1016/0361-9230(93)90269-H
|
| [139] |
Ferrarese C, Sala G, Riva R, et al. (2001) Decreased platelet glutamate uptake in patients with amyotrophic lateral sclerosis. Neurology 56: 270-272. https://doi.org/10.1212/WNL.56.2.270
|
| [140] |
Almer G, Vukosavic S, Romero N, et al. (1999) Inducible nitric oxide synthase up-regulation in a transgenic mouse model of familial amyotrophic lateral sclerosis. J Neurochem 72: 2415-2425. https://doi.org/10.1046/j.1471-4159.1999.0722415.x
|
| [141] |
Elliott JL (2001) Cytokine upregulation in a murine model of familial amyotrophic lateral sclerosis. Brain Res Mol Brain Res 95: 172-178. https://doi.org/10.1016/S0169-328X(01)00242-X
|
| [142] |
Doble A (1996) The pharmacology and mechanism of action of riluzole. Neurology 47: 233S-241S. https://doi.org/10.1212/WNL.47.6_Suppl_4.233S
|
| [143] |
Lacomblez L, Bensimon G, Leigh PN, et al. (1996) Amyotrophic Lateral Sclerosis/Riluzole Study Group II. Dose-ranging study of riluzole in amyotrophic lateral sclerosis. Lancet 347: 1425-1431. https://doi.org/10.1016/S0140-6736(96)91680-3
|
| [144] | Mayo Clinic Drug Information. Riluzole (Oral Route)https://www.mayoclinic.org/drugs-supplements/riluzole-oral-route/description/drg-20065853. |
| [145] |
Martin D, Thompson MA, Nadler JV (1993) The neuroprotective agent riluzole inhibits release of Glu and aspartate from slices of hippocampal area CA1. Eur J Pharmacol 250: 473-476. https://doi.org/10.1016/0014-2999(93)90037-I
|
| [146] |
Hubert JP, Delumeau JC, Glowinski J, et al. (1994) Antagonism by riluzole of entry of calcium evoked by NMDA and veratridine in rat cultured granule cells: evidence for a dual mechanism of action. Br J Pharmacol 113: 261-267. https://doi.org/10.1111/j.1476-5381.1994.tb16203.x
|
| [147] |
Carbone M, Duty S, Rattray M (2012) Riluzole neuroprotection in a Parkinson's disease model involves suppression of reactive astrocytosis but not GLT-1 regulation. BMC Neurosci 13: 38. https://doi.org/10.1186/1471-2202-13-38
|
| [148] | ALZ Forum: Riluzule Therapeutics. https://www.alzforum.org/therapeutics/riluzole |
| [149] |
Abe K, Itoyama Y, Sobue G, et al. (2014) Confirmatory double-blind, parallel-group, placebo-controlled study of efficacy and safety of edaravone (MCI-186) in amyotrophic lateral sclerosis patients. Amyotroph Lateral Scler Frontotemporal Degener 15: 610-617. https://doi.org/10.3109/21678421.2014.959024
|
| [150] | Writing Group; Edaravone (MCI-186).ALS 19 Study Group. Safety and efficacy of edaravone in well defined patients with amyotrophic lateral sclerosis: a randomized, double-blind, placebo-controlled trial. Lancet Neurol (2017) 16: 505-512. https://doi.org/10.1016/S1474-4422(17)30115-1 |
| [151] |
Gurney ME, Cutting FB, Zhai P, et al. (1996) Benefit of vitamin E, riluzole, and gabapentin in a transgenic model of familial amyotrophic lateral sclerosis. Ann Neurol 39: 147-157. https://doi.org/10.1002/ana.410390203
|
| [152] |
Peters OM, Ghasemi M, Brown RH (2015) Emerging mechanisms of molecular pathology in ALS. J Clin Invest 125: 1767-79. https://doi.org/10.1172/JCI71601
|
| [153] |
Cozzolino M, Pesaresi MG, Gerbino V, et al. (2012) Amyotrophic lateral sclerosis: new insights into underlying molecular mechanisms and opportunities for therapeutic intervention. Antioxid Redox Signal 17: 1277-330. https://doi.org/10.1089/ars.2011.4328
|
| [154] |
Tortelli R, Zecca C, Piccininni M, et al. (2020) Plasma Inflammatory Cytokines Are Elevated in ALS. Front Neurol 11: 552295. https://doi.org/10.3389/fneur.2020.552295
|
| [155] |
Gagliardi D, Meneri M, Saccomanno D, et al. (2019) Diagnostic and Prognostic Role of Blood and Cerebrospinal Fluid and Blood Neurofilaments in Amyotrophic Lateral Sclerosis: A Review of the Literature. Int J Mol Sci 20: 4152. https://doi.org/10.3390/ijms20174152
|
| [156] |
Lijmer JG, Mol BW, Heisterkamp S, et al. (1999) Empirical evidence of design-related bias in studies of diagnostic tests. JAMA 282: 1061-6. https://doi.org/10.1001/jama.282.11.1061
|
| [157] |
Freischmidt A, Müller K, Ludolph AC, et al. (2013) Systemic dysregulation of TDP-43 binding microRNAs in amyotrophic lateral sclerosis. Acta Neuropathol Com 1: article 42. https://doi.org/10.1186/2051-5960-1-42
|
Figures(1) / Tables(3)

Ashok Chakraborty, Anil Diwan. Biomarkers and molecular mechanisms of Amyotrophic Lateral Sclerosis[J]. AIMS Neuroscience, 2022, 9(4): 423-443. doi: 10.3934/Neuroscience.2022023


 DownLoad: