Rapid diagnosis to test diseases, such as COVID-19, is a significant issue. It is a routine virus test in a reverse transcriptase-polymerase chain reaction. However, a test like this takes longer to complete because it follows the serial testing method, and there is a high chance of a false-negative ratio (FNR). Moreover, there arises a deficiency of R.T.–PCR test kits. Therefore, alternative procedures for a quick and accurate diagnosis of patients are urgently needed to deal with these pandemics. The infrared image is self-sufficient for detecting these diseases by measuring the temperature at the initial stage. C.T. scans and other pathological tests are valuable aspects of evaluating a patient with a suspected pandemic infection. However, a patient's radiological findings may not be identified initially. Therefore, we have included an Artificial Intelligence (A.I.) algorithm-based Machine Intelligence (MI) system in this proposal to combine C.T. scan findings with all other tests, symptoms, and history to quickly diagnose a patient with a positive symptom of current and future pandemic diseases. Initially, the system will collect information by an infrared camera of the patient's facial regions to measure temperature, keep it as a record, and complete further actions. We divided the face into eight classes and twelve regions for temperature measurement. A database named patient-info-mask is maintained. While collecting sample data, we incorporate a wireless network using a cloudlets server to make processing more accessible with minimal infrastructure. The system will use deep learning approaches. We propose convolution neural networks (CNN) to cross-verify the collected data. For better results, we incorporated tenfold cross-verification into the synthesis method. As a result, our new way of estimating became more accurate and efficient. We achieved 3.29% greater accuracy by incorporating the "decision tree level synthesis method" and "ten-folded-validation method". It proves the robustness of our proposed method.
Citation: Mohammed Alhameed, Fathe Jeribi, Bushra Mohamed Elamin Elnaim, Mohammad Alamgir Hossain, Mohammed Eltahir Abdelhag. Pandemic disease detection through wireless communication using infrared image based on deep learning[J]. Mathematical Biosciences and Engineering, 2023, 20(1): 1083-1105. doi: 10.3934/mbe.2023050
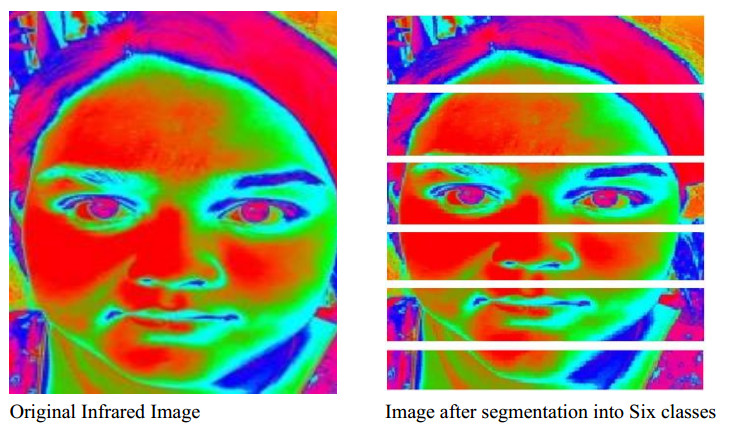
Rapid diagnosis to test diseases, such as COVID-19, is a significant issue. It is a routine virus test in a reverse transcriptase-polymerase chain reaction. However, a test like this takes longer to complete because it follows the serial testing method, and there is a high chance of a false-negative ratio (FNR). Moreover, there arises a deficiency of R.T.–PCR test kits. Therefore, alternative procedures for a quick and accurate diagnosis of patients are urgently needed to deal with these pandemics. The infrared image is self-sufficient for detecting these diseases by measuring the temperature at the initial stage. C.T. scans and other pathological tests are valuable aspects of evaluating a patient with a suspected pandemic infection. However, a patient's radiological findings may not be identified initially. Therefore, we have included an Artificial Intelligence (A.I.) algorithm-based Machine Intelligence (MI) system in this proposal to combine C.T. scan findings with all other tests, symptoms, and history to quickly diagnose a patient with a positive symptom of current and future pandemic diseases. Initially, the system will collect information by an infrared camera of the patient's facial regions to measure temperature, keep it as a record, and complete further actions. We divided the face into eight classes and twelve regions for temperature measurement. A database named patient-info-mask is maintained. While collecting sample data, we incorporate a wireless network using a cloudlets server to make processing more accessible with minimal infrastructure. The system will use deep learning approaches. We propose convolution neural networks (CNN) to cross-verify the collected data. For better results, we incorporated tenfold cross-verification into the synthesis method. As a result, our new way of estimating became more accurate and efficient. We achieved 3.29% greater accuracy by incorporating the "decision tree level synthesis method" and "ten-folded-validation method". It proves the robustness of our proposed method.

| [1] |
M. Karnati, A. Seal, G. Sahu, A. Yazidi, O. Krejcar, A novel multi-scale based deep convolutional neural network for detecting COVID-19 from X-rays, Appl. Soft Comput., 125 (2022), 109109. https://doi.org/10.1016/j.asoc.2022.109109 doi: 10.1016/j.asoc.2022.109109

|
| [2] | S. Vyas, A. Seal, A comparative study of different feature extraction techniques for identifying COVID-19 patients using chest X-rays images, in 2020 International Conference on Decision Aid Sciences and Application, (2020), 209–213. https://doi.org/10.1109/DASA51403.2020.9317299 |
| [3] |
G. N. Ahmad, S. Ullah, A. Algethami, H. Fatima, S. M. H. Akhter, Comparative study of optimum medical diagnosis of human heart disease using machine learning technique with and without sequential feature selection, IEEE Access, 10 (2022), 23808–23828. https://doi.org/10.1109/ACCESS.2022.3153047 doi: 10.1109/ACCESS.2022.3153047
|
| [4] |
G. N. Ahmad, H. Fatima, S. Ullah, A. S. Saidi, Imdadullah, Efficient medical diagnosis of human heart diseases using machine learning techniques with and without GridSearchCV, IEEE Access, (2022), 1–24. https://doi.org/10.1109/ACCESS.2022.3165792 doi: 10.1109/ACCESS.2022.3165792
|
| [5] |
A. Chharia, R. Upadhyay, V. Kumar, C. Cheng, J. Zhang, T. Wang, et al., Deep-precognitive diagnosis: Preventing future pandemics by novel disease detection with biologically-inspired conv-fuzzy network, IEEE Access, 10 (2022), 23167–23185. https://doi.org/10.1109/ACCESS.2022.3153059 doi: 10.1109/ACCESS.2022.3153059
|
| [6] |
M. A. Hossain, S. A. Turkey, G. Sanyal, A novel stochastic tracking approach on human movement analysis, Int. J. Comput. Appl., 86 (2014), 36–40. https://doi.org/10.5120/15089-3488 doi: 10.5120/15089-3488
|
| [7] | M. A. Hossain, D. Samanta, G. Sanyal, Eye diseases detection based on covariance, Int. J. Comput. Sci. Inform. Secur., 2 (2012), 376–379. |
| [8] |
N. M. Moacdieh, N. Sarter, The effects of data density, display organization, and stress on search performance: An eye tracking study of clutter, IEEE Trans. Human Mach. Syst., 47 (2017), 886–895. https://doi.org/10.1109/THMS.2017.2717899 doi: 10.1109/THMS.2017.2717899
|
| [9] |
M. A. Hossain, B. Assiri, An enhanced eye-tracking approach using pipeline computation, Arabian J. Sci. Eng., 45 (2020), 3191–3204. https://doi.org/10.1007/s13369-019-04322-7 doi: 10.1007/s13369-019-04322-7
|
| [10] |
K. Kurzhals, M. Hlawatsch, C. Seeger, D. Weiskopf, Visual analytics for mobile eye tracking, IEEE Trans. Visual. Comput. Graph., 23 (2017), 301–310. https://doi.org/10.1109/TVCG.2016.2598695 doi: 10.1109/TVCG.2016.2598695
|
| [11] |
M. A. Hossain, B. Assiri, Facial emotion verification by infrared image, IEEE, (2020), 12–14. https://doi.org/10.1109/ESCI48226.2020.9167616 doi: 10.1109/ESCI48226.2020.9167616
|
| [12] |
M. Kim, B. H. Kim, S. Jo, Quantitative evaluation of a low-cost noninvasive hybrid interface based on EEG and eye movement, IEEE Trans. Neural Syst. Rehab. Eng., 23 (2015), 59–168. https://doi.org/10.1109/TNSRE.2014.2365834 doi: 10.1109/TNSRE.2014.2365834
|
| [13] | M. A. Hossain, H. Zogan, G. Sanyal, Emotion tracking and grading based on sophisticated statistical approach, in International Conference on Science, Technology, Engineering and Mathematics, (2018), 21–22. |
| [14] |
D. Kumar, A. Dutta, A. Das, U. Lahiri, SmartEye: Developing a novel eye tracking system for quantitative assessment of oculomotor abnormalities, IEEE Trans. Neural Syst. Rehab. Eng., 24 (2016), 1051–1059. https://doi.org/10.1109/TNSRE.2016.2518222 doi: 10.1109/TNSRE.2016.2518222
|
| [15] | A. H. Mohammad, A. Basem, Emotion specific human face authentication based on infrared thermal image, in International Conference on Communication and Information Systems, (2020), 13–15. https://doi.org/10.1109/ICCIS49240.2020.9257683 |
| [16] |
Z. Kang, S. J. Landry, An eye movement analysis algorithm for a multielement target tracking task: Maximum transition-based agglomerative hierarchical clustering, IEEE Trans. Human Mach. Syst., 45 (2015), 13–24. https://doi.org/10.1109/THMS.2014.2363121 doi: 10.1109/THMS.2014.2363121
|
| [17] |
W. Zhang, H. Liu, Toward a reliable collection of eye-tracking data for image quality research: Challenges, solutions, and applications, IEEE Transact. Image Process., 26 (2017), 2424–2437. https://doi.org/10.1109/TIP.2017.2681424 doi: 10.1109/TIP.2017.2681424
|
| [18] |
S. Happy, A. Routray, Automatic facial expression recognition using features of salient facial patches, IEEE Trans. IEEE Trans. Autom. Control, 6 (2014), 1–12. https://doi.org/10.1109/TAFFC.2014.2386334 doi: 10.1109/TAFFC.2014.2386334
|
| [19] |
X. Zhang, S. M. Yua, An eye tracking analysis for video advertising: Relationship between advertisement elements and effectiveness, IEEE Access, 6 (2018), 10699–10707. https://doi.org/10.1109/ACCESS.2018.2802206 doi: 10.1109/ACCESS.2018.2802206
|
| [20] |
M. A. Hossain, G. Sanyal, Tracking humans based on interest point over span-space in multifarious situations, Int. J. Software Eng. Appl., 10 (2016), 175–192. https://doi.org/10.1109/TAFFC.2014.2386334 doi: 10.1109/TAFFC.2014.2386334
|
| [21] |
Y. Liu, Y. Cao, Y. Li, M. Liu, R. Song, Y. Wang, et al., Facial expression recognition with PCA and LBP features extracting from active facial patches, IEEE, (2016), 368–373. https://doi.org/10.1109/RCAR.2016.7784056 doi: 10.1109/RCAR.2016.7784056
|
| [22] |
M. A. Hossain, G. Sanyal, A novel approach to extract region from facial expression based on mutation, Int. Janit. Clean. Serv. Assoc., 2 (2012), 15–18. https://doi.org/10.1109/RCAR.2016.7784056 doi: 10.1109/RCAR.2016.7784056
|
| [23] |
M. A. Hossain, A. M. A Bamhdi, G. S. Sanyal, A new tactic to maintain privacy and safety of imagery information, Int. J. Comput. Appl., 110 (2015), 6–12. https://doi.org/10.5120/19310-0764 doi: 10.5120/19310-0764
|
| [24] | L. Zhong, Q. Liu, P. Yang, B. Liu, J. Huang, D. Metaxas, Learning active facial patches for expression analysis, in IEEE Conference on Computer Vision and Pattern Recognition, (2012), 16–21. https://doi.org/10.1109/CVPR.2012.6247974 |
| [25] |
T. Wu, P. Wang, Y. Lin, C. Zhou, A robust noninvasive eye control approach for disabled people based on Kinect 2.0 sensor, IEEE Sensors Letters, 1 (2017), 1–4. https://doi.org/10.1109/LSENS.2017.2720718 doi: 10.1109/LSENS.2017.2720718
|
| [26] | A. H. Mohammad, G. Sanyal, Object tracking podium on region covariance for recognition and classification, Int. J. Emerg. Technol. Comput. Appl. Sci., 2 (2012), 68–73. |
| [27] |
S. H Lee, K. N. Plataniotis, Y. M. Ro, Intra-class variation reduction using training expression images for sparse representation based facial expression recognition, IEEE Trans. Autom. Control, 5 (2014), 340–531. https://doi.org/10.1109/TAFFC.2014.2346515 doi: 10.1109/TAFFC.2014.2346515
|
| [28] | H. A. Mohammad, S. Samanta, S. Sanyal, Extraction of panic expression depending on lip detection, in 2012 International Conference on Computing Sciences, (2012), 137–141. https://doi.org/10.1109/ICCS.2012.35 |
| [29] | A. Mollahosseini, D. Chan, M. H. Mahoor, Going deeper in facial expression recognition using deep neural networks, in 2016 IEEE Winter Conference on Applications of Computer Vision, (2016), 1–10. https://doi.org/10.1109/WACV.2016.7477450 |
| [30] |
M. A. Hossain, B. Assiri, Facial expression recognition based on active region of interest using deep learning and parallelism, PeerJ Comput. Sci., 8 (2022), e894. https://doi.org/10.7717/peerj-cs.894 doi: 10.7717/peerj-cs.894
|
| [31] |
R. Saranya, C. Poongodi, D. Somasundaram, M. Nirmala, Novel deep learning model for facial expression recognition based on maximum boosted CNN and LSTM, IET Image Process., 14 (2020), 1373–1381. https://doi.org/10.1049/iet-ipr.2019.1188 doi: 10.1049/iet-ipr.2019.1188
|
| [32] |
A. T. Lopes, E. Aguiar, A. F. De Souza, T. Oliveira-Santos, Facial expression recognition with convolutional neural networks: Coping with few data and the training sample order, Pattern Recogn., 61 (2017), 610–628. https://doi.org/10.1016/j.patcog.2016.07.026 doi: 10.1016/j.patcog.2016.07.026
|
| [33] |
R. Janarthanan, E. A. Refaee, K. Selvakumar, M. A. Hossain, R. Soundrapandiyan, M. Karuppiah, Biomedical image retrieval using adaptive neuro-fuzzy optimized classifier system, Math. Biosci. Eng., 19 (2022), 8132–8151. https://doi.org/10.3934/mbe.2022380 doi: 10.3934/mbe.2022380
|
| [34] | P. Shen, S. Wang, X. Liu, Facial expression recognition from infrared thermal videos, in Intelligent Autonomous Systems 12. Advances in Intelligent Systems and Computing (eds S. Lee, H. Cho, K. J. Yoon and J. Lee), Springer, (2013), 323–333. https://doi.org/10.1016/j.imavis.2011.07.002 |
| [35] |
S. Pastel, J. Marlok, N. Bandow, K. Witte, Application of eye-tracking systems integrated into immersive virtual reality and possible transfer to the sports sector-A systematic review, Multimed. Tools Appl., (2022). https://doi.org/10.1007/s11042-022-13474-y doi: 10.1007/s11042-022-13474-y
|
| [36] | M. A. Hossain, D. Samanta, G. Sanyal, Statistical approach for extraction of panic expression, in 2012 Fourth International Conference on Computational Intelligence and Communication Networks, 420–424, https://doi.org/10.1109/CICN.2012.189 |
| [37] |
S. S. Alam, R. Jianu, Analyzing eye-tracking information in visualization and data space: From where on the screen to what on the screen, IEEE Trans. Visual. Comput. Graph., 23 (2017), 1492–1505. https://doi.org/10.1109/TVCG.2016.2535340 doi: 10.1109/TVCG.2016.2535340
|
| [38] |
D. H. Jiang, Y. Z. Hu, D. Lei, P. Jin, Facial expression recognition based on attention mechanism, Sci. Program., 2021 (2021), Article ID 6624251. https://doi.org/10.1155/2021/6624251 doi: 10.1155/2021/6624251
|
| [39] |
Z. An, W. Deng, J. Hu, Y. Zhong, Y. Zhao, Adaptive pose alignment for pose-invariant face recognition, IEEE Access, 7 (2019), 14653–14670. https://doi.org/10.1109/ACCESS.2019.2894162 doi: 10.1109/ACCESS.2019.2894162
|
| [40] |
M. D. H. Alamgir, D. Samanta, G. Sanyal, Automated smiley face extraction based on genetic algorithm, Comput. Sci. Inform. Technol., (2012), 31–37. https://doi.org/10.5121/csit.2012.2304 doi: 10.5121/csit.2012.2304
|
| [41] |
J. Y. Choi, B. Lee, Ensemble of deep convolutional neural networks with gabor face representations for face recognition, IEEE Transact. Image Process., 29 (2020), 3270–3328. https://doi.org/10.1109/TIP.2019.2958404. doi: 10.1109/TIP.2019.2958404
|
| [42] |
Z. Lei, L. Ji, Z. Bob, Z. David, Z. Ce, Deep cascade model-based face recognition: When deep-layered learning meets small data, IEEE Transact. Image Process., 29 (2020), 1016–1029. https://doi.org/10.1109/TIP.2019.2938307 doi: 10.1109/TIP.2019.2938307
|
| [43] |
A. H. Mohd, S. Gautam, A new improved tactic to extract facial expression based on genetic algorithm and WVDF, Int. J. Adv. Inform. Technol., 2 (2012), 37–44. https://doi.org/10.5121/ijait.2012.2504.37 doi: 10.5121/ijait.2012.2504.37
|
| [44] |
A. C. Elizabeth, K. J. Nai, E. D. Susan, A. B. Martha, L. Jacob, L. G. Daniel, et al., The facial action coding system for characterization of human affective response to consumer product-based stimuli: A systematic review, Front. Psychol., 11 (2020), 920. https://doi.org/10.3389/fpsyg.2020.00920 doi: 10.3389/fpsyg.2020.00920
|
| [45] |
S. M. Lajevardi, Z. M. Hussain, Automatic facial expression recognition: Feature extraction and selection, Signal Image Video Process., 6 (2010), 159–169. https://doi.org/10.1007/s11760-010-0177-5 doi: 10.1007/s11760-010-0177-5
|
| [46] | M. H Alamgir, D. S. S. Goutam, A novel approach for panic-face extraction based on mutation, in International Conference on Advanced Communication Control & Computing Technology, (2012), 473–477. https://doi.org/10.1109/ICACCCT.2012.6320825 |
| [47] |
F. Zhang, F. Wang, Exercise fatigue detection algorithm based on video image information extraction, IEEE Access, 8 (2020), 199696–199709. https://doi.org/10.1109/ACCESS.2020.3023648 doi: 10.1109/ACCESS.2020.3023648
|
| [48] | M. A. Hossain, G. Sanyal, Extraction of panic expression from human face based on histogram approach, in International Conference on Image Processing, (2012), 411–418. https://doi.org/10.1007/978-3-642-31686-9_48 |
| [49] |
C. Vincenzo, G. Antonio, P. Gennaro, V. Mario, Age from faces in the deep learning revolution, IEEE Trans. Pattern Anal. Mach. Intell., 42 (2020), 2113–2132. https://doi.org/10.1109/TPAMI.2019.2910522. doi: 10.1109/TPAMI.2019.2910522
|
| [50] |
B. Jin, C. Leandro, G. Nuno, Deep facial diagnosis: Deep transfer learning from face Recognition to facial diagnosis, IEEE Access, (2020). https://doi.org/10.1109/ACCESS.2020.3005687 doi: 10.1109/ACCESS.2020.3005687
|
| [51] |
L. Daqi, B. Nicola, Y. Shigang, Deep spiking neural network for video-based disguise face recognition based on dynamic facial movements, IEEE Trans. Neural Netw. Learn. Syst., 31 (2020), 1843–1855. https://doi.org/10.1109/TNNLS.2019.2927274 doi: 10.1109/TNNLS.2019.2927274
|
| [52] |
Y. Said, M. Barr, H. E. Ahmed, Design of a face recognition system based on convolutional neural network (CNN), Eng. Technol. Appl. Sci. Res., 10 (2020), 5608–5612. https://doi.org/10.1109/CAC48633.2019.8996236 doi: 10.1109/CAC48633.2019.8996236
|
| [53] |
A. Nada, H. A. B. Heyam, Deep learning approach for multimodal biometric recognition system based on fusion of iris, face, and finger vein traits, Sensor, 20 (2020), 5523–5539. https://doi.org/10.3390/s20195523 doi: 10.3390/s20195523
|
| [54] |
A. Jawad, A. AlBdairi, Z. Xiao, M. Alghaili, Identifying ethnics of people through face recognition: A deep CNN approach, Sci. Program., 2020 (2020), article ID 6385281. https://doi.org/10.1155/2020/6385281 doi: 10.1155/2020/6385281
|
| [55] |
W. W. R. Almeida, F. A. Andaló, R. Padilha, G. Bertocco, W. Dias, R. S. Torres, et al., Detecting face presentation attacks in mobile devices with a patch-based CNN and a sensor aware loss function, PLoS One, (2020), 1–24. https://doi.org/10.1155/2020/6385 doi: 10.1155/2020/6385
|


Figures(7) / Tables(2)

Mohammed Alhameed, Fathe Jeribi, Bushra Mohamed Elamin Elnaim, Mohammad Alamgir Hossain, Mohammed Eltahir Abdelhag. Pandemic disease detection through wireless communication using infrared image based on deep learning[J]. Mathematical Biosciences and Engineering, 2023, 20(1): 1083-1105. doi: 10.3934/mbe.2023050


 DownLoad: