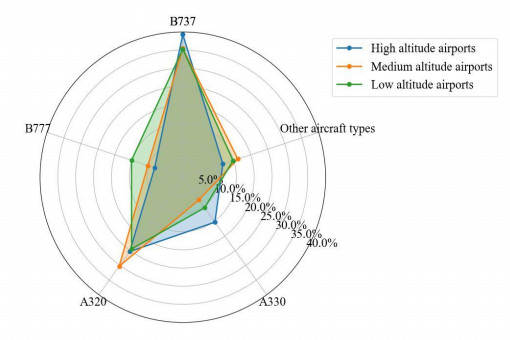
We utilized the International Civil Aviation Organization (ICAO) standard emission model, refined with adjustments for fuel flow, LTO cycle work mode time, and emission indices, to investigate the environmental footprint of airports at different altitudes. Airports categorized as high (above 5000 $ \mathrm{f}\mathrm{t} $), medium (1500–5000 $ \mathrm{f}\mathrm{t} $), and low (below 1500 $ \mathrm{f}\mathrm{t} $) altitudes were selected to provide a comprehensive representation of the altitude spectrum. The analysis was anchored over the period spanning 2016 to 2017. Emission inventories for air pollutants and noise were computed for these airports, focusing on the LTO (Landing and Take-Off) cycle. Our findings indicated that high altitude airports exhibit the highest $ {\mathrm{N}\mathrm{O}}_{\mathrm{x}} $ emissions, reaching 406.4 $ \mathrm{t} $, whereas low altitude airports record the highest noise levels at 73.1 $ \mathrm{d}\mathrm{B} $. Significant disparities in emission profiles were observed across different phases of the LTO cycle at airports of varying altitudes. Notably, during the climb phase, the types and proportion of $ {\mathrm{N}\mathrm{O}}_{\mathrm{x}} $ emissions at high altitude airports were as high as 71.8%, contrasting with the 45.6% at low altitude airports. Additionally, emissions of gaseous pollutants from major aircrafts, exemplified by the A320 model, escalated with altitude. Specifically, $ {\mathrm{N}\mathrm{O}}_{\mathrm{x}} $ emissions increased from 10.55 $ \mathrm{k}\mathrm{g}/\mathrm{c}\mathrm{y}\mathrm{c}\mathrm{l}\mathrm{e} $ at low altitude to 20.48 $ \mathrm{k}\mathrm{g}/\mathrm{c}\mathrm{y}\mathrm{c}\mathrm{l}\mathrm{e} $ at high altitude, and $ \mathrm{C}\mathrm{O} $ emissions from 10.88 $ \mathrm{k}\mathrm{g}/\mathrm{c}\mathrm{y}\mathrm{c}\mathrm{l}\mathrm{e} $ to 22.89 $ \mathrm{k}\mathrm{g}/\mathrm{c}\mathrm{y}\mathrm{c}\mathrm{l}\mathrm{e} $. A robust correlation between $ {\mathrm{N}\mathrm{O}}_{\mathrm{x}} $ emissions and $ {L}_{den} $ was identified among airports at different altitudes, with correlation coefficients of 0.96 for low altitude, 0.97 for medium altitude, and 0.93 for high altitude airports. This study delineates the distinct characteristics of air pollutant and noise emissions from airports across altitudes, offering novel insights for the environmental assessment of airport operations.
Citation: Weizhen Tang, Jie Dai, Zhousheng Huang. Comprehensive assessment of air pollutant and noise emissions at airports across different altitudes[J]. Metascience in Aerospace, 2024, 1(3): 292-308. doi: 10.3934/mina.2024013
We utilized the International Civil Aviation Organization (ICAO) standard emission model, refined with adjustments for fuel flow, LTO cycle work mode time, and emission indices, to investigate the environmental footprint of airports at different altitudes. Airports categorized as high (above 5000 $ \mathrm{f}\mathrm{t} $), medium (1500–5000 $ \mathrm{f}\mathrm{t} $), and low (below 1500 $ \mathrm{f}\mathrm{t} $) altitudes were selected to provide a comprehensive representation of the altitude spectrum. The analysis was anchored over the period spanning 2016 to 2017. Emission inventories for air pollutants and noise were computed for these airports, focusing on the LTO (Landing and Take-Off) cycle. Our findings indicated that high altitude airports exhibit the highest $ {\mathrm{N}\mathrm{O}}_{\mathrm{x}} $ emissions, reaching 406.4 $ \mathrm{t} $, whereas low altitude airports record the highest noise levels at 73.1 $ \mathrm{d}\mathrm{B} $. Significant disparities in emission profiles were observed across different phases of the LTO cycle at airports of varying altitudes. Notably, during the climb phase, the types and proportion of $ {\mathrm{N}\mathrm{O}}_{\mathrm{x}} $ emissions at high altitude airports were as high as 71.8%, contrasting with the 45.6% at low altitude airports. Additionally, emissions of gaseous pollutants from major aircrafts, exemplified by the A320 model, escalated with altitude. Specifically, $ {\mathrm{N}\mathrm{O}}_{\mathrm{x}} $ emissions increased from 10.55 $ \mathrm{k}\mathrm{g}/\mathrm{c}\mathrm{y}\mathrm{c}\mathrm{l}\mathrm{e} $ at low altitude to 20.48 $ \mathrm{k}\mathrm{g}/\mathrm{c}\mathrm{y}\mathrm{c}\mathrm{l}\mathrm{e} $ at high altitude, and $ \mathrm{C}\mathrm{O} $ emissions from 10.88 $ \mathrm{k}\mathrm{g}/\mathrm{c}\mathrm{y}\mathrm{c}\mathrm{l}\mathrm{e} $ to 22.89 $ \mathrm{k}\mathrm{g}/\mathrm{c}\mathrm{y}\mathrm{c}\mathrm{l}\mathrm{e} $. A robust correlation between $ {\mathrm{N}\mathrm{O}}_{\mathrm{x}} $ emissions and $ {L}_{den} $ was identified among airports at different altitudes, with correlation coefficients of 0.96 for low altitude, 0.97 for medium altitude, and 0.93 for high altitude airports. This study delineates the distinct characteristics of air pollutant and noise emissions from airports across altitudes, offering novel insights for the environmental assessment of airport operations.

| [1] |
Dessens O, Kohler M O, Rogers H L, et al. (2014) Aviation and climate change. Transport Policy 34: 14–20. https://doi.org/10.1016/j.tranpol.2014.02.014 doi: 10.1016/j.tranpol.2014.02.014

|
| [2] |
Chu YP (2013) Impacts of aircraft exhaust emissions on air quality in the vicinity of Shanghai Pudong International Airport. Environ Monit Early Warning 5: 50–52+56. https://doi.org/10.3969/j.issn.1674-6732.2013.04.016 doi: 10.3969/j.issn.1674-6732.2013.04.016
|
| [3] |
Stettler ME, Eastham S, Barrett SRH (2011) Air quality and public health impacts of UK airports. part l: Emissions. Atmos Environ 45: 5415–5424. https://doi.org/10.1016/j.atmosenv.2011.07.012 doi: 10.1016/j.atmosenv.2011.07.012
|
| [4] |
Wilcox LJ, Shine KP, Hoskins BJ (2012) Radiative forcing due to aviation water vapour emissions. Atmos Environ 63: 1–13. https://doi.org/10.1016/j.atmosenv.2012.08.072 doi: 10.1016/j.atmosenv.2012.08.072
|
| [5] |
Meister J, Schalcher S, Wunderli JM, et al. (2021) Comparison of the aircraft noise calculation programs sonAIR, FLULA2 and AEDT with noise measurements of single flights. Aerospace 8: 388. https://doi.org/10.3390/aerospace8120388 doi: 10.3390/aerospace8120388
|
| [6] |
Ollerhead J, Sharp B (2001) MAGENTA-Assessments of Future Aircraft Noise Policy Options. Aair Space Europe 3: 247–249. https://doi.org/10.1016/S1290-0958(01)90108-X doi: 10.1016/S1290-0958(01)90108-X
|
| [7] |
Mato RR, Mufuruki TS (1999) Noise Pollution Associated with the Operation of the Dar Es Salaam International Airport. Transport Res D-Tr E 4: 81–89. https://doi.org/10.1016/S1361-9209(98)00024-8 doi: 10.1016/S1361-9209(98)00024-8
|
| [8] |
Xia Q (2012) Aircraft Engine Emission Impact Assessment of Airports on the Atmospheric Environment. Nanjing U Aeronaut Astronaut. https://doi.org/10.7666/d.y1855019 doi: 10.7666/d.y1855019
|
| [9] |
Hudda N, Fruin SA (2015) International airport impacts to air quality: size and related properties of large increases in ultrafine particle number concentrations. Environ Sci Technol 50: 3362–3370. https://doi.org/10.1021/acs.est.5b05313 doi: 10.1021/acs.est.5b05313
|
| [10] | Kampa M, Castanas E (2008) Human health effects of air pollution. Environ Pollut 151: 362–367. |
| [11] |
Wasiuk DK, Khan MAH, Shallcross DE, et al. (2016) A commercial aircraft fuel burn and emissions inventory for 2005–2011. Atmosphere 7: 78. https://doi.org/10.3390/atmos7060078 doi: 10.3390/atmos7060078
|
| [12] |
Cao HL, Miao JH, Miao LY, et al. (2019) Study on the estimation method of daily emission inventory of aircraft engines at the capital airport based on actual flight data. J Environ Sci 39: 2699–2707. https://doi.org/10.13671/j.hjkxxb.2019.0048 doi: 10.13671/j.hjkxxb.2019.0048
|
| [13] |
Li J, Zhao ZQ, Liu XK, et al. (2018) Computational analysis of aircraft emission inventory at Capital International Airport. China Environ Sci 38: 4469–4475. https://doi.org/10.3969/j.issn.1000-6923.2018.12.009 doi: 10.3969/j.issn.1000-6923.2018.12.009
|
| [14] |
Xu R, Lang JB, Yang XW, et al. (2016) Establishment of an aircraft emission inventory at the Capital International Airport. China Environ Sci 36: 2554–2560. https://doi.org/10.3969/j.issn.1000-6923.2016.08.038 doi: 10.3969/j.issn.1000-6923.2016.08.038
|
| [15] |
Xu R, Lang JB, Cheng SY, et al. (2017) Inventory of mobile source air pollutant emissions at the Capital International Airport. J Safety Environ 17: 1957–1962. https://doi.org/10.13637/j.issn.1009-6094.2017.05.065 doi: 10.13637/j.issn.1009-6094.2017.05.065
|
| [16] |
Wang YN, Sun NX, Feng JH, et al. (2023) Emissions from Beijing Daxing International Airport and their environmental impacts and predictions. J Environ Sci 43: 153–165. https://doi.org/10.13671/j.hjkxxb.2022.0426 doi: 10.13671/j.hjkxxb.2022.0426
|
| [17] |
Li N, Sun Y, Gao Z (2019) Computational analysis of aircraft emission inventory at Pudong International Airport. Aviat Comput Technol 49: 15–19. https://doi.org/10.3969/j.issn.1671-654X.2019.03.004 doi: 10.3969/j.issn.1671-654X.2019.03.004
|
| [18] |
Huang QF, Chen GN, Hu DX, et al. (2014) Analysis of air pollutant emissions from aircraft at Guangzhou Baiyun International Airport. Environ Monit Manage Technol 26: 57–59. https://doi.org/10.3969/j.issn.1006-2009.2014.03.022 doi: 10.3969/j.issn.1006-2009.2014.03.022
|
| [19] |
Wang RL, Cheng H, Ren HJ, et al. (2018) Inventory of air pollutant emissions from the takeoff and landing (LTO) cycle of civil aircraft in the Yangtze River Delta region. J Environ Sci 38: 4472–4479. https://doi.org/10.13671/j.hjkxxb.2018.0262 doi: 10.13671/j.hjkxxb.2018.0262
|
| [20] |
Han B, Kong WK, Yao TW, et al. (2020) Inventory of air pollutant emissions from aircraft LTO in the Beijing-Tianjin-Hebei airport cluster. Environ Sci 41: 1143–1150. https://doi.org/10.13227/j.hjkx.201908199 doi: 10.13227/j.hjkx.201908199
|
| [21] |
Du YY (2022) Prediction and prevention of aircraft noise pollution at Tianjin airport based on INM model. Noise Vib Control 42: 186–190. https://doi.org/10.3969/j.issn.1006-1355.2022.02.031 doi: 10.3969/j.issn.1006-1355.2022.02.031
|
| [22] |
Cheng DL, Yi CJ, Liang ZF (2005) Research on aircraft noise and countermeasures. Noise Vib Control 25: 47–51. https://doi.org/10.3969/j.issn.1006-1355.2005.05.016 doi: 10.3969/j.issn.1006-1355.2005.05.016
|
| [23] |
Mato RR, Mufuruki TS (1999) Noise Pollution Associated with the Operation of the Dar Es Salaam International Airport. Transport Environ 4: 277–289. https://doi.org/10.1016/S1361-9209(98)00024-8 doi: 10.1016/S1361-9209(98)00024-8
|
| [24] | International Civil Aviation Organization. 2014. ICAO Environmental Report 2013. International Civil Aviation Organization. |
| [25] |
Wei C, Diao HZ, Han B (2014) Calculation of pollutant emissions from civil aircraft during cruise phase. Science. Technol Eng 14: 122–127. https://doi.org/10.3969/j.issn.1671-1815.2014.19.023 doi: 10.3969/j.issn.1671-1815.2014.19.023
|
| [26] | The Environment Branch of the International Civil Aviation Organization (ICAO). (2014). ICAO Environmental Report 2013. International Civil Aviation Organization. |
| [27] |
Chandrasekaran N, Guha A (2012) Study of prediction methods for NOx emission from turbofan engines. J Propuls Power 28: 170–180. https://doi.org/10.2514/1.B34245 doi: 10.2514/1.B34245
|
| [28] |
Huang MY, Hu R, Zhang JF, et al. (2020) Calculation and analysis of aircraft exhaust emissions based on fast access logger data. Science. Technol Eng 20: 13502–13507. https://doi.org/10.3969/j.issn.1671-1815.2020.32.060 doi: 10.3969/j.issn.1671-1815.2020.32.060
|
| [29] | Kalivoda MT, Monika K (1998) Methodologies for estimating emissions from air trafficc: future emissions [R]. MEET Project ST-96-SC, 204, Vienna, Austria: Perchtoldsdorf-Vienna, 46–53. |
| [30] | ISO 20906. 2009. Acoustics-unattended monitoring of aircraft sound in the vicinity of airports. |
| [31] | Directive EU (2002) Directive 2002/49/EC of the European parliament and the Council of 25 June 2002 relating to the assessment and management of environmental noise. Off J Eur Commun L 189: 2002. |
| [32] | Federal Aviation Administration (1983) Noise control and compatibility planning for airports. Advisory circular AC150-5020-1. |
| [33] |
Cao XY, Liu Q, Liu Z, et al. (2022) Assessment of pollutant emissions from the LTO cycle of Chinese civil aviation aircraft. Environ Sci Technol 45: 116–124. https://link.cnki.net/doi/10.19672/j.cnki.1003-6504.2303.21.338 doi: 10.19672/j.cnki.1003-6504.2303.21.338
|
| [34] | Wu ZB (2017) Research on fuel ignition characteristics and combustion enhancement in high altitude environment. University of Science and Technology of China. |
| [35] |
Dai SP, Jia XH, Ding SJ, et al. (2024) Experimental study on the combustion characteristics of small-scale oil pool fire in restricted space in plateau. Fire Sci Technol 43: 161–167. https://doi.org/10.3969/j.issn.1009-0029.2024.02.004 doi: 10.3969/j.issn.1009-0029.2024.02.004
|
| [36] |
Liu QY, Zhu WT, Zhu B, et al. (2021) Study on combustion characteristics of combustible liquids under high plateau airport environment. Fire Sci Technol 40: 613–616. https://doi.org/10.3969/j.issn.1009-0029.2021.05.003 doi: 10.3969/j.issn.1009-0029.2021.05.003
|


Figures(7) / Tables(1)
Weizhen Tang, Jie Dai, Zhousheng Huang. Comprehensive assessment of air pollutant and noise emissions at airports across different altitudes[J]. Metascience in Aerospace, 2024, 1(3): 292-308. doi: 10.3934/mina.2024013


 DownLoad: