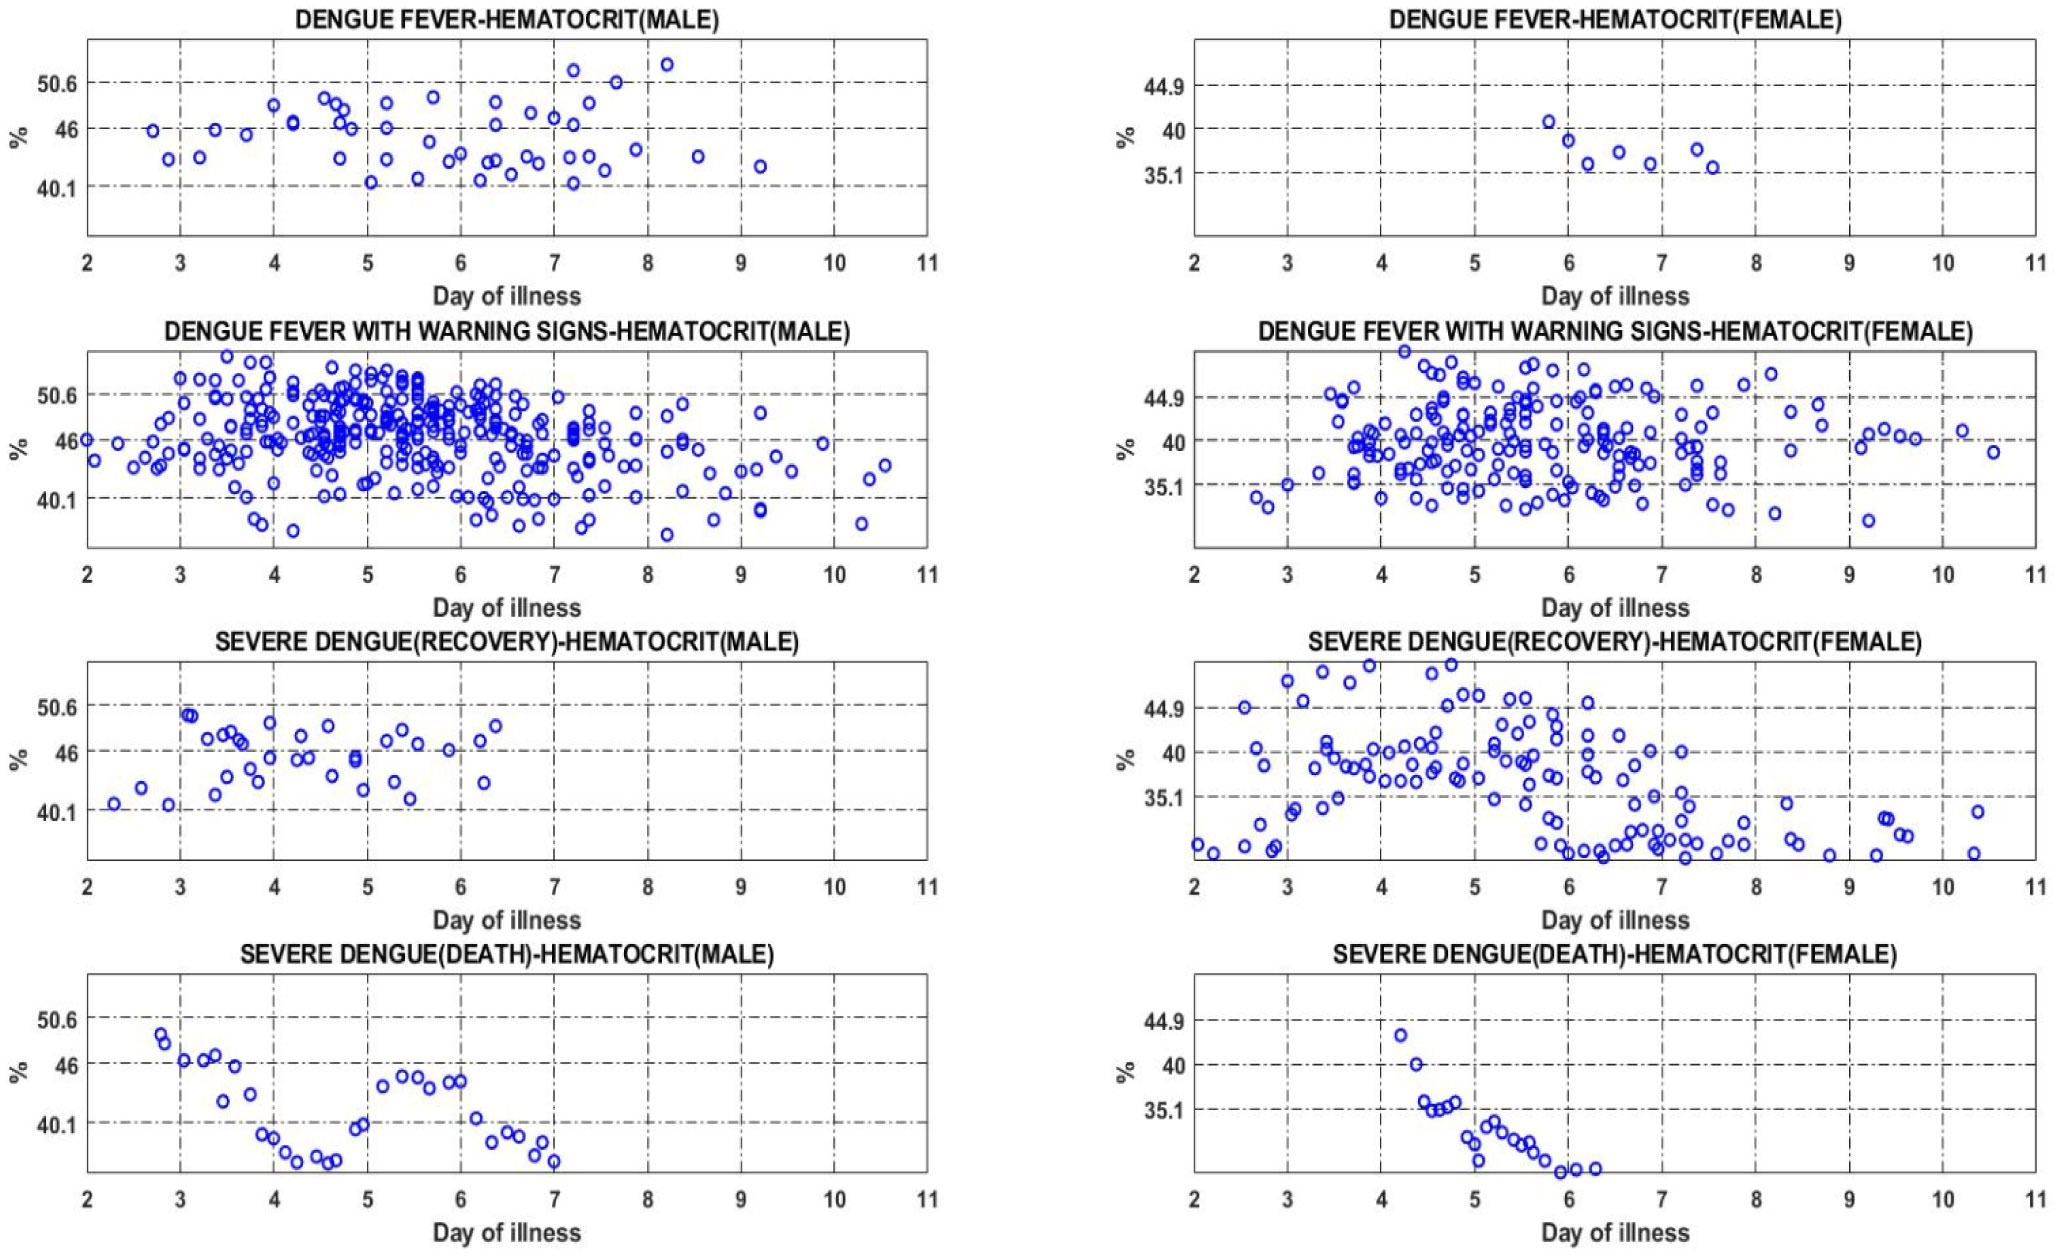
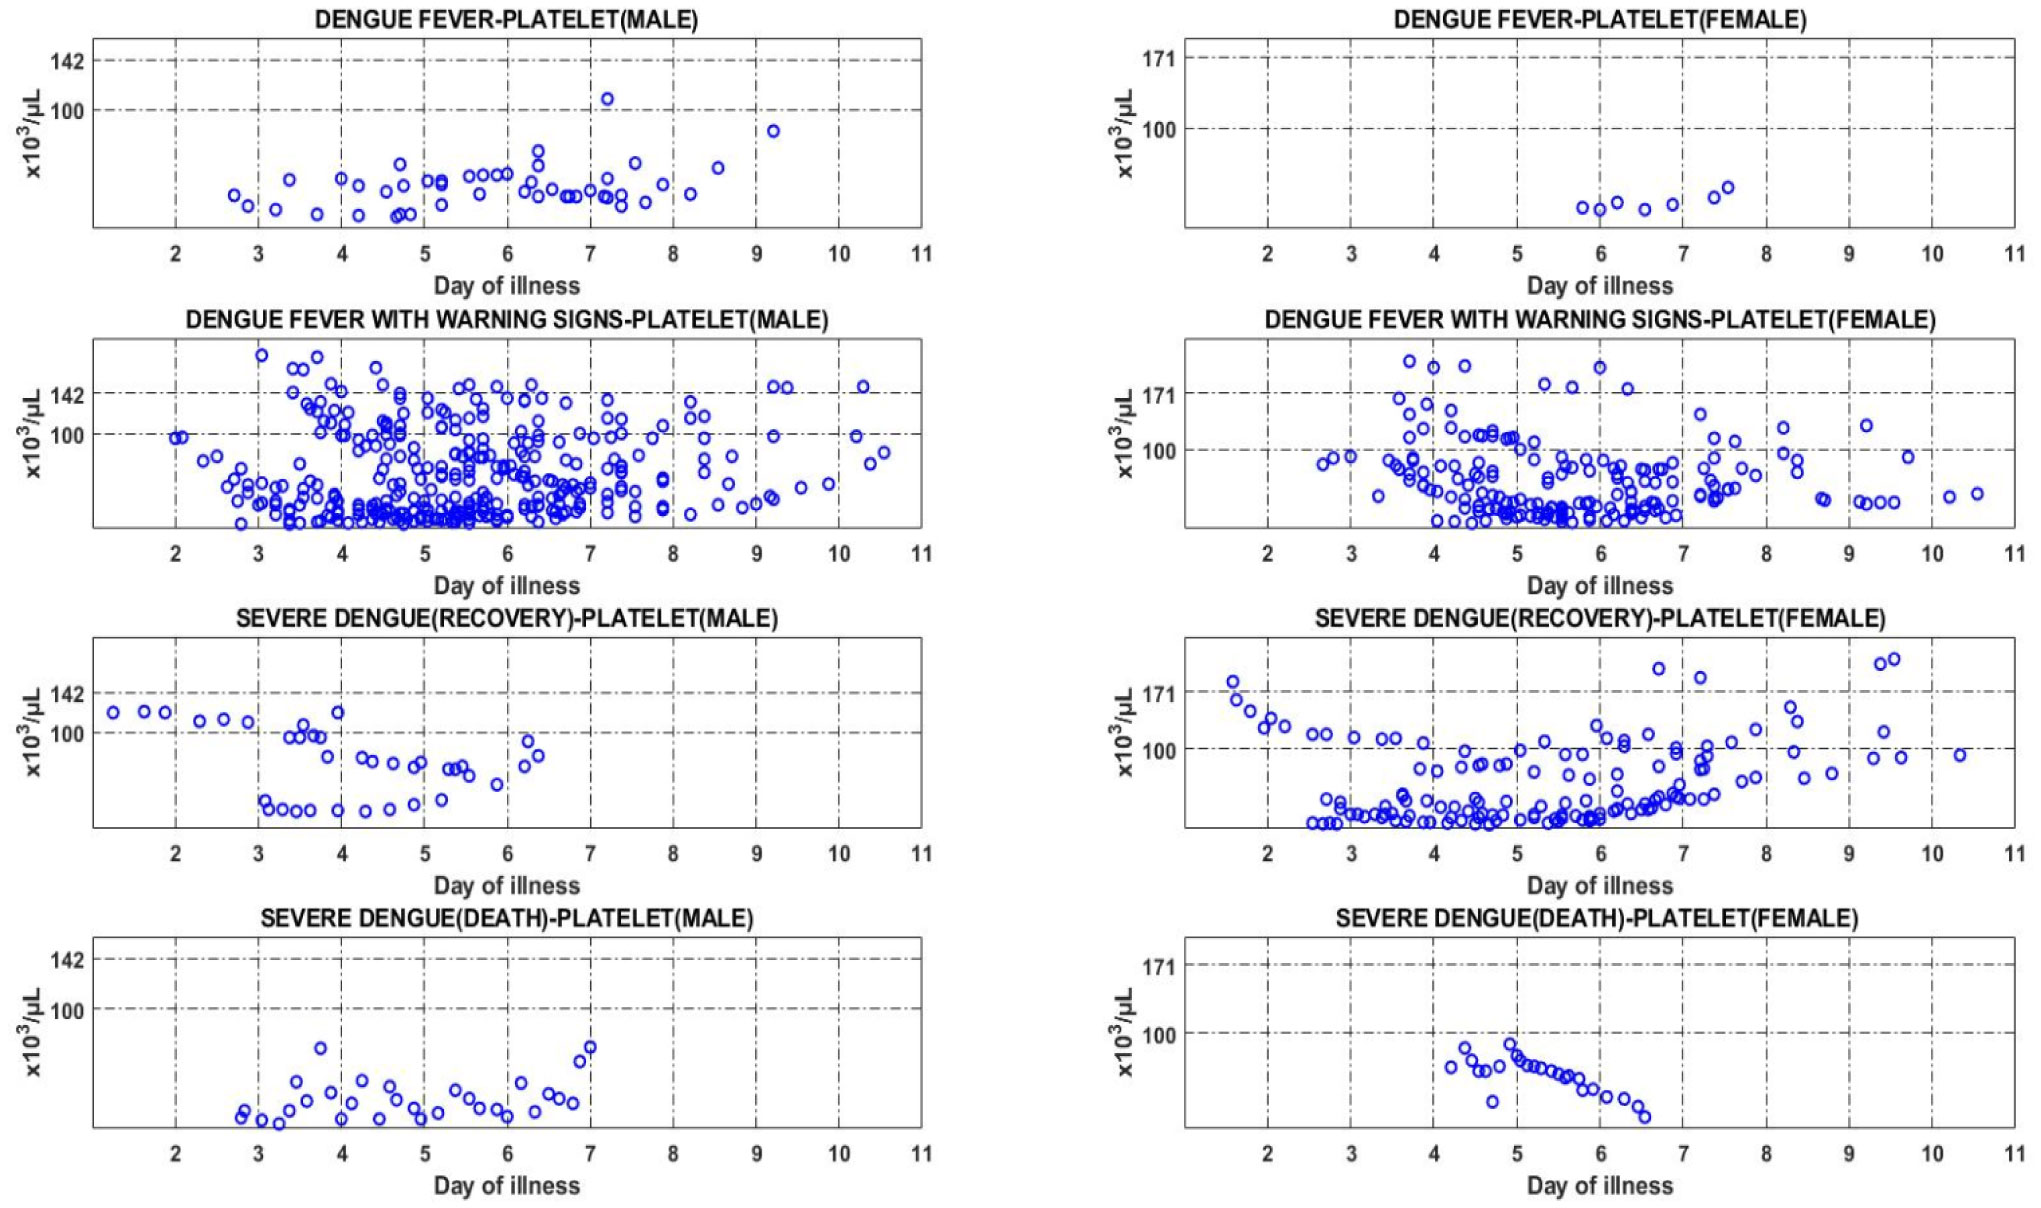
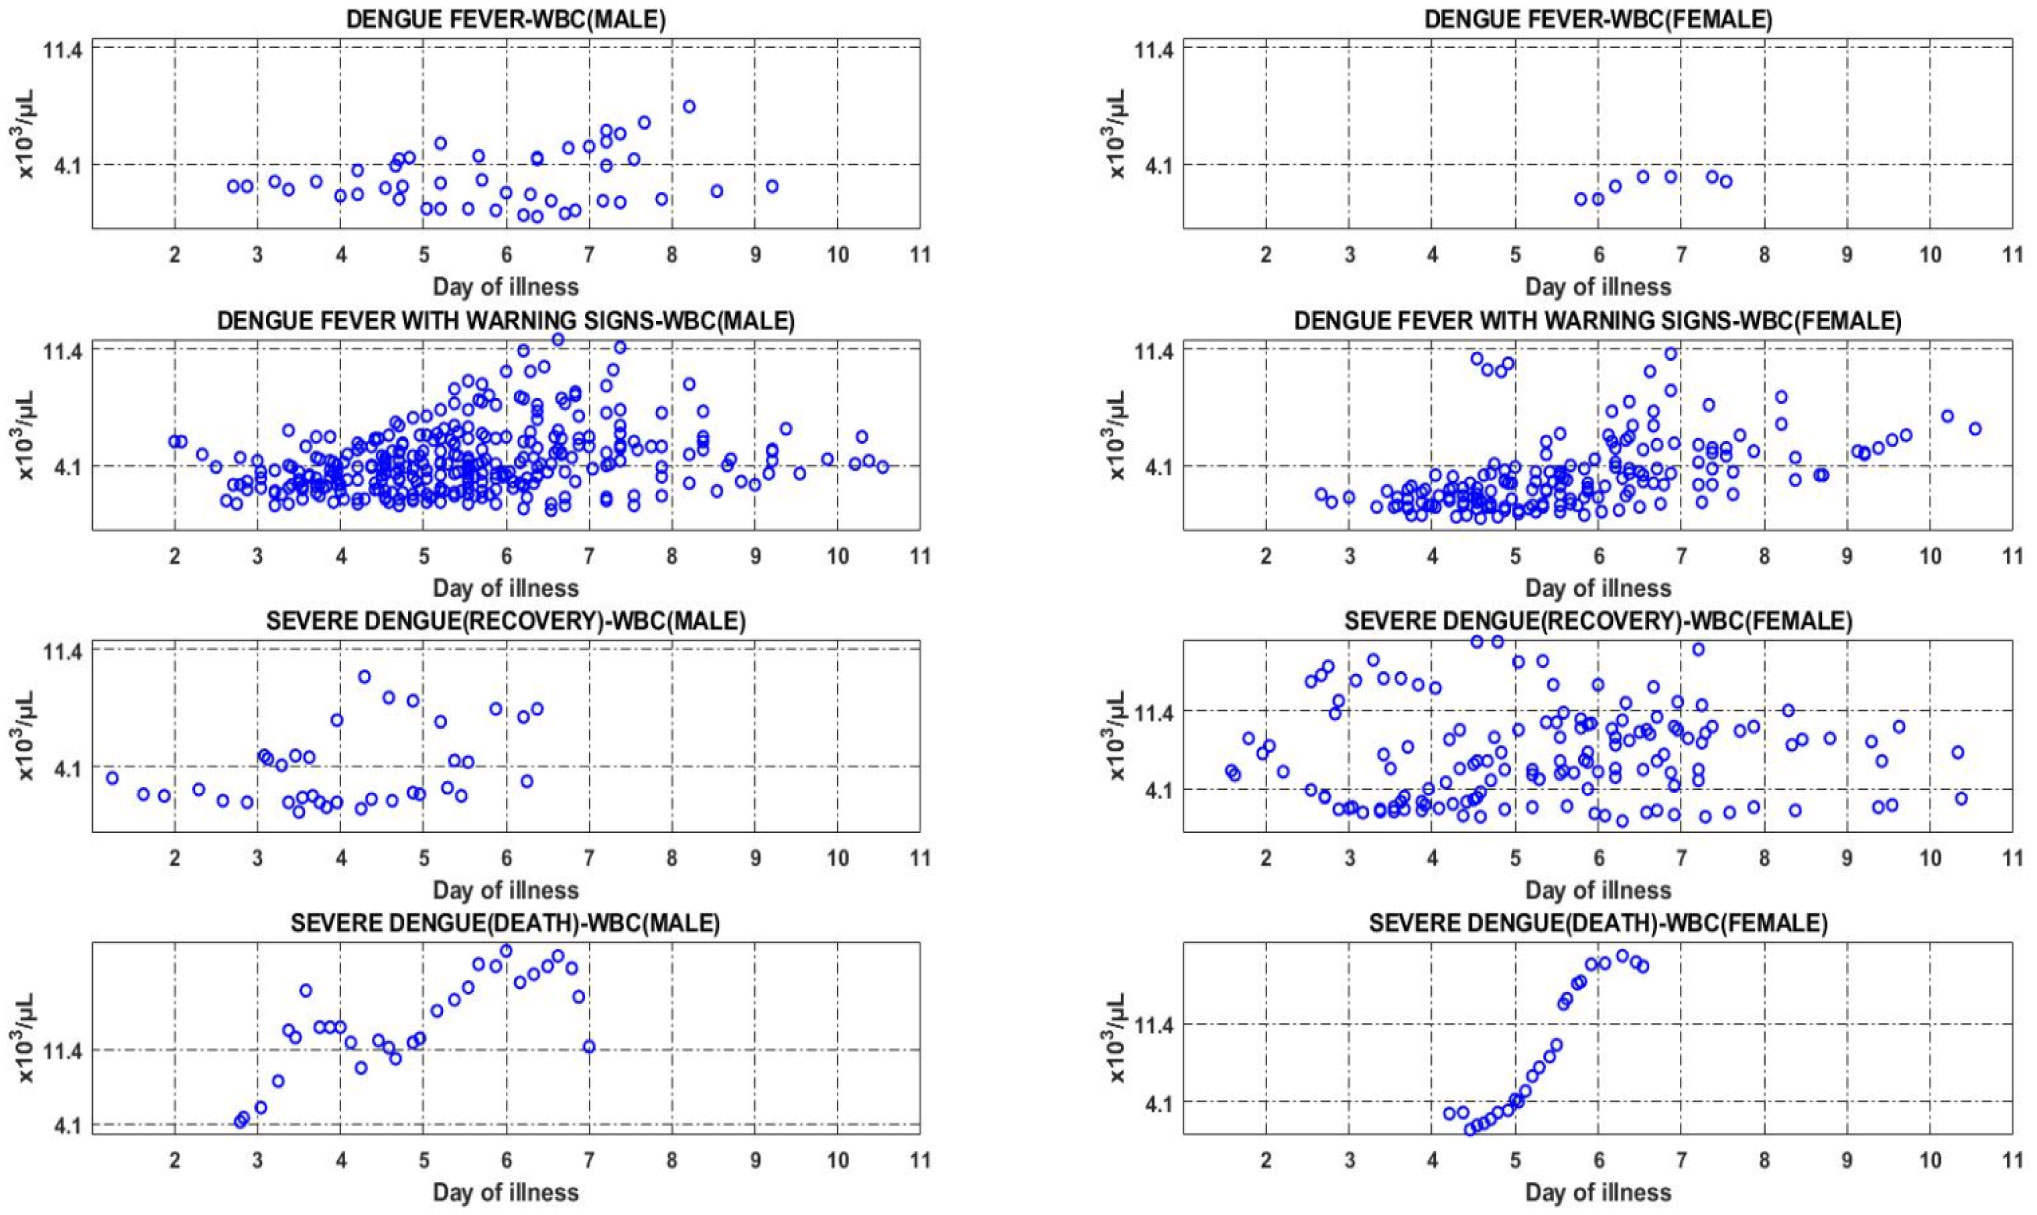
Monitoring clinical symptoms of dengue fever based on vital signs and blood profile in each phase of the disease is crucial for the early case detection, and the management of serious cases with adequate care minimizes dengue mortality. To assess changes in vital signs and blood profile in acute dengue infection, the vital signs and haematological parameters of 63 dengue patients were retrospectively analysed between day 3 and day 8 of illness. These patients visited the emergency department and were admitted to Canselor Tunku Muhriz Hospital, Pusat Perubatan Universiti Kebangsaan Malaysia between Jan 2015 and 2016; classification was done according to the World Health Organization and the Malaysian Clinical Practice Guidelines. The data were analysed using SPSS Version 23 and visualized with MATLAB R2020a based on the severity of dengue fever and day of illness. On day 3 of illness, there is a significant trend in heart rate of dengue patients of all categories, with a significant difference of p = 0.030. On day 4 of illness, there is a statistical difference in the platelet (p = 0.028) and white blood cell count (p = 0.019) of dengue female patients in the category with warning signs and severe dengue recovery. On the other hand, there is a significant difference in vital signs namely heart rate, body temperature and diastolic on day 5 of illness, with the p-value of 0.011, 0.019 and 0.016, respectively. On day 6 of dengue illness, there is a significant difference in the heart rate (p = 0.015), systolic (p = 0.006) and diastolic (p = 0.027) in dengue patients of all categories. A significant difference can only be observed in the heart rate (p = 0.011) of all patients and haematocrit (p = 0.023) of female patients on day 7 and 8 of illness, respectively. This paper reports the trend in key signs and blood profile of dengue patients classified according to the latest WHO case description, based on the day of illness.
Citation: Norhayati Mohd Zainee, Kalaivani Chellappan, Joseph Vehi, Petrick Periyasamy. The vital sign and haematological profile of adult dengue fever: a retrospective study[J]. AIMS Medical Science, 2021, 8(1): 56-69. doi: 10.3934/medsci.2021007
Monitoring clinical symptoms of dengue fever based on vital signs and blood profile in each phase of the disease is crucial for the early case detection, and the management of serious cases with adequate care minimizes dengue mortality. To assess changes in vital signs and blood profile in acute dengue infection, the vital signs and haematological parameters of 63 dengue patients were retrospectively analysed between day 3 and day 8 of illness. These patients visited the emergency department and were admitted to Canselor Tunku Muhriz Hospital, Pusat Perubatan Universiti Kebangsaan Malaysia between Jan 2015 and 2016; classification was done according to the World Health Organization and the Malaysian Clinical Practice Guidelines. The data were analysed using SPSS Version 23 and visualized with MATLAB R2020a based on the severity of dengue fever and day of illness. On day 3 of illness, there is a significant trend in heart rate of dengue patients of all categories, with a significant difference of p = 0.030. On day 4 of illness, there is a statistical difference in the platelet (p = 0.028) and white blood cell count (p = 0.019) of dengue female patients in the category with warning signs and severe dengue recovery. On the other hand, there is a significant difference in vital signs namely heart rate, body temperature and diastolic on day 5 of illness, with the p-value of 0.011, 0.019 and 0.016, respectively. On day 6 of dengue illness, there is a significant difference in the heart rate (p = 0.015), systolic (p = 0.006) and diastolic (p = 0.027) in dengue patients of all categories. A significant difference can only be observed in the heart rate (p = 0.011) of all patients and haematocrit (p = 0.023) of female patients on day 7 and 8 of illness, respectively. This paper reports the trend in key signs and blood profile of dengue patients classified according to the latest WHO case description, based on the day of illness.

| [1] |
Wang WH, Urbina AN, Chang MR, et al. (2020) Dengue hemorrhagic fever—a systemic literature review of current perspectives on pathogenesis, prevention and control. J Microbiol Immunol Infect 53: 963-978. doi: 10.1016/j.jmii.2020.03.007

|
| [2] |
Halstead S (2019) Recent advances in understanding dengue. F1000Research 8: 1-12. doi: 10.12688/f1000research.19197.1
|
| [3] |
Liew SM, Khoo EM, Ho BK, et al. (2016) Dengue in Malaysia : factors associated with dengue mortality from a national registry. PLoS One 11: e0157631. doi: 10.1371/journal.pone.0157631
|
| [4] | Kementerian Kesihatan Malaysia (KKM), Agensi Remote Sensing Malaysia (ARSM), Kementerian Sains Teknologi dan Inovasi (MOSTI) iDengue untuk Komuniti (2021) .Available from: https://idengue.mysa.gov.my/. |
| [5] | Clinical Practice Guidelines Management, Dengue Infection Adults CPG Management of Dengue Infection In Adults (Third Edition) 2015 (2015) .Available from: http://www.acadmed.org.my/view_file.cfm?fileid=756. |
| [6] |
Nascimento EJM, Huleatt JW, Cordeiro MT, et al. (2018) Development of antibody biomarkers of long term and recent dengue virus infections. J Virol Methods 257: 62-68. doi: 10.1016/j.jviromet.2018.04.009
|
| [7] | World Health Organization Dengue: guidelines for diagnosis, treatment, prevention, and control (2009) . |
| [8] |
Guzman MG, Harris E (2015) Dengue. Lancet 385: 453-465. doi: 10.1016/S0140-6736(14)60572-9
|
| [9] |
Choudhury J, Shastri DD (2014) Diagnosis and management of dengue in children: recommendations and IAP ID chapter plan of action. Pediatr Infect Dis 6: 54-62. doi: 10.1016/j.pid.2014.07.009
|
| [10] | World Health Organization Handbook for clinical management of dengue (2012) . |
| [11] |
Kuo HJ, Lee IK, Liu JW (2018) Analyses of clinical and laboratory characteristics of dengue adults at their hospital presentations based on the World Health Organization clinical-phase framework: emphasizing risk of severe dengue in the elderly. J Microbiol Immunol Infect 51: 740-748. doi: 10.1016/j.jmii.2016.08.024
|
| [12] |
Thomas L, Moravie V, Besnier F, et al. (2012) Clinical presentation of dengue among patients admitted to the adult emergency department of a tertiary care hospital in Martinique: implications for triage, management, and reporting. Ann Emerg Med 59: 42-50. doi: 10.1016/j.annemergmed.2011.08.010
|
| [13] |
Suwarto S, Nainggolan L, Sinto R, et al. (2016) Dengue score: a proposed diagnostic predictor for pleural effusion and/or ascites in adults with dengue infection. BMC Infect Dis 16: 1-7. doi: 10.1186/s12879-016-1671-3
|
| [14] | Mansour AI, Abu-naser SS (2019) Knowledge based system for the diagnosis of dengue disease. Int J Acad Heal Med Res 3: 12-19. |
| [15] |
Jayathilaka D, Gomes L, Jeewandara C, et al. (2018) Role of NS1 antibodies in the pathogenesis of acute secondary dengue infection. Nat Commun 9: 1-15. doi: 10.1038/s41467-018-07667-z
|
| [16] |
Cui L, Pang J, Lee YH, et al. (2018) Serum metabolome changes in adult patients with severe dengue in the critical and recovery phases of dengue infection. PLoS Negl Trop Dis 12: e0006217. doi: 10.1371/journal.pntd.0006217
|
| [17] | Lum LCS, Ng CJ, Khoo EM (2014) Managing dengue fever in primary care: a practical approach. Malaysian Fam Physician 9: 2-10. |
| [18] | Yacoub S, Wills B (2015) Dengue: an update for clinicians working in non-endemic areas. Clin Med J R Coll Physicians London 15: 82-85. |
| [19] |
Muller DA, Depelsenaire ACI, Young PR (2017) Clinical and laboratory diagnosis of dengue virus infection. J Infect Dis 215: S89-S95. doi: 10.1093/infdis/jiw649
|
| [20] | WHO Dengue clinical management: facilitator's training manual (2013) .Available from: https://iris.wpro.who.int/handle/10665.1/7841. |
| [21] |
Yacoub S, Wills B (2014) Predicting outcome from dengue. BMC Med 12: 147. doi: 10.1186/s12916-014-0147-9
|
| [22] |
Alfie J, Waisman GD, Galarza CR, et al. (1999) Contribution of stroke volume to the change in pulse pressure pattern with age. Hypertension 34: 808-812. doi: 10.1161/01.HYP.34.4.808
|
| [23] |
Lee VJ, Lye DC, Sun Y, et al. (2009) Decision tree algorithm in deciding hospitalization for adult patients with dengue haemorrhagic fever in Singapore. Trop Med Int Heal 14: 1154-1159. doi: 10.1111/j.1365-3156.2009.02337.x
|
| [24] |
Huy NT, Van Giang T, Thuy DHD, et al. (2013) Factors associated with dengue shock syndrome: a systematic review and meta-analysis. PLoS Negl Trop Dis 7: e2412. doi: 10.1371/journal.pntd.0002412
|
| [25] |
Anders KL, Nguyet NM, Chau NVV, et al. (2011) Epidemiological factors associated with dengue shock syndrome and mortality in hospitalized dengue patients in Ho Chi Minh City, Vietnam. Am J Trop Med Hyg 84: 127-134. doi: 10.4269/ajtmh.2011.10-0476
|
| [26] |
Pongpan S, Wisitwong A, Tawichasri C, et al. (2013) Development of dengue infection severity score. ISRN Pediatr 2013: 845876. doi: 10.1155/2013/845876
|
| [27] |
Hottz ED, Lopes JF, Freitas C, et al. (2013) Platelets mediate increased endothelium permeability in dengue through NLRP3-inflammasome activation. Blood 122: 3405-3414. doi: 10.1182/blood-2013-05-504449
|
| [28] | Srikiatkhachorn A (2017) HHS Public Access. Thromb Haemost 102: 1042-1049. |
| [29] | World Health Organization Dengue situation update 482 update on the dengue situation in the western pacific region (2015) .2014: 5. |
Figures(3) / Tables(4)

Norhayati Mohd Zainee, Kalaivani Chellappan, Joseph Vehi, Petrick Periyasamy. The vital sign and haematological profile of adult dengue fever: a retrospective study[J]. AIMS Medical Science, 2021, 8(1): 56-69. doi: 10.3934/medsci.2021007


 DownLoad: