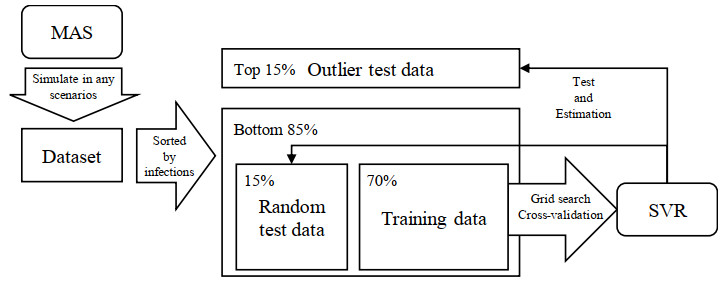
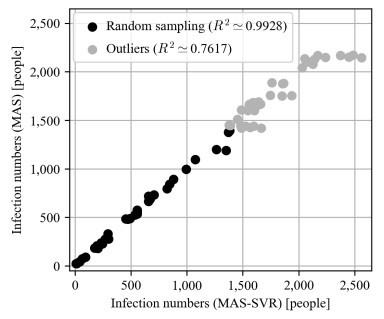
Due to the emergence of the novel coronavirus disease, many recent studies have investigated prediction methods for infectious disease transmission. This paper proposes a framework to quickly screen infection control scenarios and identify the most effective scheme for reducing the number of infected individuals. Analytical methods, as typified by the SIR model, can conduct trial-and-error verification with low computational costs; however, they must be reformulated to introduce additional constraints, and thus are inappropriate for case studies considering detailed constraint parameters. In contrast, multi-agent system (MAS) simulators introduce detailed parameters but incur high computation costs per simulation, making them unsuitable for extracting effective measures. Therefore, we propose a framework that implements an MAS for constructing a training dataset, and then trains a support vector regression (SVR) model to obtain effective measure results. The proposed framework overcomes the weaknesses of conventional methods to produce effective control measure recommendations. The constructed SVR model was experimentally verified by comparing its performance on datasets with expected and unexpected outputs. Although datasets producing an unexpected output decreased the prediction accuracy, by removing randomness from the training dataset, the accuracy of the proposed method was still high in these cases. High-precision predictions of the MAS-based simulation output were obtained for both test datasets in under one second of the computational time. Furthermore, the experimental results establish that the proposed framework can obtain intuitively correct outputs for unknown inputs, and produces sufficiently high-precision prediction with lower computation costs than an existing method.
Citation: Yohei Kakimoto, Yuto Omae, Jun Toyotani, Hirotaka Takahashi. Fast screening framework for infection control scenario identification[J]. Mathematical Biosciences and Engineering, 2022, 19(12): 12316-12333. doi: 10.3934/mbe.2022574
Due to the emergence of the novel coronavirus disease, many recent studies have investigated prediction methods for infectious disease transmission. This paper proposes a framework to quickly screen infection control scenarios and identify the most effective scheme for reducing the number of infected individuals. Analytical methods, as typified by the SIR model, can conduct trial-and-error verification with low computational costs; however, they must be reformulated to introduce additional constraints, and thus are inappropriate for case studies considering detailed constraint parameters. In contrast, multi-agent system (MAS) simulators introduce detailed parameters but incur high computation costs per simulation, making them unsuitable for extracting effective measures. Therefore, we propose a framework that implements an MAS for constructing a training dataset, and then trains a support vector regression (SVR) model to obtain effective measure results. The proposed framework overcomes the weaknesses of conventional methods to produce effective control measure recommendations. The constructed SVR model was experimentally verified by comparing its performance on datasets with expected and unexpected outputs. Although datasets producing an unexpected output decreased the prediction accuracy, by removing randomness from the training dataset, the accuracy of the proposed method was still high in these cases. High-precision predictions of the MAS-based simulation output were obtained for both test datasets in under one second of the computational time. Furthermore, the experimental results establish that the proposed framework can obtain intuitively correct outputs for unknown inputs, and produces sufficiently high-precision prediction with lower computation costs than an existing method.

| [1] |
J. M. Carcione, J. E. Santos, C. Bagaini, J. Ba, A simulation of a COVID-19 epidemic based on a deterministic SEIR model, Front. Public Health, 8 (2020), PMC7270399. https://doi.org/10.3389/fpubh.2020.00230 doi: 10.3389/fpubh.2020.00230

|
| [2] |
G. Barwolff, Mathematical modeling and simulation of the COVID-19 pandemic, Systems, 8 (2020), 24. https://doi.org/10.3390/systems8030024 doi: 10.3390/systems8030024
|
| [3] |
P. C. Silva, P. V. Batista, H. S. Lima, M. A. Alves, F. G. Guimaraes, R. C. Silva, COVID-ABS: An agent-based model of COVID-19 epidemic to simulate health and economic effects of social distancing interventions, Chaos, Solitons Fractals, 139 (2020), 110088. https://doi.org/10.1016/j.chaos.2020.110088 doi: 10.1016/j.chaos.2020.110088
|
| [4] |
Y. Wei, J. Wang, W. Song, C. Xiu, L. Ma, T. Pei, Spread of COVID-19 in China: analysis from a city-based epidemic and mobility model, Cities, 110 (2021), 103010. https://doi.org/10.1016/j.cities.2020.103010 doi: 10.1016/j.cities.2020.103010
|
| [5] | Y. Omae, Y. Kakimoto, J. Toyotani, K. Hara, Y. Gon, H. Takahashi, Reliability of multi-agent based infection simulator with parameters of isolation wards, ICIC Express Lett., Part B Appl., 12 (2021), 577–586. |
| [6] |
Y. Omae, Y. Kakimoto, J. Toyotani, K. Hara, Y. Gon, H. Takahashi, Impact of removal strategies of stay-at-home orders on the number of COVID-19 infectors and people leaving their homes, Int. J. Innovative Comput. Inf. Control, 17 (2021), 1055–1065. https://doi.org/10.24507/ijicic.17.03.1055 doi: 10.24507/ijicic.17.03.1055
|
| [7] |
Y. Omae, J. Toyotani, K. Hara, Y. Gon, H. Takahashi, Effectiveness of the COVID-19 contact-confirming application (COCOA) based on multi-agent simulation, J. Adv. Comput. Intell. Intell. Inf., 25 (2021), 931–943. https://doi.org/10.20965/jaciii.2021.p0931 doi: 10.20965/jaciii.2021.p0931
|
| [8] | W. O. Kermack, A. G. McKendrick, A contribution to the mathematical theory of epidemics, in Proceedings of the Royal of London. Society A, Containing Papers of a Mathematical and Physical Character, Seasonality and period-doubling bifurcations in an epidemic model, Royal Society, 115 (1927), 700–721. https://doi.org/10.1098/rspa.1927.0118 |
| [9] |
J. L. Aron, I. B. Schwartz, Seasonality and period-doubling bifurcations in an epidemic model, J. Theor. Biol., 110 (1984), 665–679. https://doi.org/10.1016/s0022-5193(84)80150-2 doi: 10.1016/s0022-5193(84)80150-2
|
| [10] |
I. Korolev, Identification and estimation of the SEIRD epidemic model for COVID-19, J. Econom., 220 (2021), 63–85. https://doi.org/10.1016/j.jeconom.2020.07.038 doi: 10.1016/j.jeconom.2020.07.038
|
| [11] |
J. Farooqa, M. A. Bazaz, A novel adaptive deep learning model of Covid-19 with focus on mortality reduction strategies, Chaos, Solitons Fractals, 138 (2020), 110148. https://doi.org/10.1016/j.chaos.2020.110148 doi: 10.1016/j.chaos.2020.110148
|
| [12] |
A. Sharma, S. Bahl, A. K. Bagha, M. Javaid, D. K. Shukla, A. Haleem, Multi-agent system applications to fight COVID-19 pandemic, Apollo Med., 17 (2020), 41–43. https://doi.org/10.4103/am.am_54_20 doi: 10.4103/am.am_54_20
|
| [13] | A. Badica, C. Badica, M. Ganzha, M. Ivanovic, M. Paprzycki, Multi-agent simulation of core spatial SIR models for epidemics spread in a population, in 2020 5th IEEE International Conference on Recent Advances and Innovations in Engineering (ICRAIE), IEEE, Jaipur, (2020), 1–7. https://doi.org/10.1109/ICRAIE51050.2020.9358293 |
| [14] |
Y. Vyklyuk, M. Manylich, M. Skoda, M. M. Radovanovic, M. D. Petrovic, Modeling and analysis of different scenarios for the spread of COVID-19 by using the modified multi-agent systems–-Evidence from the selected countries, Results Phys., 20 (2021), 103662. https://doi.org/10.1016/j.rinp.2020.103662 doi: 10.1016/j.rinp.2020.103662
|
| [15] | H. Hirose, Pandemic simulations by made: A combination of multi-agent and differential equations, with novel influenza A (H1N1) case, Information, 16 (2013), 5365–5390. |
| [16] | B. E. Boser, I. Guyon, V. N. Vapnik, A training algorithm for optimal margin classifiers, in Proceedings of the Fifth Annual Workshop of Computational Learning Theory, ACM, Pittsburgh, (1992), 144–152. https://doi.org/10.1145/130385.130401 |
| [17] |
C. Cortes, V. Vapnik, Support-vector networks, Mach. Learn., 20 (1995), 273–297. https://doi.org/10.1007/BF00994018 doi: 10.1007/BF00994018
|
| [18] | D. Basak, S. Pal, D. C. Patranabis, Support vector regression, Neural Inf. Process. Lett. Rev., 11 (2007), 203–224. |
| [19] | M. Awad, K. Rahul, Efficient Learning Machines, 1st edition, Apress, Berkeley, 2015. |
| [20] |
B. Scholkopf, A. J. Smola, R. C. Williamson, P. L. Bartlett, New support vector algorithms, Neural Comput., 12 (2000), 1207–1245. https://doi.org/10.1162/089976600300015565 doi: 10.1162/089976600300015565
|
| [21] |
J. Feng, L. Liu, D. Wu, G. Li, M. Beer, W. Gao, Dynamic reliability analysis using the extended support vector regression (X-SVR), Mech. Syst. Sig. Process., 126 (2019), 368–391. https://doi.org/10.1016/j.ymssp.2019.02.027 doi: 10.1016/j.ymssp.2019.02.027
|
| [22] |
S. Liu, T. Yamamoto, Role of stay-at-home requests and travel restrictions in preventing the spread of COVID-19 in Japan, Transp. Res. Part A Policy Pract., 159 (2022), 1–16. https://doi.org/10.1016/j.tra.2022.03.009 doi: 10.1016/j.tra.2022.03.009
|
| [23] |
L. Silva, D. F. Filho, A. Fernandes, The effect of lockdown on the COVID-19 epidemic in Brazil: evidence from an interrupted time series design, Cad. Saude Publica, 36 (2020), https://doi.org/10.1590/0102-311x00213920 doi: 10.1590/0102-311x00213920
|
| [24] | J. H. Fowler, S. J. Hill, R. Levin, N. Obradovich, The effect of stay-at-home orders on COVID-19 cases and fatalities in the United States, preprint, medRxiv, 2020.04.13.20063628. https://doi.org/10.1101/2020.04.13.20063628 |
| [25] | P. Drineas, M. W. Mahoney, Approximating a gram matrix for improved kernel-based learning, in Lecture Notes in Computer Science (including subseries Lecture Notes in Artificial Intelligence and Lecture Notes in Bioinformatics), 3559 (2005), 323–337. https://doi.org/10.1007/11503415_22 |
| [26] | M. Tohme, R. Lengelle, {F-SVR}: {A} new learning algorithm for support vector regression, in IEEE International Conference on Acoustics, Speech and Signal Processing-Proceedings (ICASSP), 2008. https://doi.org/10.1109/ICASSP.2008.4518032 |
| [27] |
P. Y. Hao, Pair-v-SVR: A novel and efficient pairing nu-support vector regression algorithm, IEEE Trans. Neural Networks Learn. Syst., 28 (2017), 2503–2515. https://doi.org/10.1109/TNNLS.2016.2598182 doi: 10.1109/TNNLS.2016.2598182
|
| [28] | P. M. Dunuwila, R. A. Rajapakse, Evaluating optimal lockdown and testing strategies for COVID-19 using multi-agent social simulation, in 2020-2nd International Conference on Advancements in Computing (ICAC), (2020), 240–245. https://doi.org/10.1109/ICAC51239.2020.9357132 |
| [29] |
H. Kaneko, K. Funatsu, Fast optimization of hyperparameters for support vector regression models with highly predictive ability, Chemom. Intell. Lab. Syst., 142 (2015), 64–69. https://doi.org/10.1016/j.chemolab.2015.01.001 doi: 10.1016/j.chemolab.2015.01.001
|
Figures(8) / Tables(3)

Yohei Kakimoto, Yuto Omae, Jun Toyotani, Hirotaka Takahashi. Fast screening framework for infection control scenario identification[J]. Mathematical Biosciences and Engineering, 2022, 19(12): 12316-12333. doi: 10.3934/mbe.2022574


 DownLoad: