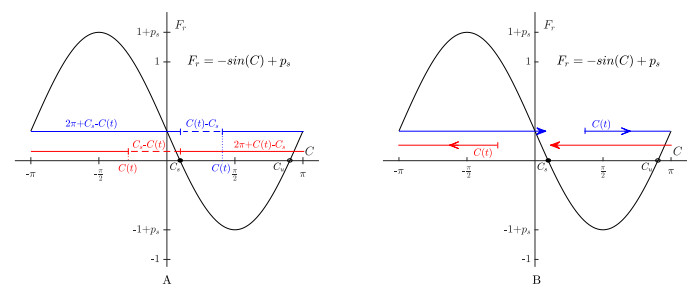
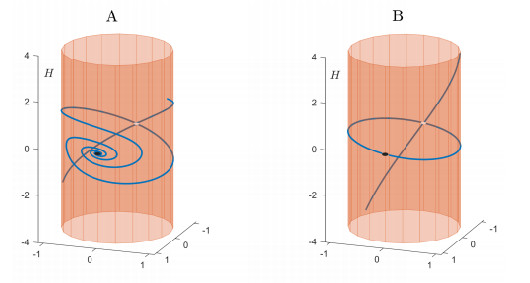
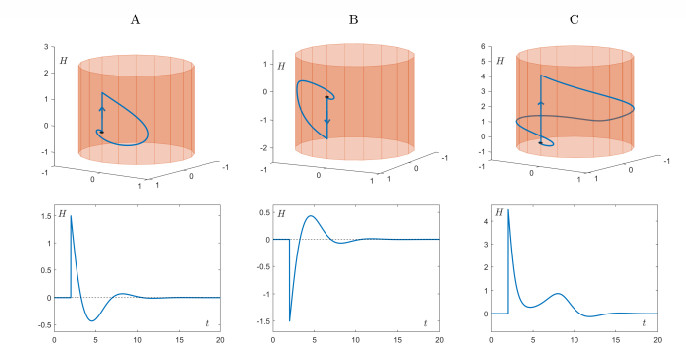
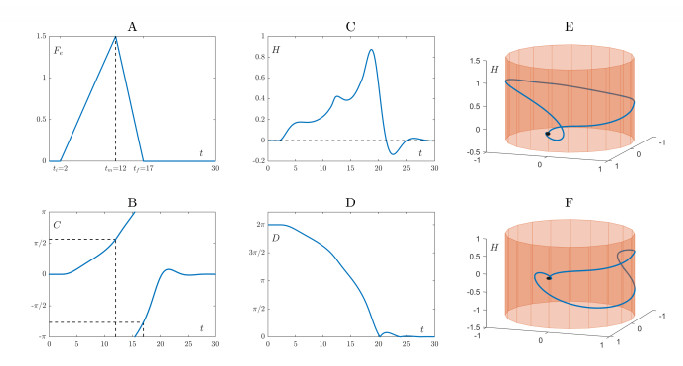
Positive psychology recognizes happiness as a construct comprising hedonic and eudaimonic well-being dimensions. Integrating these components and a set of theory-led assumptions, we propose a mathematical model, given by a system of nonlinear ordinary differential equations, to describe the dynamics of a person's happiness over time. The mathematical model offers insights into the role of emotions for happiness and why we struggle to attain sustainable happiness and tread the hedonic treadmill oscillating around a relative stable level of well-being. The model also indicates that lasting happiness may be achievable by developing constant eudaimonic emotions or human altruistic qualities that overcome the limits of the homeostatic hedonic system; in mathematical terms, this process is expressed as distinct dynamical bifurcations. This mathematical description is consistent with the idea that eudaimonic well-being is beyond the boundaries of hedonic homeostasis.
Citation: Gustavo Carrero, Joel Makin, Peter Malinowski. A mathematical model for the dynamics of happiness[J]. Mathematical Biosciences and Engineering, 2022, 19(2): 2002-2029. doi: 10.3934/mbe.2022094
Positive psychology recognizes happiness as a construct comprising hedonic and eudaimonic well-being dimensions. Integrating these components and a set of theory-led assumptions, we propose a mathematical model, given by a system of nonlinear ordinary differential equations, to describe the dynamics of a person's happiness over time. The mathematical model offers insights into the role of emotions for happiness and why we struggle to attain sustainable happiness and tread the hedonic treadmill oscillating around a relative stable level of well-being. The model also indicates that lasting happiness may be achievable by developing constant eudaimonic emotions or human altruistic qualities that overcome the limits of the homeostatic hedonic system; in mathematical terms, this process is expressed as distinct dynamical bifurcations. This mathematical description is consistent with the idea that eudaimonic well-being is beyond the boundaries of hedonic homeostasis.

| [1] |
R. M. Ryan, E. L. Deci, On happiness and human potentials: A review of research on hedonic and eudaimonic well-being, Annu. Rev. Psychol., 52 (2001), 141–166. doi: 10.1146/annurev.psych.52.1.141. doi: 10.1146/annurev.psych.52.1.141

|
| [2] | V. Huta, Eudaimonia, in The Oxford Handbook of Happiness, Oxford University Press, Oxford, (2013), 201–213. doi: 10.1093/oxfordhb/9780199557257.013.0015. |
| [3] |
V. Huta, A. Waterman, Eudaimonia and its distinction from hedonia: Developing a classification and terminology for understanding conceptual and operational definitions, J. Happiness Stud., 15 (2014), 1425–1456. doi: 10.1007/s10902-013-9485-0. doi: 10.1007/s10902-013-9485-0
|
| [4] | C. P. Niemiec, R. M. Ryan, What makes for a life well lived? Autonomy and its relation to full functioning and organismic wellness, in The Oxford Handbook of Happiness, Oxford University Press, Oxford, (2013), 214–226. doi: 10.1093/oxfordhb/9780199557257.013.0016. |
| [5] | K. Hefferon, I. Boniwell, Positive psychology: Theory, Research And Applications, Open University Press, England, 2011. |
| [6] | F. F. Miao, M. Koo, S. Oishi, Subjective well-being, in The Oxford Handbook of Happiness, Oxford University Press, Oxford, (2013), 174–184. doi: 10.1093/oxfordhb/9780199557257.013.0013. |
| [7] | J. C. Sprott, Dynamical models of happiness, Nonlinear Dyn. Psychol. Life Sci., 9 (2005), 23–36. |
| [8] |
M. E. P. Seligman, M. Csikszentmihalyi, Positive psychology: An introduction, Am. Psychol., 55 (2000), 5–14. doi: 10.1037/0003-066X.55.1.5. doi: 10.1037/0003-066X.55.1.5
|
| [9] |
J. Vittersø, Y. Søholt, A. Hetland, I. A. Thoresen, E. Røysamb, Was hercules happy? some answers from a functional model of human well-being, Soc. Indic. Res., 95 (2010), 1–18. doi: 10.1007/s10902-013-9485-0. doi: 10.1007/s10902-013-9485-0
|
| [10] | S. A. David, I. Boniwell, A. C. Ayers, Introdution, in The Oxford Handbook of Happiness, Oxford University Press, Oxford, (2013), 1–8. doi: 10.1093/oxfordhb/9780199557257.013.0001. |
| [11] | J. Vittersø, The feeling of excellent functioning: Hedonic and eudaimonic emotions, in Handbook of Eudaimonic Well-Being, Springer International Publishing, Switzerland, (2016), 253–276. doi: 10.1007/978-3-319-42445-3_17. |
| [12] |
C. S. Carver, M. F. Scheier, Origins and functions of positive and negative affect: A control-process view, Psychol. Rev., 97 (1990), 19–35. doi: 10.1037/0033-295X.97.1.19. doi: 10.1037/0033-295X.97.1.19
|
| [13] | A. Campbell, P. E. Converse, W. L. Rodgers, The quality of American life: Perceptions, evaluations, and satisfactions, Russell Sage Foundation, New York, NY, 1976. |
| [14] | A. C. Michalos, Measuring the quality of life, in Values and the Quality of life, Science History Publications, New York, NY, 1976, 24–37. |
| [15] |
R. Veenhoven, Is happiness relative?, Soc. Indic. Res., 24 (1991), 1–34. doi: 10.1007/BF00292648. doi: 10.1007/BF00292648
|
| [16] | R. A. Cummins, Measuring happiness and subjective well-being, in The Oxford Handbook of Happiness (eds. S. A. David, I. Boniwell and A. C. Ayers), Oxford University Press, Oxford, (2013), 185–200. doi: 10.1093/oxfordhb/9780199557257.013.0014. |
| [17] | A. Schopenhauer, The World as Will and Representation, Dover Publications, New York, 1966. |
| [18] |
D. G. Myers, E. Diener, Who is happy?, Psychol. Sci., 6 (1995), 10–19. doi: 10.1111/j.1467-9280.1995.tb00298.x. doi: 10.1111/j.1467-9280.1995.tb00298.x
|
| [19] |
B. L. Fredrickson, The role of positive emotions in positive psychology: The broaden-and-build theory of positive emotions, Am. Psychol., 56 (2001), 218–226. doi: 10.1037/0003-066X.56.3.218. doi: 10.1037/0003-066X.56.3.218
|
| [20] |
B. L. Fredrickson, T. Joiner, Positive emotions trigger upward spirals toward emotional well-being, Psychol. Sci., 13 (2002), 172–175. doi: 10.1111/1467-9280.00431. doi: 10.1111/1467-9280.00431
|
| [21] |
D. Watson, L. A. Clark, A. Tellegen, Development and validation of brief measures of positive and negative affect: the panas scales, J. Pers. Soc. Psychol., 54 (1988), 1063–1070. doi: 10.1037/0022-3514.54.6.1063. doi: 10.1037/0022-3514.54.6.1063
|
| [22] | E. Diener, The Science of Wellbeing: The Collected Works of Ed Diener, Springer, New York, NY, 2009. doi: 10.1007/978-90-481-2350-6. |
| [23] | B. L. Fredrickson, Positivity: Groundbreaking Research Reveals how to Embrace the Hidden Strength of Positive Emotions, Overcome Negativity, and Thrive, Crown Publishers, New York, NY, 2009. |
| [24] | S. Frederick, G. Loewenstein, Hedonic adaptation, in Well-being: The Foundations of Hedonic Psychology, Russell Sage Foundation, New York, NY, (1999), 302–329. |
| [25] | S. Lyubomirsky, Hedonic adaptation to positive and negative experiences, in Oxford Handbook of Stress, Health and Coping, Oxford University Press, US, (2010), 200–224. doi: 10.1093/oxfordhb/9780195375343.013.0011. |
| [26] |
R. A. Cummins, Subjective wellbeing, homeostatically protected mood and depression: A synthesis, J. Happiness Stud., 11 (2010), 1–17. doi: 10.1007/s10902-009-9167-0. doi: 10.1007/s10902-009-9167-0
|
| [27] | A. J. Crum, P. Salovey, Emotionally intelligent happiness, in The Oxford Handbook of Happiness, Oxford University Press, Oxford, (2013), 73–87. doi: 10.1093/oxfordhb/9780199557257.013.0006. |
| [28] | S. L. Beaumont, Contentment, in The Encyclopedia of Positive Psychology, Blackwell Publishing Ltd, Chichester, (2009), 231–232. doi: 10.1002/9781444306002.ch3. |
| [29] | MATLAB, R2019b, The MathWorks Inc., Natick, Massachusetts, 2019. |
| [30] | J. D. Meiss, Differential Dynamical Systems, SIAM, Philadenphia, 2007. |
| [31] |
M. Levi, F. C. Hoppensteadt, W. L. Miranker, Dynamics of the Josephson junction, Q. Appl. Math., 36 (1978), 167–198. doi: 10.1090/qam/484023. doi: 10.1090/qam/484023
|
| [32] | J. Guckenheimer, P. Holmes, Nonlinear Oscillations, Dynamical Systems, and Bifurcations of Vector Fields, Springer-Verlag, New York, 1983. doi: 10.1007/978-1-4612-1140-2. |
| [33] | S. H. Strogatz, Nonlinear Dynamics and Chaos: With Applications to Physics, Biology, Chemistry and Engineering, Perseus Books, Massachusetts, 1994. |
| [34] |
P. Coullet, J. M. Gilli, M. Monticelli, N. Vanderberghe, A damped pendulum forced with a constant torque, Am. J. Phys., 73 (2005), 1–8. doi: 10.1119/1.2074027. doi: 10.1119/1.2074027
|
| [35] |
E. Siedlecka, T. F. Denson, Experimental methods for inducing basic emotions: A qualitative review, Emot. Rev., 11 (2019), 87–97. doi: 10.1177/1754073917749016. doi: 10.1177/1754073917749016
|
| [36] |
K. Wall, A. Kalpakci, K. Hall, N. Crist, C. Sharp, An evaluation of the construct of emotional sensitivity from the perspective of emotionally sensitive peoples, Border. Pers. Dis. Emot. Dysregulation, 5 (2018), 1–9. doi: 10.1186/s40479-018-0091-y. doi: 10.1186/s40479-018-0091-y
|
| [37] | R. A. Cummins, E. Gullone, A. L. D. Lau, A model of subjective well-being homeostasis: The role of personality, in The Universality of Subjective Wellbeing Indicators: A Multi-disciplinary and Multi-national Perspective, Springer Netherlands, Dordrecht, (2002), 7–46. doi: 10.1007/978-94-010-0271-4_3. |
| [38] |
R. Cummins, R. Eckersley, J. Pallant, J. Vugt, R. Misajon, Developing a national index of subjective wellbeing: The Australian unity wellbeing index, Soc. Indic. Res., 64 (2003), 159–190. doi: 10.1023/A:1024704320683. doi: 10.1023/A:1024704320683
|
| [39] | J. J. Gross, Emotion regulation: Conceptual and empirical foundations, in Handbook of Emotion Regulation, The Guilford Press, New York, NY, (2014), 3–20. |
| [40] | O. Nydahl, Happiness, in from buddhism to science and back, Hung, Opole & ITAS, Vélez-Málaga, 2007. |
| [41] |
M. Damdrun, M. Ricard, Self-centeredness and selflessness: A theory of self-based psychological functioning and its consequences for happiness, Rev. Gen. Psychol., 15 (2011), 138–157. doi: 10.1037/a0023059. doi: 10.1037/a0023059
|
| [42] | M. F. Scheier, C. Carver, Optimism, in The Encyclopedia of Positive Psychology, Blackwell Publishing Ltd., Chichester, (2009), 656–663. doi: 10.1002/9781444306002.ch15. |
Figures(7)

Gustavo Carrero, Joel Makin, Peter Malinowski. A mathematical model for the dynamics of happiness[J]. Mathematical Biosciences and Engineering, 2022, 19(2): 2002-2029. doi: 10.3934/mbe.2022094


 DownLoad: