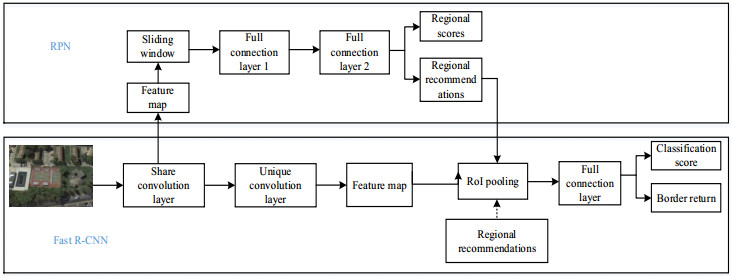
In a national power grid system, it is necessary to keep transmission lines secure. Detection and identification must be regularly performed for transmission tower components. In this paper, we propose a defect recognition method for key components of transmission lines based on deep learning. First, based on the characteristics of the transmission line image, the defect images are preprocessed, and the defect dataset is created. Then, based on the TensorFlow platform and the traditional Faster R-CNN based on the R-CNN model, the concept-ResNet-v2 network is used as the basic feature extraction network to improve the network structure adjustment and parameter optimization. Through feature extraction, target location, and target classification of aerial transmission line defect images, a target detection model is obtained. The model improves the feature extraction on transmission line targets and small target component defects. The experimental results show that the proposed method can effectively identify the defects of key components of the transmission lines with a high accuracy of 98.65%.
Citation: Hongxia Ni, Minzhen Wang, Liying Zhao. An improved Faster R-CNN for defect recognition of key components of transmission line[J]. Mathematical Biosciences and Engineering, 2021, 18(4): 4679-4695. doi: 10.3934/mbe.2021237
In a national power grid system, it is necessary to keep transmission lines secure. Detection and identification must be regularly performed for transmission tower components. In this paper, we propose a defect recognition method for key components of transmission lines based on deep learning. First, based on the characteristics of the transmission line image, the defect images are preprocessed, and the defect dataset is created. Then, based on the TensorFlow platform and the traditional Faster R-CNN based on the R-CNN model, the concept-ResNet-v2 network is used as the basic feature extraction network to improve the network structure adjustment and parameter optimization. Through feature extraction, target location, and target classification of aerial transmission line defect images, a target detection model is obtained. The model improves the feature extraction on transmission line targets and small target component defects. The experimental results show that the proposed method can effectively identify the defects of key components of the transmission lines with a high accuracy of 98.65%.

| [1] | J. Sun, Research on insulator crack diagnosis based on edge detection, North China Electric Power University, 2008. |
| [2] | Y. Zhai, Y. Wu, H. Chen, A method of insulator detection from aerial images, Sen. Tra., 7 (2014), 1726-5479. |
| [3] | X. Chen, Y. Wu, L. Zhao, OPGW anti-vibration hammer identification based on random Hough transform, Heilongjiang Electric Power., 32 (2010), 1-2. |
| [4] |
V. S. Murthy, S. Gupta, Digital image processing approach using combined wavelet hidden markov model for well-being analysis of insulators, Iet Image Process., 5 (2011), 171-183. doi: 10.1049/iet-ipr.2009.0293

|
| [5] | T. Zheng, Research on segmentation and positioning of aerial insulator images based on PCNN, Dalian Maritime University, 2011. |
| [6] | L. Jin, S. Yan, Y. Liu, Anti-vibration hammer identification based on HAAR-like features and cascaded AdaBoost algorithm, J. Simul., 24 (2012), 1806-1809. |
| [7] |
K. Cui, B. Li, J. Yuan, An improved unit-linking PCNN for segmentation of infrared insulator image, App. Mat. Inf. Enc., 8 (2014), 2997-3004. doi: 10.12785/amis/080638
|
| [8] | M. Oberweger, A. Wendel, H. Bischof, Visual recognition and fault detection for power line insulators, 19th Computer Vision Winter Workshop, 2014. |
| [9] | F. Zhang, Recognition and research of abnormal inspection map of transmission line based on computer vision, Jilin University, 2015. |
| [10] | X. Miao, Identification and damage detection of catenary insulators based on image processing, Southwest Jiaotong University, 2017. |
| [11] | S. Wang, Research on detection algorithm of anti-vibration hammer on transmission line image, Beijing Jiaotong University, 2017. |
| [12] | W. Wang, B. Tian, Y. Liu, L. Liu, J. Li, Research on recognition of power widgets in UAV inspection images based on RCNN, J. GEO-INF., 19 (2017), 256-263. |
| [13] | C. Hou, H. Zhang, W. Zhang, Y. Yang, G. Zhang, Z. Tian, Identification method of transmission line insulator self-explosion defects, J. Electron. Syst. Autom., 2019. |
| [14] | S. Wei, S. Huang, W. Cao, X. Xi, P. Wang, Transmission line insulator recognition and defect detection based on aerial image, Eng. Invest., 48 (2020), 39-43. |
| [15] | X. Xiong, S. Xu, D. Meng, X. Wei, D. Tu, W. Wu, Research on transmission line defect recognition model based on faster R-CNN, Autom. Instrument., 2020. |
| [16] | R. Girshick, Fast R-CNN, Proceedings of the IEEE international conference on computer vision, (2015), 1440-1448. |
| [17] |
S. Ren, K. He, R. Girshick, J. Sun, Faster R-CNN: Towards real-time object detection with region proposal networks, IEEE T. Pattern Anal., 39 (2017), 1137-1149. doi: 10.1109/TPAMI.2016.2577031
|
| [18] | C. Szegedy, V. Vanhouck, S. Ioffe, J. Shlens, Z. Wojna, Inception-v4, inception-ResNet and the impact of residual connections on learning, arXiv: 1602.07261. |
| [19] | C. Szegedy, V. Vanhoucke, S. Ioffe, J. Shlens, Rethinking the inception architecture for computer vision, Proceedings of the IEEE Conference on Computer Vision and Pattern Recognition, (2016), 2818-2826. |
| [20] |
M. J. Bharata, R. Meyur, D. Pal, An on-line geographical information system-based condition monitoring system for 11-kv distribution line insulator, IEEE Electr. Insul. M., 33 (2017), 26-32. doi: 10.1109/MEI.2017.7906160
|
| [21] | K. He, X. Zhang, S. Ren, J. Sun, Deep residual learning for image recognition, Proc. IEEE/CVF Conf. Comput. Vis. Pattern Recognit., 2016. |


Figures(15) / Tables(5)

Hongxia Ni, Minzhen Wang, Liying Zhao. An improved Faster R-CNN for defect recognition of key components of transmission line[J]. Mathematical Biosciences and Engineering, 2021, 18(4): 4679-4695. doi: 10.3934/mbe.2021237


 DownLoad: