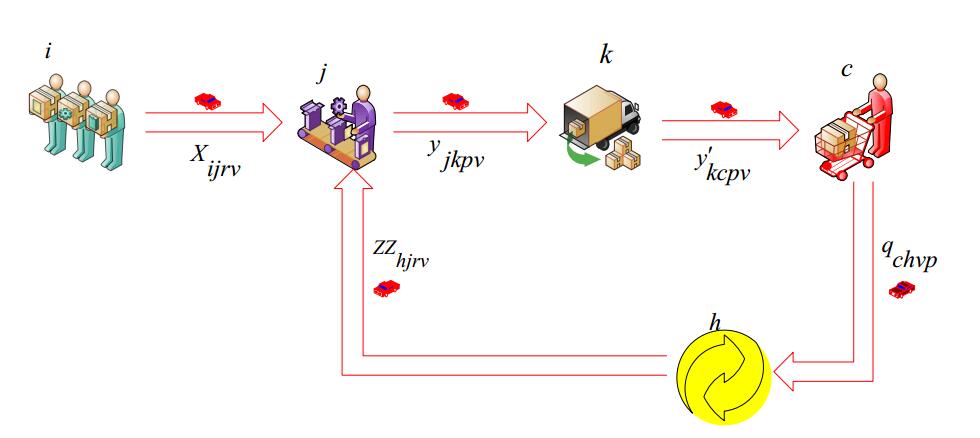
In the modern era, uncertainty is a common feature of modeling techniques for designing sustainable supply chains. The increasing severity of environmental issues necessitates the integration of sustainable production in supply chain management. The present study aims to develop mathematical models and intelligent sustainable supply chains with uncertain parameters and algorithms. The goal is to design a sustainable and eco-friendly model that minimizes environmental contaminants and system costs. This descriptive-analytical study employs a novel hybrid technique to manage the uncertainty associated with the model parameters, research problems, and problem complexity, and tackle large-scale problems. The automotive industry was selected to implement the mathematical model. These combined techniques consider the disruption-induced capacity reduction and the uncertainties surrounding shipping costs and demand. Results suggest that hybrid models and techniques are efficient in solving large-scale problems and delivering high-quality processing. Further, the findings show that heuristic solutions can significantly reduce computation time for larger problems.
Citation: Massoumeh Nazari, Mahmoud Dehghan Nayeri, Kiamars Fathi Hafshjani. Developing mathematical models and intelligent sustainable supply chains by uncertain parameters and algorithms[J]. AIMS Mathematics, 2024, 9(3): 5204-5233. doi: 10.3934/math.2024252
In the modern era, uncertainty is a common feature of modeling techniques for designing sustainable supply chains. The increasing severity of environmental issues necessitates the integration of sustainable production in supply chain management. The present study aims to develop mathematical models and intelligent sustainable supply chains with uncertain parameters and algorithms. The goal is to design a sustainable and eco-friendly model that minimizes environmental contaminants and system costs. This descriptive-analytical study employs a novel hybrid technique to manage the uncertainty associated with the model parameters, research problems, and problem complexity, and tackle large-scale problems. The automotive industry was selected to implement the mathematical model. These combined techniques consider the disruption-induced capacity reduction and the uncertainties surrounding shipping costs and demand. Results suggest that hybrid models and techniques are efficient in solving large-scale problems and delivering high-quality processing. Further, the findings show that heuristic solutions can significantly reduce computation time for larger problems.

| [1] | A. Azar, D. Andalib Ardakani, P. Keshavarz, The principles of sustainable supply chain management (in Persian), Yazd University Publications, Yazd, 2017. |
| [2] |
M. Vafaee, M. Momeni, E. Teimouri, A. Jafarnejad, Designing a sustainable supply Chain model for project companies: the case of pars garma industrial and constructional company, J. Prod. Manage., 15 (2021), 217–241. https://doi.org/10.30495/qjopm.2021.1865870.2420 doi: 10.30495/qjopm.2021.1865870.2420

|
| [3] |
J. Li, P. Liu, Modeling green supply chain games with governmental interventions and risk preferences under fuzzy uncertainties, Math. Comput. Simul., 192 (2022), 182–200. https://doi.org/10.1016/j.matcom.2021.08.020 doi: 10.1016/j.matcom.2021.08.020
|
| [4] | P. Kim, MATLAB deep learning with machine learning, With Machine Learning, Neural Networks and Artificial Intelligence, CA: Apress Berkeley, 2017. https://doi.org/10.1007/978-1-4842-2845-6 |
| [5] |
E. Darvishi, T. Kordestani, Multi-objective optimization of water scheduling in irrigation canal network using NSGA-Ⅱ, J. Appl. Res. Water Wastewater, 6 (2019), 95–99. https://doi.org/10.22126/arww.2020.1358 doi: 10.22126/arww.2020.1358
|
| [6] |
W. Wang, Y. Zhang, W. Zhang, G. Gao, H. Zhang, Incentive mechanisms in a green supply chain under demand uncertainty, J. Clean. Prod., 279 (2021), 123636. https://doi.org/10.1016/j.jclepro.2020.123636 doi: 10.1016/j.jclepro.2020.123636
|
| [7] |
M. M. Vali-Siar, E. Roghanian, Sustainable, resilient and responsive mixed supply chain network design under hybrid uncertainty with considering COVID-19 pandemic disruption, Sustain. Prod. Consump., 30 (2022), 278–300. https://doi.org/10.1016/j.spc.2021.12.003 doi: 10.1016/j.spc.2021.12.003
|
| [8] |
F. A. Hashim, E. H. Houssein, K. Hussain, M. S. Mabrouk, W. Al-Atabany, Honey Badger Algorithm: new metaheuristic algorithm for solving optimization problems, Math. Comput. Simul., 192 (2022), 84–110. https://doi.org/10.1016/j.matcom.2021.08.013 doi: 10.1016/j.matcom.2021.08.013
|
| [9] |
H. Yang, L. Li, Y. Liu, The effect of manufacturing intelligence on green innovation performance in China, Tecnol. Forecast. Soc. Change, 178 (2022), 1211569. https://doi.org/10.1016/j.techfore.2022.121569 doi: 10.1016/j.techfore.2022.121569
|
| [10] |
Z. Homayouni, M. S. Pishvaee, H. Jahani, D. Ivanov, A robust-heuristic optimization approach to a green supply chain design with consideration of assorted vehicle types and carbon policies under uncertainty, Ann. Oper. Res., 324 (2023), 395–435. https://doi.org/10.1007/s10479-021-03985-6 doi: 10.1007/s10479-021-03985-6
|
| [11] |
N. Foroozesh, B. Karimi, S. M. Mousavi, Green-resilient supply chain network design for perishable products considering route risk and horizontal collaboration under robust interval-valued type-2 fuzzy uncertainty: a case study in food industry, J. Environ. Manage., 307 (2022), 114470. https://doi.org/10.1016/j.jenvman.2022.114470 doi: 10.1016/j.jenvman.2022.114470
|
| [12] |
K. Govindan, H. Mina, A. Esmaeili, S. M. Gholami-Zanjani, An integrated hybrid approach for circular supplier selection and closed loop supply chain network design under uncertainty, J. Clean. Prod., 242 (2020), 118317. https://doi.org/10.1016/j.jclepro.2019.118317 doi: 10.1016/j.jclepro.2019.118317
|
| [13] |
Y. G. Durmaz, B. Bilgen, Multi-objective optimization of sustain-able biomass supply chain network design, Appl. Energy, 272 (2020), 115259. https://doi.org/10.1016/j.apenergy.2020.115259 doi: 10.1016/j.apenergy.2020.115259
|
| [14] |
J. E. Santibañez-Aguilar, S. Castellanos, A. Flores-Tlacuahuac, B. B. Shapiro, D. M. Powell, T. Buonassisi, et al., Design of domestic photovoltaics manufacturing systems under global constraints and uncertainty, Renew. Energy, 148 (2020), 1174–1189. https://doi.org/10.1016/j.renene.2019.10.010 doi: 10.1016/j.renene.2019.10.010
|
| [15] |
C. Franco, E. Alfonso-Lizarazo, Optimization under uncertainty of the pharmaceutical supply chain in hospitals, Comput. Chem. Eng., 135 (2020), 106689. https://doi.org/10.1016/j.compchemeng.2019.106689 doi: 10.1016/j.compchemeng.2019.106689
|
| [16] |
H. Gholizadeh, H. Fazlollahtabar, M. Khalilzadeh, A robust fuzzy stochastic programming for sustainable procurement and logistics under hybrid uncertainty using big data, J. Clean. Prod., 258 (2020), 120640. https://doi.org/10.1016/j.jclepro.2020.120640 doi: 10.1016/j.jclepro.2020.120640
|
| [17] | A. Azar, M. Farrokh, Mathematical programming under uncertainty: stochastic, fuzzy and robust approaches (in Persian), 2 Eds., Institute for Research and Development in the Humanities, Tehran, 2018. |
| [18] |
J. M. Mulvey, R. J. Vanderbei, S. A. Zenios, Robust optimization of large-scale systems, Oper. Res., 43 (1995), 199–374. https://doi.org/10.1287/opre.43.2.264 doi: 10.1287/opre.43.2.264
|
| [19] |
C. S. Yu, H. L. Li, A robust optimization model for stochastic logistic problems, Int. J. Prod. Econ., 64 (2000), 385–397. https://doi.org/10.1016/S0925-5273(99)00074-2 doi: 10.1016/S0925-5273(99)00074-2
|


Figures(17) / Tables(5)

Massoumeh Nazari, Mahmoud Dehghan Nayeri, Kiamars Fathi Hafshjani. Developing mathematical models and intelligent sustainable supply chains by uncertain parameters and algorithms[J]. AIMS Mathematics, 2024, 9(3): 5204-5233. doi: 10.3934/math.2024252


 DownLoad: