Thanks to high dissipation properties, embedding NiTi Shape Memory Alloys in passive damping devices is effective to mitigate vibrations in building and cable structures. These devices can inconceivably be tested directly on full-scale experimental structures or on structures in service. To predict their effectiveness and optimize the set-up parameters, numerical tools are more and more developed. Most of them consist of Finite Element models representing the structure equipped with the damping device, embedding parts associated with a superelastic behavior. Generally, the implemented behavior laws do not include all the phenomena at the origin of strain energy dissipation, but stress-induced martensitic transformation only. This article presents a thermomechanical behavior law including the following phenomena: (i) intermediate R-phase transformation, (ii) thermal effects and (iii) strain localization. This law was implemented in a commercial Finite Element code to study the dynamic response of a bridge cable equipped with a NiTi wire-based damping device. The numerical results were compared to full-scale experimental ones, by considering the above-mentioned phenomena taken coupled or isolated: it has been shown that it is necessary to take all of these phenomena into account in order to successfully predict the damping capacity of the device.
Citation: Helbert Guillaume, Dieng Lamine, Chirani Shabnam Arbab, Pilvin Philippe. Influence of the thermomechanical behavior of NiTi wires embedded in a damper on its damping capacity: Application to a bridge cable[J]. AIMS Materials Science, 2023, 10(1): 1-25. doi: 10.3934/matersci.2023001
Related Papers:
[1]
Tolga Zaman, Cem Kadilar .
Exponential ratio and product type estimators of the mean in stratified two-phase sampling. AIMS Mathematics, 2021, 6(5): 4265-4279.
doi: 10.3934/math.2021252
[2]
Riffat Jabeen, Aamir Sanaullah, Muhammad Hanif, Azam Zaka .
Two-exponential estimators for estimating population mean. AIMS Mathematics, 2021, 6(1): 737-753.
doi: 10.3934/math.2021045
Xuechen Liu, Muhammad Arslan .
A general class of estimators on estimating population mean using the auxiliary proportions under simple and two phase sampling. AIMS Mathematics, 2021, 6(12): 13592-13607.
doi: 10.3934/math.2021790
[5]
Khazan Sher, Muhammad Ameeq, Muhammad Muneeb Hassan, Basem A. Alkhaleel, Sidra Naz, Olyan Albalawi .
Novel efficient estimators of finite population mean in stratified random sampling with application. AIMS Mathematics, 2025, 10(3): 5495-5531.
doi: 10.3934/math.2025254
[6]
Saman Hanif Shahbaz, Aisha Fayomi, Muhammad Qaiser Shahbaz .
Estimation of the general population parameter in single- and two-phase sampling. AIMS Mathematics, 2023, 8(7): 14951-14977.
doi: 10.3934/math.2023763
[7]
Amber Yousaf Dar, Nadia Saeed, Moustafa Omar Ahmed Abu-Shawiesh, Saman Hanif Shahbaz, Muhammad Qaiser Shahbaz .
A new class of ratio type estimators in single- and two-phase sampling. AIMS Mathematics, 2022, 7(8): 14208-14226.
doi: 10.3934/math.2022783
[8]
Anoop Kumar, Renu Kumari, Abdullah Mohammed Alomair .
Optimal classes of memory-type estimators of population mean for temporal surveys. AIMS Mathematics, 2025, 10(1): 1008-1025.
doi: 10.3934/math.2025048
[9]
Sohaib Ahmad, Sardar Hussain, Muhammad Aamir, Faridoon Khan, Mohammed N Alshahrani, Mohammed Alqawba .
Estimation of finite population mean using dual auxiliary variable for non-response using simple random sampling. AIMS Mathematics, 2022, 7(3): 4592-4613.
doi: 10.3934/math.2022256
[10]
Sohaib Ahmad, Sardar Hussain, Javid Shabbir, Muhammad Aamir, M. El-Morshedy, Zubair Ahmad, Sharifah Alrajhi .
Improved generalized class of estimators in estimating the finite population mean using two auxiliary variables under two-stage sampling. AIMS Mathematics, 2022, 7(6): 10609-10624.
doi: 10.3934/math.2022592
Abstract
Thanks to high dissipation properties, embedding NiTi Shape Memory Alloys in passive damping devices is effective to mitigate vibrations in building and cable structures. These devices can inconceivably be tested directly on full-scale experimental structures or on structures in service. To predict their effectiveness and optimize the set-up parameters, numerical tools are more and more developed. Most of them consist of Finite Element models representing the structure equipped with the damping device, embedding parts associated with a superelastic behavior. Generally, the implemented behavior laws do not include all the phenomena at the origin of strain energy dissipation, but stress-induced martensitic transformation only. This article presents a thermomechanical behavior law including the following phenomena: (i) intermediate R-phase transformation, (ii) thermal effects and (iii) strain localization. This law was implemented in a commercial Finite Element code to study the dynamic response of a bridge cable equipped with a NiTi wire-based damping device. The numerical results were compared to full-scale experimental ones, by considering the above-mentioned phenomena taken coupled or isolated: it has been shown that it is necessary to take all of these phenomena into account in order to successfully predict the damping capacity of the device.
1.
Introduction
The use of survey sampling is useful in solving real world problems in the field of environmental changes, engineering, management and biological sciences. For instance, environmental sampling is a key tool to verify sources of pollution and adequacy of hygiene process, refining the frequency and intensity of cleaning and sanitation, identifying problem areas, food safety validation programs, and to give an early cautioning of issues that may require remedial action. Sampling can be conducted to characterize background radiological levels, determine the concentration of radionuclides and make recommendations on environmental surveillance for agricultural products. Over all, it gives the confirmation that product being made will be made under clean conditions.
In case of forming travelling patterns of a certain city residents it is hard to approach every person of the city and ask the information on their travel pattern. A sample data is gathered and based on that information the developers try to understand the travel behavior of residents. Likewise, when choosing the trademark quality of cement, of a specific blend, data resulting from the tests on a sample is used. Similarly, a sample of borehole information is used to find quality soil. The sample is representative of population in all the cases and while doing so the representative ability of the sample data must be ensured statistically.
Velasco-Muñoz, et al. [1] reviewed 25 years of researches on sustainable water use in farming. A bibliometric examination was established to sample 2084 published articles from 1993 to 2017. Results showed that sustainable water used for agriculture attained exponential growth and has turned into a worldwide issue. Serbu, et al. [2] collected water samples from four different locations beside the Cibin River over a time of a year and applied Multiple-Criteria Decision Analysis strategies for the surveying the effect of toxins on the earth.
Ziemer, et al. [3] discussed that how data is collected and in what way the sample of electrical engineering departments is evolved that is used as database. De Mello, et al. [4] proposed theoretical framework that contributes to strengthen representativeness of their outcomes, though some key problems concerning survey study are still open and deserve attention from Software Engineering community. De Mello, et al. [5] described the heterogeneity and members who repeatedly contributed to increase the strength of survey’s results. Consequently, De Mello and Travassos [5] believed that sharing of this experience, questionnaire and idea can be helpful for scientists interested on executing surveys on broader scale in Software Engineering.
The information retrieved from auxiliary variables has resulted in wide ranging gain in performance over estimators which don’t take such information. When the auxiliary variable X is available in advance or observed easily and high correlation exists with study variable Y, the use of auxiliary information is effective to estimate population mean. In these situations ratio, regression and product estimators are good examples to use. Estimation method of regression was used by Watson [6] to estimate the mean area of leaves on plant. Cochran [7] proposed ratio method in case of strong positive correlation existence between Y and X (study and auxiliary variables). Murthy [8] revisited the idea given by Robson [9] that product method of estimation is appropriate if strong negative correlation exits between auxiliary and study variables. Srivastava [10] proposed the general ratio estimator using a single auxiliary variable and given that population information on this variable is not available. Exponential smoothing is one of the forecast methods to recognize substantial changes in data by incorporating the most recent information. Given that there are numerous different approaches to make forecasts, exponential smoothing is significantly easy to learn, forecasts accurately, and its application to recent observations gives this technique an edge over others.
Bahl, et al. [11] proposed exponential product estimator when study variable and auxiliary variable are negatively correlated and exponential ratio estimator, in case of positive correlation, exists between Y and X. Numerous authors including Srivastava [10], Hidiroglou [12], Samiuddin, et al. [13], Singh, et al. [14], Singh, et al. [15], Hanif, et al. [16], Hanif, et al. [17], Singh, et al. [18], Singh, et al. [19], Noor-ul-Amin, et al. [20], Tailor, et al. [21] and Shabbir, et al. [22] have also proposed improved ratio and product for estimating the population average of study variable. Al-Marshadi, et al. [23] suggested estimator for estimating population variance by using multi auxiliary variables.
Generally, ratio and product estimators are less efficient than the linear regression estimator when it passes through the origin. It is observed, in most of the situations, that the regression line does not pass through the origin. Considering this fact, Vishwakarma, et al. [24] proposed the ratio product type estimator to improve the performance of Singh and Espejo [14] estimator using two auxiliary variables under two phase sampling.
Vishwakarma, et al. [25] proposed generalized class of estimators by using the information of multi-auxiliary variables in two-phase sampling scheme and claimed that their generalized class of estimators performed well over the Dash, et al. [26] proposed class of estimators.
Mishra, et al. [27] used log function and proposed a ln-product type estimator for estimating the mean value of study variable Y. Akhlaq, et al. [28] proposed an exponential estimator, which is most efficient than the previous estimators for estimating the process variability by using auxiliary information.
To estimate the population mean, considering the N population units D=(D1,D2,D3..........DN), Let yi and (xi,zi) be the values of study variable (Y) and auxiliary variables (X,Y) respectively. Population averages are ˉY=N−1N∑i=1YiandˉX=N−1N∑i=1Xi where ˉY is the population mean of study variable and ˉX is population mean of auxiliary variable.
Auxiliary information in two-phase sampling proves to be effective in estimating the population mean. The first phase estimates the population variable X (auxiliary) in such a manner that when information of the auxiliary variable is not available, it then evaluates the second phase. The first phase sample selection is known as the primary sample, which is comprised of n1(n1<N) units. We select a sample from ‘N’ units by applying simple random sampling without replacement (SRSWR) technique in the first phase. In some situations, another auxiliary variable (Z) is helpful for obtaining the information of the first auxiliary variable X and both the variables are observed in the first phase sample.
The essential information is estimated in first phase for the auxiliary variable X before moving into the second phase. With the assistance of the auxiliary variable X, the population mean ˉY of Y is estimated in second phase. To serve this purpose, another sample of SRSWR is sorted out from a primary sample of n2 units (n2<n1) Singh, et al. [29]. The sample size n1 from the population ‘N’ is a primary sample. The sample n2 from n1 is a subsample of our study.
The classical ratio estimator of population mean ˉY under double sampling scheme is given by Cochran [30] as:
ˉYr=(ˉy2(ˉx2)−1ˉx1);ˉx2≠0
(1.1)
where ˉy=n−1n∑i=1yiandˉx=n−1n∑i=1xi
Upadhyaya, et al. [31] used available information of coefficient of variation (Cz) and coefficient of kurtosis (β2(z)) from auxiliary variable and proposed estimator for estimating study variable ˉY as:
ˉYUS=ˉy(ˉx′ˉx)(CzˉZ+β2(Z)Czˉz′+β2(Z))
(1.2)
The MSE of [31] estimator up to the order o(n)−1 as:
The coefficient of variation X is Cx=sx(ˉX)−1 , Y is Cy=sy(ˉY)−1 and Z is Cz=sz(ˉZ)−1 while correlation coefficient of (Y,X) is ρyx=sxy(sxsy)−1, is (Y,Z)ρyz=syz(sysz)−1 and (X,Z) is ρxz=sxz(sxsz)−1.
The estimators given above are used for estimating mean of study variable in different conditions. The main purpose of this article is to suggest an improved exponential estimator of ratio type and explores its properties. A ln function and two auxiliary variables are used with in proposed estimator and discussed in following section. Third section is comprised of mathematical illustration of suggested estimator and it’s comparison with some existing estimators ˉY,ˉYS,ˉYSV,ˉYNHandˉYSA. In section four empirical study is carried out while conclusion is being discussed in last section.
2.
Materials and method
Motivated by Cekim, et al. [35], who proposed ratio estimator using ln function for estimation of population variance, We propose a new estimator by combining the exponential and ln ratio terms using the information of two auxiliary variables Z and X in two-phase sampling for estimating population mean ˉY . Let n1 and n2<n1 be the sample sizes of first and second phase respectively, while an unbiased estimator of ˉZ be ˉz1∗=(NˉZ−n1ˉz(1))/(NˉZ−n1ˉz(1))(N−n1)(N−n1) , as suggested by Bandyopadhyay [36] and Srivenkataramana [37]. The proposed estimator is given as:
where θ1 , θ2 are optimization constants and are used to minimize the mean square error while ˉz∗ introduces as transformed variable. The “ln” function has been introduced to control the variability of ratio for first and second phase variables while exponential function on ratio of transformed variables also helps to reduce the estimator’s mean square errors. The properties of the propose estimator can be studied by considering
ˉy=(ˉY+ey),ˉx=(ˉX+ex)andˉz=(ˉZ+ez)
Putting ˉy=(ˉY+ey),ˉx=(ˉX+ex)andˉz=(ˉZ+ez) and ˉz∗1 in Eq (2.1), we get
2.1. Comparing mathematically ˉYg(1)∗∗ with some existed estimators
In this section, we compared our proposed estimator ˉYg(1)∗∗ with some of existed estimators. The comparison has been made in terms of the mean square errors and we have obtained some conditions under which our proposed estimator has smaller minimum MSE as compared to some already existing estimators. These comparisons are:
If the above given expressions are not met then estimators ˉY,ˉYS,ˉYSV,ˉYNHandˉYSA are more efficient than the suggested estimator ˉYg(1)∗∗.
3.
Results
In this section some real populations available in literature have been selected for empirical study to obtain mean square error and relative efficiency of our proposed estimator ˆˉYg(1)∗∗. For checking the performance of suggested estimator the following real data sets have been used.
Sugar Cane Disease “coal of sugar-cane” (This is a disease that is common in sugar-cane plantations in certain areas of Brazil)
Soil Compositions of Physical and Chemical Characteristics
Appliances energy prediction Data Set
Ozone (The data is monthly ozone averages on a very coarse 24 by 24 grid covering Central America, from Jan 1995 to Dec 2000)
Combined Cycle Power Plant Data Set (The voltage output of engines was measured at various combinations of blade speed and sensor extension)
The comparison of our suggested estimator has been made with the conventional unbiased estimators ˉY,ˉYS,ˉYSV,ˉYNHandˉYSA . The depiction of variables for each population is given below:
Table 1.
Description of variables.
Pop.
Y
X
Z
Populations Sources
1
The number of pieces of the stems, out of 50, planted in each plot.
The number of diseased shoots.
The total number of shoots in each plot.
The data were kindly supplied by Dr. C.G.B. Demetrio of Escola Superior de Agricultura, Universidade de Sao Paolo, Brazil
2
Conductivity
Magnesium in me/100gm
Bulk density in gm
Khattree, R., and Naik, D. N. (2000) Multivariate Data Reduction and Discrimination with SAS Software. SAS Institute.
3
Random variable non-dimensional
Pressure (from Chievres weather station), in mm Hg
Humidity outside (from Chievres weather station)
University of Mons (UMONS).
4
Ozone
Radiation
Temperature
Bruntz, S. M., W. S. Cleveland, B. Kleiner, and J. L. Warner. (1974). The Dependence of Ambient Ozone on Solar Radiation, Wind, Temperature, and Mixing Height. In Symposium on Atmospheric Diffusion and Air Pollution, pages 125–128. American Meterological Society, Boston.
5
Net hourly electrical energy output
Ambient Pressure (AP) in the range 992.89-1033.30 milibar
Relative Humidity (RH) in the range 25.56% to 100.16%
Faculty of Engineering, Namık Kemal University, Turkey
It is observed in Table 3 that most of the proposed estimators give more efficient results than the classical ratio estimator. The relative efficacies table clearly indicated that our proposed estimator ˆˉYg(1)∗∗ is more efficient than ˉY,ˉYS,ˉYSV,ˉYNHandˉYSA.
3.1. Simulation results
The simulation study has been steered by generating random populations from a bivariate normal distribution. For this simulation study, a random population of size 50000 was generated, for auxiliary variables X and Z, from standard bivariate normal distribution. Using these auxiliary variables, the study variable Y was generated by using Yi=Xi+Zi+ei , where ei is N(0,1) . From this population two phase samples were generated by using three different first phase and second phase samples as for simulation I 20% of 50000 and then 50% of 10000 (n1=10000,n2=5000) , for simulation II 10% of 50000 and then 40% of 5000 (n1=5000,n2=2000) and for simulation III 25% of 50000 and then 30% of 12500 (n1=12500,n2=3750) respectively. For each of the sample various estimators were computed. The procedure was repeated for 50000 times and using 50000 values of each estimator, the MSE of each estimator was calculated and results are given in Table 4 below. From the results given in Table 4, we can see that the simulated mean square error of our proposed estimator is approximately half of the mean square of other estimators used in the study for (n1=5000,n2=2000) and (n1=12500,n2=3750) . The simulated mean square error of our proposed estimator is approximately 40% of the mean square error of other estimators for (n1=10000,n2=5000) . From this simulation study, we can say that our proposed estimator, ˉY(1)g , will have smaller mean square error while estimation of population mean as compared with the other available estimators of population mean.
In Table 4, the mean square error of our proposed estimator and already developed estimators have been compared. It is observed from the Table 4 that the MSE of our proposed estimator is minimum in all simulated populations, which proves it to be an efficient estimator since the estimator with least mean square error is considered to be most effective.
4.
Discussion
In this study, an exponential ratio type estimator utilizing two auxiliary variables under two-phase sampling is suggested. A theoretical comparison of derived estimator is carried out by establishing the conditions under which proposed estimator, ˆˉYg(1)∗∗ , will be more efficient than the exponential ratio type estimator of Singh and Vishwakarma [29](ˆˉYSV) , Singh, et al. [32](ˆˉYS) , exponential difference of ratio product estimator of Noor-ul-Amin and Hanif [20](ˆˉYNH) , Sanaullah, et al. [33](ˆˉYSA) and classical regression estimator with two auxiliary variables proposed by Kadilar and Cingi [34](ˆYkc) in two phase sampling. We considered real population information as well as simulated data to inspect the performance of proposed estimator under two-phase sampling scheme. In Table 3, the proposed estimator is compared with some of the existing estimators on the basis of their relative efficiencies while Table 4 indicates that the performance of the proposed exponential estimator is better than the Singh and Vishwakarma [29], Singh, et al. [32], Noor-ul-Amin and Hanif [20] and Sanaullah, et al. [33] for all the simulated populations based on their mean square errors. The estimator with higher relative efficiency and least mean square error is considered to be more efficient. It can be clearly observed from Table 3 and Table 4 that the relative efficiency of our proposed estimator is higher for all real populations and its mean square error is minimum in all simulation studies. This proves our proposed estimator to be an efficient estimator.
5.
Conclusion
An exponential type ratio estimator in two-phase sampling has been proposed, which obtains mean square error by involving two auxiliary variables. The main purpose of this study is to compare the efficiency of our proposed estimator with some of the existing exponential estimators. MSE equation of our proposed estimator has been derived theoretically and its efficiency has been checked through different simulations and datasets of different populations from different fields. The percent relative efficacies values obtained from table-3 are (502.5515), (355.1199), (247.3183), (390.9441) and (279.0334), which are highest for all the populations proving our proposed estimator to be most efficient estimator in this study. Sanaullah, et al. [33]
“Ratio Estimator” appears as the second most efficient estimator in term of relative efficiencies for all populations except population 5. Subsequently, looking on the predominance nature of our proposed estimator, we suggest its use for its practical applications especially in the field of environment, engineering and biological sciences.
Acknowledgement
The authors would like to thank Dr. Olga Korosteleva of California State University, Long Beach for valuable feedback on this work. We also would like to thank the referees for their productive suggestions on the paper.
Conflicts of interest
The authors have no conflict of interest.
References
[1]
Ungar EE, Kerwin EM (1962) Loss factors of viscoelastic systems in terms of energy concepts. J Acoust Soc Am 34: 954–957. https://doi.org/10.1121/1.1918227 doi: 10.1121/1.1918227
[2]
Cai J, Mao S, Liu Y, et al. (2022) Nb/NiTi laminate composite with high pseudoelastic energy dissipation capacity. Mater Today Nano 19: 100238. https://doi.org/10.1016/j.mtnano.2022.100238 doi: 10.1016/j.mtnano.2022.100238
[3]
Oliveira JP, Zeng Z, Berveiller S, et al. (2018) Laser welding of Cu–Al–Be shape memory alloys: Microstructure and mechanical properties. Mater Design 148: 145–152. https://doi.org/10.1016/j.matdes.2018.03.066 doi: 10.1016/j.matdes.2018.03.066
[4]
Patoor E, Berveiller M (1994) Les Alliages à Mémoire de Formes, Hermes.
[5]
Otsuka K, Wayman C (1998) Shape Memory Materials, Cambridge: Cambridge University Press.
[6]
Udovenko VA (2003) Damping, In: Brailovski V, Prokoschkin S, Terriault P, et al., Shape Memory Alloys Fundamentals, Modelling and Applications, University of Quebec, Montreal, Canada, 279–309.
[7]
Orgéas L, Favier D (1998) Stress-induced martensitic transformation of a NiTi alloy in isothermal shear, tension and compression. Acta Mater 46: 5579–5591.
[8]
Menna C, Auricchio F, Asprone D (2014) Application of shape memory alloys in structural engineering, In: Lecce L, Concilio A, Shape Memory Alloy Engineering: for Aerospace, Structural and Biomedical Applications, Elsevier, 369–403. https://doi.org/10.1016/B978-0-08-099920-3.00013-9
[9]
Matsumoto M, Daito Y, Kanamura T, et al. (1998) Wind-induced vibration of cables of cable-stayed bridges. J Wind Eng Ind Aerod 74: 1015–1027. https://doi.org/10.1016/S0167-6105(98)00093-2 doi: 10.1016/S0167-6105(98)00093-2
[10]
Dieng L, Helbert G, Arbab Chirani S, et al. (2013) Use of shape memory alloys damper device to mitigate vibration amplitudes of bridge cables. Eng Struct 56: 1547–1556. https://doi.org/10.1016/j.engstruct.2013.07.018 doi: 10.1016/j.engstruct.2013.07.018
[11]
Nespoli A, Rigamonti D, Riva M, et al. (2016) Study of pseudoelastic systems for the design of complex passive dampers: static analysis and modeling. Smart Mater Struct 25: 105001. https://doi.org/10.1088/0964-1726/25/10/105001 doi: 10.1088/0964-1726/25/10/105001
[12]
Tobushi H, Shimeno Y, Hachisuka T, et al. (1998) Influence of strain rate on superelastic proporties of TiNi shape memory alloys. Mech Mater 30: 141–150. https://doi.org/10.1016/S0167-6636(98)00041-6 doi: 10.1016/S0167-6636(98)00041-6
[13]
Liu Y, Favier D (2000) Stabilisation of martensite due to shear deformation via variant reorientation in polycrystalline NiTi. Acta Mater 48: 3489–3499. https://doi.org/10.1016/S1359-6454(00)00129-4 doi: 10.1016/S1359-6454(00)00129-4
[14]
Bouvet C, Calloch S, Lexcellent C (2004) A phenomenological model for pseudoelasticity of shape memory alloys under multiaxial proportional and nonproportional loadings. Eur J Mech A-Solid 23: 37–61. https://doi.org/10.1016/j.euromechsol.2003.09.005 doi: 10.1016/j.euromechsol.2003.09.005
[15]
Helbert G, Saint-Sulpice L, Arbab Chirani S, et al. (2014) Experimental charaterisation of three-phase NiTi wires under tension. Mech Mater 79: 85–101. https://doi.org/10.1016/j.mechmat.2014.07.020 doi: 10.1016/j.mechmat.2014.07.020
[16]
Zhu S, Zhang Y (2007) A thermomechanical constitutive model for superelastic SMA wire with strain-rate dependence. Smart Mater Struct 16: 1696. https://doi.org/10.1088/0964-1726/16/5/023 doi: 10.1088/0964-1726/16/5/023
[17]
Heintze O, Seelecke S (2008) A coupled thermomechanical model for shape memory alloys-From single crystal to polycrystal. Mater Sci Eng A-Struct 481–482: 389–394. https://doi.org/10.1016/j.msea.2007.08.028 doi: 10.1016/j.msea.2007.08.028
[18]
Shariat BS, Liu Y, Rio G (2012) Thermomechanical modelling of microstructurally graded shape memory alloys. J Alloys Compd 541: 407–414. https://doi.org/10.1016/j.jallcom.2012.06.027 doi: 10.1016/j.jallcom.2012.06.027
[19]
Xiao Y, Zeng P, Lei L (2019) Micromechanical modelling on thermomechanical coupling of superelastic NiTi alloy. Int J Mech Sci 153–154: 36–47. https://doi.org/10.1016/j.ijmecsci.2019.01.030 doi: 10.1016/j.ijmecsci.2019.01.030
[20]
Otsuka K, Ren X (2005) Physical metallurgy of Ti-Ni-based shape memory alloys. Prog Mater Sci 50: 511–678. https://doi.org/10.1016/j.pmatsci.2004.10.001 doi: 10.1016/j.pmatsci.2004.10.001
[21]
Oliveira JP, Mirande RM, Braz Fernandez FM (2017) Welding and joining of NiTi shape memory alloys: A review. Prog Mater Sci 88: 412–466. https://doi.org/10.1016/j.pmatsci.2017.04.008 doi: 10.1016/j.pmatsci.2017.04.008
[22]
Šittner P, SedlákP, Landa M, et al. (2006) In situ experimental evidence on R-phase related deformation processes in activated NiTi wires. Mater Sci Eng A-Struct 438–440: 579–584. https://doi.org/10.1016/j.msea.2006.02.200 doi: 10.1016/j.msea.2006.02.200
[23]
Sengupta A, Papadopoulos P (2009) Constitutive modeling and finite element approximation of B2-R-B19' phase transformations in Nitinol polycrystals. Comput Method Appl M 198: 3214–3227. https://doi.org/10.1016/j.cma.2009.06.004 doi: 10.1016/j.cma.2009.06.004
[24]
Sedlák P, Frost M, Benešová B, et al. (2012) Thermomechanical model for NiTi-based shape memory alloys including R-phase and material anisotropy under multi-axial loadings. Int J Plast 39: 132–151. https://doi.org/10.1016/j.ijplas.2012.06.008 doi: 10.1016/j.ijplas.2012.06.008
[25]
Rigamonti D, Nespoli A, Villa E, et al. (2017) Implementation of a constitutive model for different annealed superelastic SMA wires with rhombohedral phase. Mech Mater 112: 88–100. https://doi.org/10.1016/j.mechmat.2017.06.001 doi: 10.1016/j.mechmat.2017.06.001
[26]
Zhou T, Yu C, Kang G, et al. (2020) A crystal plasticity based constitutive model accounting for R phase and two-step phase transition of polycrystalline NiTi shape memory alloys. Int J Solids Struct 193–194: 503–526. https://doi.org/10.1016/j.ijsolstr.2020.03.001 doi: 10.1016/j.ijsolstr.2020.03.001
[27]
Shaw JA, Kyriakides S (1995) Thermomechanical aspects of NiTi. J Mech Phys Solids 43: 1243–1281. https://doi.org/10.1016/0022-5096(95)00024-D doi: 10.1016/0022-5096(95)00024-D
[28]
Favier D, Louche H, Schlosser P, et al. (2007) Homogeneous and heterogeneous deformation mechanisms in an austenitic polycrystalline Ti-50.8 at% Ni thin tube under tension. Investigation via temperature and strain fields measurements. Acta Mater 55: 5310–5322. https://doi.org/10.1016/j.actamat.2007.05.027 doi: 10.1016/j.actamat.2007.05.027
[29]
Sedmák P, Pilch J, Heller L, et al. (2016) Grain-resolved analysis of localized deformation in nickel-titanium wire under tensile load. Science 353: 559–562. https://doi.org/10.1126/science.aad6700 doi: 10.1126/science.aad6700
[30]
He YJ, Sun QP (2010) Rate-dependent domain spacing in a stretched NiTi strip. Int J Solids Struct 47: 2775–2783. https://doi.org/10.1016/j.ijsolstr.2010.06.006 doi: 10.1016/j.ijsolstr.2010.06.006
[31]
Shariat BS, Bakhtiari S, Yang H, et al. (2020) Controlled initiation and propagation of stress-induced martensitic transformation in functionally graded NiTi. J Alloys Compd 851: 156103. https://doi.org/10.1016/j.jallcom.2020.156103 doi: 10.1016/j.jallcom.2020.156103
[32]
Sun QP, Zhong Z (2000) An inclusion theory for the propagation of martensite band in NiTi shape memory alloy wires under tension. Int J Plast 16: 1169–1187. https://doi.org/10.1016/S0749-6419(00)00006-1 doi: 10.1016/S0749-6419(00)00006-1
[33]
Chan CW, Chan SHJ, Man HC, et al. (2012) 1-D constitutive model for evolution of stress-induced R-phase and localized Lüders-like stress-induced martensitic transformation of super-elastic NiTi wires. Int J Plast 32–33: 85–105. https://doi.org/10.1016/j.ijplas.2011.12.003 doi: 10.1016/j.ijplas.2011.12.003
[34]
Soul H, Yawny A (2013) Thermomechanical model for evaluation of the superelastic response of NiTi shape memory alloys under dynamic conditions. Smart Mater Struct 22: 035017. https://doi.org/10.1088/0964-1726/22/3/035017 doi: 10.1088/0964-1726/22/3/035017
[35]
Xiao Y, Jiang D (2020) Constitutive modelling of transformation pattern in superelastic NiTi shape memory alloy under cyclic loading. Int J Mech Sci 182: 105743. https://doi.org/10.1016/j.ijmecsci.2020.105743 doi: 10.1016/j.ijmecsci.2020.105743
[36]
Zuo XB, Li AQ (2011) Numerical and experimental investigation on cable vibration mitigation using shape memory alloy damper. Struct Control Health Monit 18: 20–39.
[37]
Ben Mekki O, Auricchio F (2011) Performance evaluation of shape-memory-alloy superelastic behavior to control a stay cable in cable-stayed bridges. Int J Non-Linear Mech 46: 470–477. https://doi.org/10.1016/j.ijnonlinmec.2010.12.002 doi: 10.1016/j.ijnonlinmec.2010.12.002
[38]
Torra V, Auguet C, Isalgue A, et al. (2013) Built in dampers for stayed cables in bridges via SMA. The SMARTeR-ESF project: A mesoscopic and macroscopic experimental analysis with numerical simulations. Eng Struct 49: 43–57. https://doi.org/10.1016/j.engstruct.2012.11.011 doi: 10.1016/j.engstruct.2012.11.011
[39]
Morse P, Ingard K (1968) Theoritical Acoustics, Princeton University Press.
[40]
MSC (2008) Marc/mentat volume A: Theory and user information.
[41]
Helbert G, Dieng L, Arbab Chirani S, et al. (2018) Investigation of NiTi based damper effects in bridge cables vibration response: Damping capacity and stiffness changes. Eng Struct 165: 184–197. https://doi.org/10.1016/j.engstruct.2018.02.087 doi: 10.1016/j.engstruct.2018.02.087
[42]
Helbert G, Saint-Sulpice L, Arbab Chirani S, et al. (2017) A uniaxial constitutive model for superelastic NiTi SMA including R-phase and martensite transformations and thermal effects. Smart Mater Struct 26: 025007. https://doi.org/10.1088/1361-665X/aa5141 doi: 10.1088/1361-665X/aa5141
[43]
Helbert G (2014) Contribution à la durabilité des câbles de Génie Civil vis-à-vis de la fatigue par un dispositif amortisseur à base de fils NiTi, Université de Bretagne Sud.
[44]
Qian ZQ, Akisanya AR (1999) An investigation of the stress singularity near the free edge of scarf joints. Eur J Mech A-Solid 18: 443–463. https://doi.org/10.1016/S0997-7538(99)00118-7 doi: 10.1016/S0997-7538(99)00118-7
[45]
Harvey JF (1974) Theory and Design of Modern Pressure Vessels, Van Nostrand Reinhold.
[46]
Auger F, Gonçalvès P, Lemoine O, et al. (1996) Time-frequency toolbox: For use with Matlab. Available from: https://tftb.nongnu.org/
[47]
Piedboeuf MC, Gauvin R, Thomas M (1998) Damping behaviour of shape memory alloys: strain amplitude, frequency and temperature effects. J Sound Vib 214: 895–901. https://doi.org/10.1006/jsvi.1998.1578 doi: 10.1006/jsvi.1998.1578
This article has been cited by:
1.
Hatice Oncel Cekim, Cem Kadilar,
ln-Type Variance Estimators in Simple Random Sampling,
2020,
2220-5810,
689,
10.18187/pjsor.v16i4.3072
2.
Tolga Zaman, Cem Kadilar,
Exponential ratio and product type estimators of the mean in stratified two-phase sampling,
2021,
6,
2473-6988,
4265,
10.3934/math.2021252
3.
Subhash Kumar Yadav, Diksha Arya, Gajendra K. Vishwakarma, Mukesh Kumar Verma,
Generalized Ratio-Cum-Exponential-Log Ratio Type Estimators of Population Mean under Simple Random Sampling Scheme,
2023,
44,
1995-0802,
3889,
10.1134/S1995080223090445
4.
Jing Wang, Sohaib Ahmad, Muhammad Arslan, Showkat Ahmad Lone, A.H. Abd Ellah, Maha A. Aldahlan, Mohammed Elgarhy,
Estimation of finite population mean using double sampling under probability proportional to size sampling in the presence of extreme values,
2023,
9,
24058440,
e21418,
10.1016/j.heliyon.2023.e21418
Helbert Guillaume, Dieng Lamine, Chirani Shabnam Arbab, Pilvin Philippe. Influence of the thermomechanical behavior of NiTi wires embedded in a damper on its damping capacity: Application to a bridge cable[J]. AIMS Materials Science, 2023, 10(1): 1-25. doi: 10.3934/matersci.2023001
Helbert Guillaume, Dieng Lamine, Chirani Shabnam Arbab, Pilvin Philippe. Influence of the thermomechanical behavior of NiTi wires embedded in a damper on its damping capacity: Application to a bridge cable[J]. AIMS Materials Science, 2023, 10(1): 1-25. doi: 10.3934/matersci.2023001
The number of pieces of the stems, out of 50, planted in each plot.
The number of diseased shoots.
The total number of shoots in each plot.
The data were kindly supplied by Dr. C.G.B. Demetrio of Escola Superior de Agricultura, Universidade de Sao Paolo, Brazil
2
Conductivity
Magnesium in me/100gm
Bulk density in gm
Khattree, R., and Naik, D. N. (2000) Multivariate Data Reduction and Discrimination with SAS Software. SAS Institute.
3
Random variable non-dimensional
Pressure (from Chievres weather station), in mm Hg
Humidity outside (from Chievres weather station)
University of Mons (UMONS).
4
Ozone
Radiation
Temperature
Bruntz, S. M., W. S. Cleveland, B. Kleiner, and J. L. Warner. (1974). The Dependence of Ambient Ozone on Solar Radiation, Wind, Temperature, and Mixing Height. In Symposium on Atmospheric Diffusion and Air Pollution, pages 125–128. American Meterological Society, Boston.
5
Net hourly electrical energy output
Ambient Pressure (AP) in the range 992.89-1033.30 milibar
Relative Humidity (RH) in the range 25.56% to 100.16%
Faculty of Engineering, Namık Kemal University, Turkey
Pop.
N
n1
n2
ˉX
ˉY
ˉZ
Cy
Cx
Cz
ρxy
ρyz
ρxz
1
180
79
33
11.94
20.26
118.14
1.21
0.54
0.37
0.08
0.34
0.40
2
48
21
15
8.4646
6.5885
1.3158
0.5989
0.1599
0.1653
0.5083
0.7626
0.4901
3
19735
9000
5000
79.7
24.9
42.9
0.580
0.186
0.121
0.020
0.004
0.4873
4
111
37
17
184.80
42.099
77.792
0.7868
0.4910
0.1219
0.3483
0.6985
0.2940
5
9571
1000
700
1013.2
454.3
73.3
0.037
0.005
0.199
0.514
0.389
0.099
S.#
Estimators
Pop1
Pop2
Pop3
Pop4
Pop5
1
ˆˉY
100.000
100.000
100.000
100.000
100.000
2
ˆˉYSV
*
100.6738
*
*
169.3055
3
ˆˉYS
100.4436
112.0270
100.025
108.3955
184.5887
4
ˆˉYNH
107.1621
122.0960
*
107.1865
*
5
ˆˉYSA
113.6877
147.9260
102.0920
143.2637
150.0283
6
ˆYkc
465.0547
301.3585
247.1565
322.2064
238.6583
7
ˆˉYg(1)∗∗
502.5515
355.1199
247.3330
390.9441
279.0334
*Percent Relative Efficiency is less than 100.
Estimators
Simulation I n1=10000n2=5000
Simulation II n1=5000n2=2000
Simulation III n1=12500n2=3750
MSE(ˉY(1)∗∗g)
0.007342740
0.01482553
0.008580045
MSE(ˉYsv)
0.007763214
0.01609473
0.008786188
MSE(ˉYs)
0.014134104
0.03650642
0.019750622
MSE(ˉYNH)
0.020980778
0.06862683
0.039805696
MSE(ˉYSA)
0.021681391
0.07091925
0.041749114
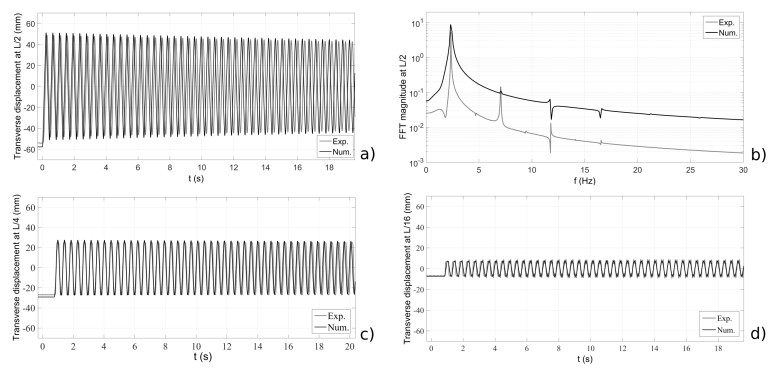
Figure 1. Transverse displacement of the cable (transverse force at L/2): (a) at L/2; (b) associated FFT frequency spectra; (c) at L/4; (d) at L/16
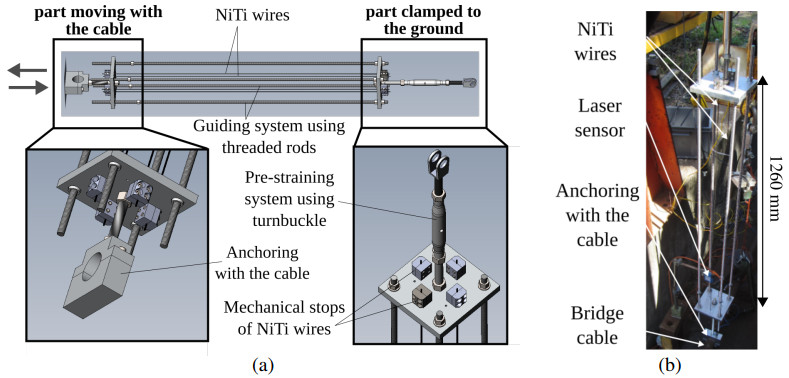
Figure 2. Damping device: (a) Scheme of the device, (b) installation on the full-scale cable
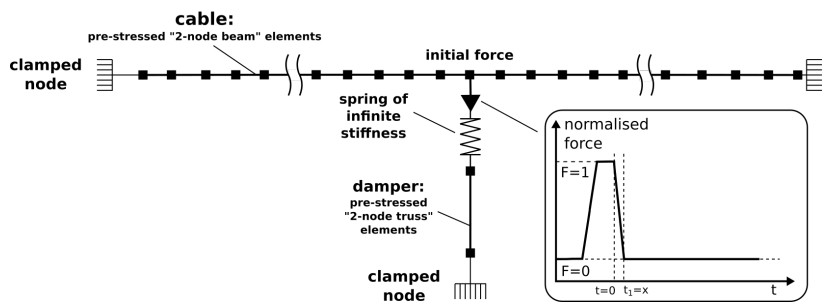
Figure 3. Scheme of the Finite Element model of the whole system "damper+cable"
Figure 4. Three reference positions along the numerical wire
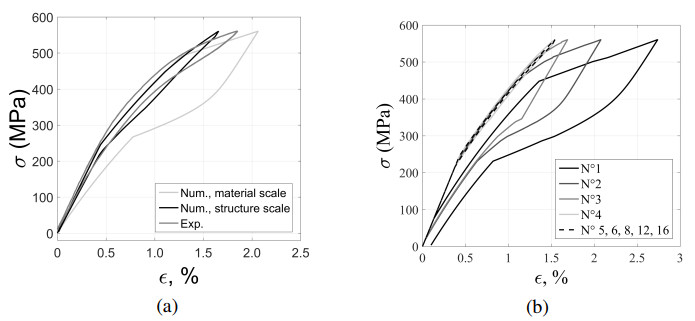
Figure 5. (a) Stress-strain curve for a force-imposed test by considering bands propagation (wire scale) or no propagation (material scale); (b) corresponding behavior of several elements along the wire structure
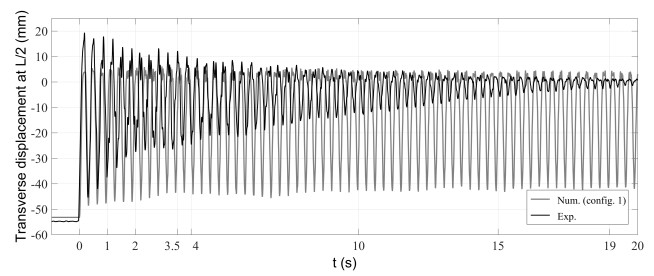
Figure 6. Transverse displacement of the cable at L/2 equipped with a damper (study case 1/configuration 1) placed at L/2
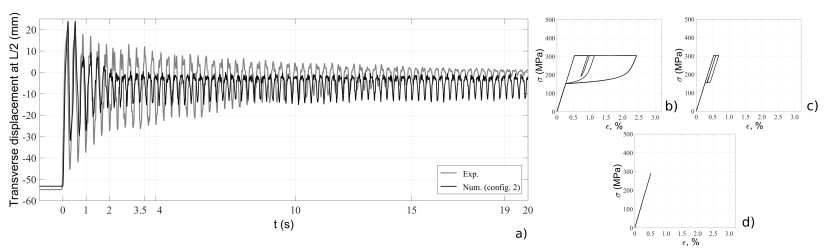
Figure 7. (a) Transverse displacement of the cable at L/2 equipped with a damper (study case 1/ configuration 2) placed at L/2; Stress-Strain curves related to the behavior of the material embedded in the damper: (b) [0, 1]s, (c) [2, 3.5]s, (d) [19, 20]s
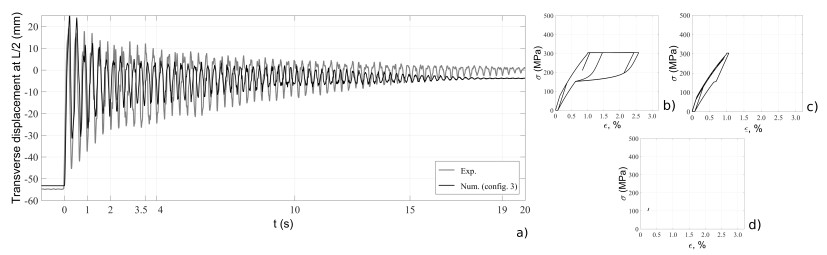
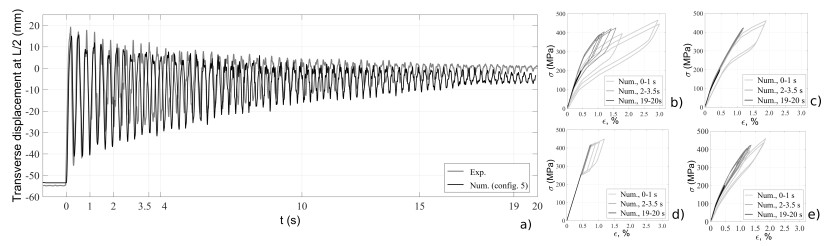
Figure 8. (a) Transverse displacement of the cable at L/2 equipped with a damper (study case 1/configuration 3) placed at L/2; Stress-Strain curves related to the behavior of the material embedded in the damper: (b) [0, 1]s, (c) [2, 3.5]s, (d) [19, 20]s
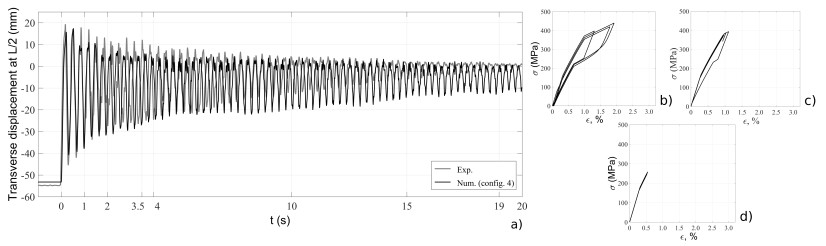
Figure 9. (a) Transverse displacement of the cable at L/2 equipped with a damper (study case 1/ configuration 4) placed at L/2; Stress-Strain curves related to the behavior of the material embedded in the damper: (b) [0, 1]s, (c) [2, 3.5]s, (d) [19, 20]s
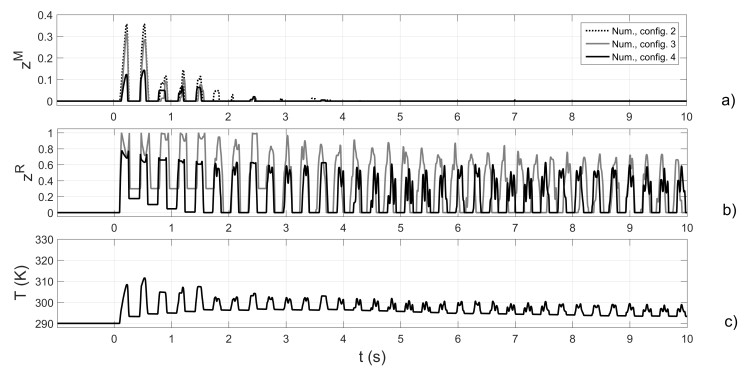
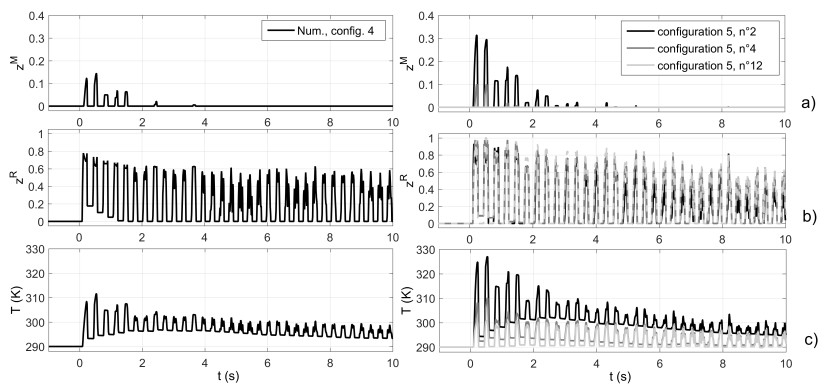
Figure 10. Comparison between configurations 2, 3, 4: (a) martensite volumic fraction; (b) R-phase volumic fraction; (c) material temperature
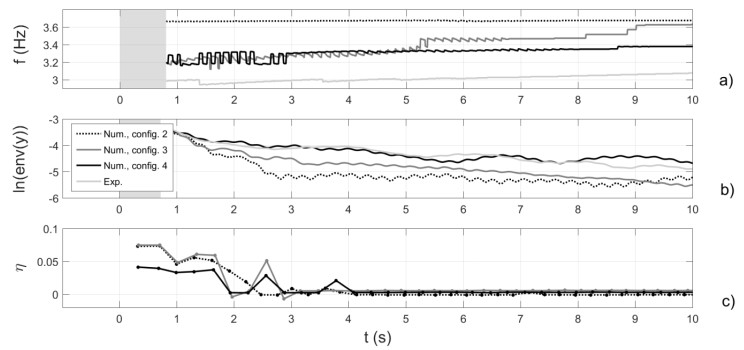
Figure 11. Comparison between configurations 2, 3, 4: (a) frequency of the 1st mode; (b) logarithm of the signal envelop; (c) loss factor η
Figure 12. (a) Transverse displacement of the cable at L/2 equipped with a damper (study case 1/configuration 5) placed at L/2; Stress-Strain curves related to the local behavior of the material embedded in the damper at three reference positions: (b) element n∘ 2, (c) n∘ 4, (d) n∘ 12, (e) macroscopic behavior of the wire
Figure 13. Comparison between configurations 4 and 5: (a) martensite volumic fraction; (b) R-phase volumic fraction; (c) material temperature
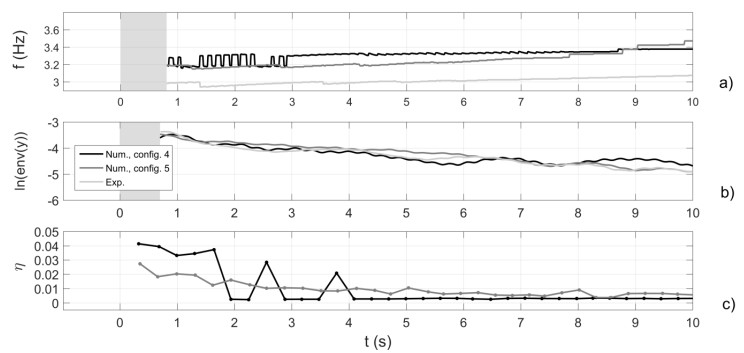
Figure 14. Comparison between configurations 4 and 5: (a) frequency of the 1st mode; (b) logarithm of the signal envelop; (c) loss factor η
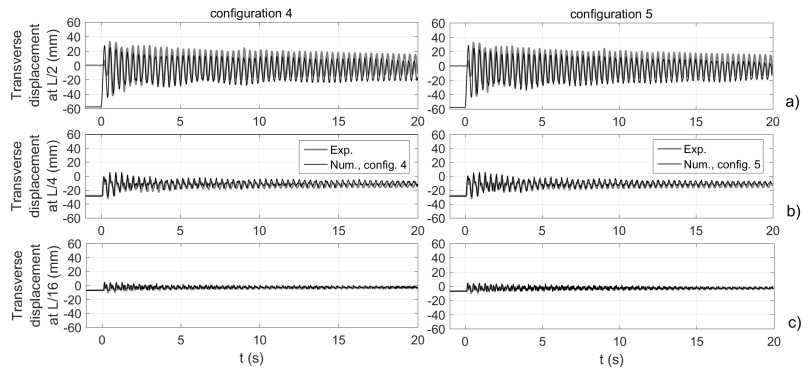
Figure 15. Transverse displacement of the cable equipped with a damper (configuration 5) placed at L/2: (a) sensor at L/4, (b) sensor at L/16
Figure 16. Transverse displacement of the cable equipped with a damper placed at L/4: sensor placed (a) at L/2, (b) at L/4, (c) at L/16
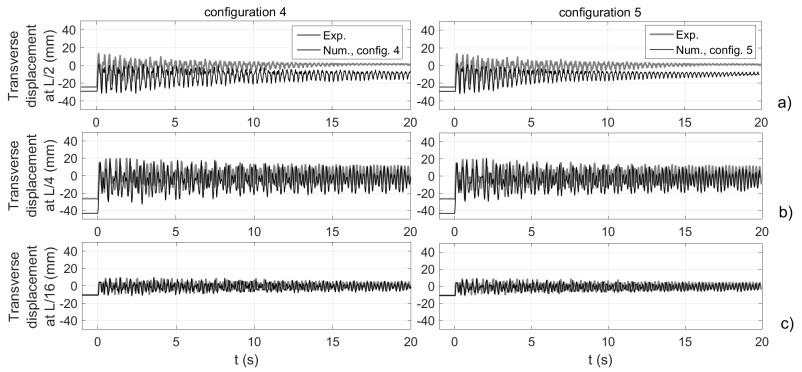
Figure 17. Transverse displacement of the cable equipped with a damper placed at L/2: sensor placed (a) at L/2, (b) at L/4, (c) at L/16


 DownLoad: