Department of Chemistry, Faculty of Science, Imam Khomeini International University, Qazvin, Iran
2.
Cellular and Molecular Research Center, Research Institute for Prevention of Non-Communicable Diseases, Qazvin University of Medical Sciences, Qazvin, Iran
Received:
03 June 2020
Accepted:
01 September 2020
Published:
25 September 2020
Inhibition of activity and stability structure of mushroom tyrosinase (MT) is highly important, since it is a key enzyme of melanogenesis playing various roles in organisms. In this study, thermodynamic stability and diphenolase activities were investigated in the presence of quercetin-7-linoleate (ligand I) and quercetin-7-oleate (ligand II) on mushroom tyrosinase by experimental and computational methods. Kinetic analyses showed that the inhibition mechanism of these ligands is reversible and competitive manner. The inhibition constants values (KiI = 0.31 and KiII = 0.43 mM) and the half maximal inhibitory concentration (IC50 = 0.58 and 0.71 mM) were determined for ligand I and ligand II respectively. Thermal denaturation for the sole and modified enzyme were performed by using fluorescence spectroscopy to obtain the thermodynamic parameters of denaturation. Type of interactions and orientation of ligands were determined by molecular docking simulations. The binding affinities of the MT–ligand complexes during docking were calculated. In the computational studies performed using the MT (PDBID: 2Y9X) from which tropolone was removed, we showed that the ligands occupied different pockets in MT other than the active site. The best binding energies with values of −9 and −7.9 kcal/mol were calculated and the MolDock scores of the best poses with the lowest root mean square deviation (RMSD) were obtained as −172.70 and −165.75 kcal/mol for complexes of MT–ligand I and MT–ligand II, respectively. Computational simulations and experimental analysis demonstrated that the ligands increased the mushroom tyrosinase stability by reducing the activity of enzyme. In this regard, ligand I showed the potent inhibitory and played an important role in enzyme stability.
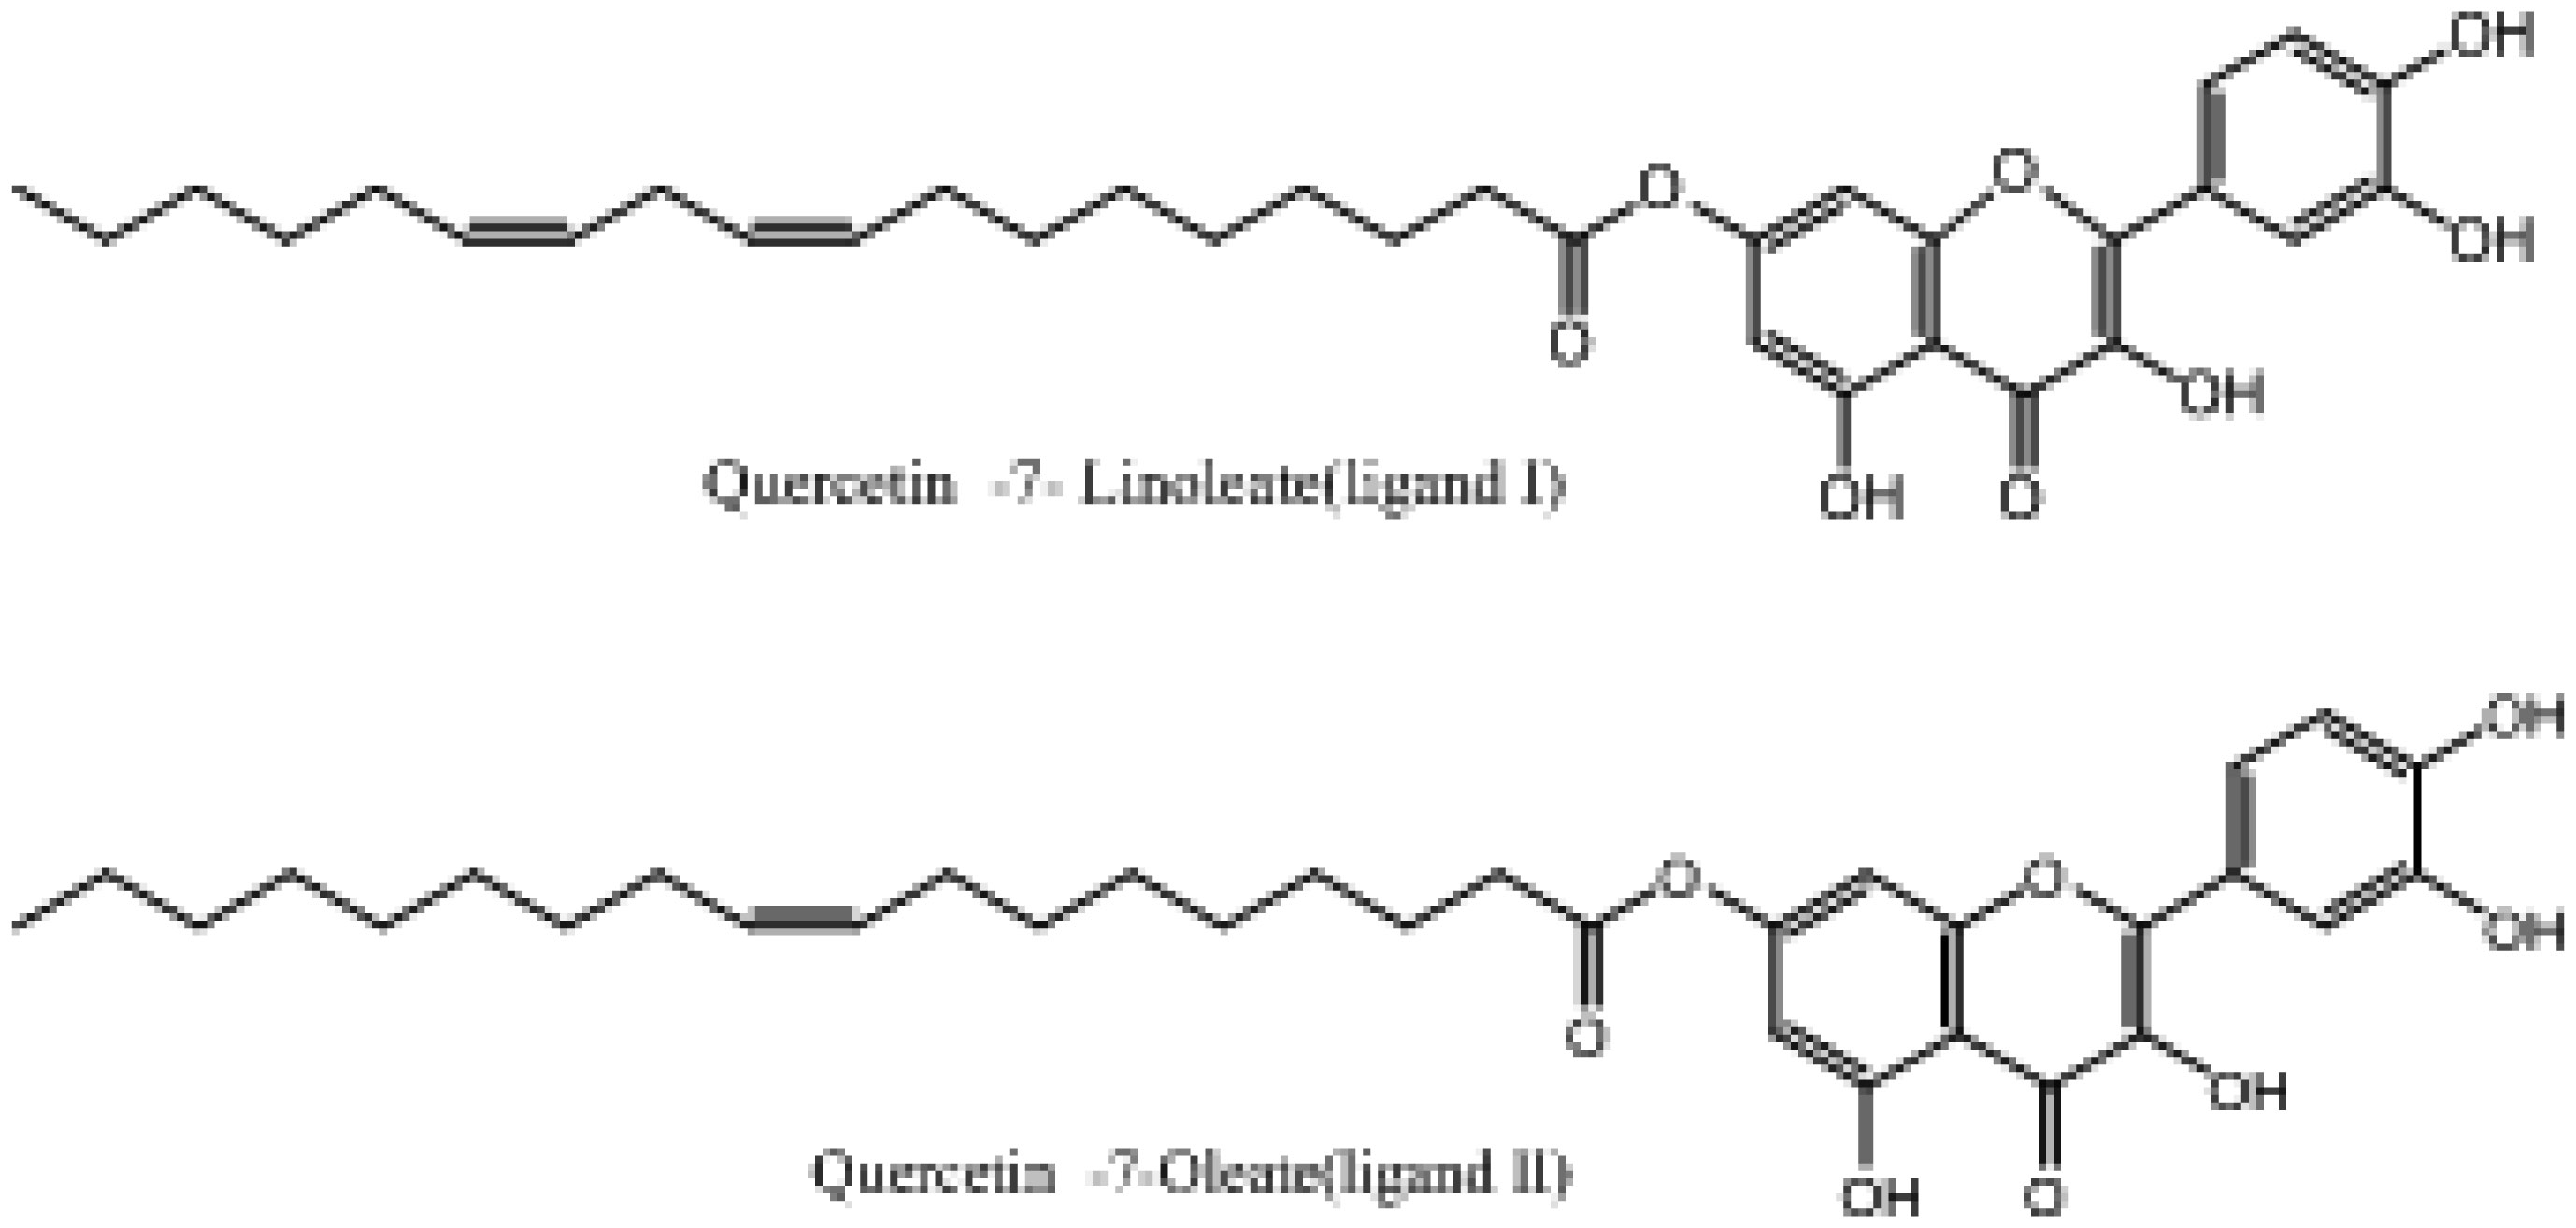
Citation: Morteza Vaezi, G. Rezaei Behbehani, Nematollah Gheibi, Alireza Farasat. Thermodynamic, kinetic and docking studies of some unsaturated fatty acids-quercetin derivatives as inhibitors of mushroom tyrosinase[J]. AIMS Biophysics, 2020, 7(4): 393-410. doi: 10.3934/biophy.2020027
Related Papers:
[1]
Tolga Zaman, Cem Kadilar .
Exponential ratio and product type estimators of the mean in stratified two-phase sampling. AIMS Mathematics, 2021, 6(5): 4265-4279.
doi: 10.3934/math.2021252
[2]
Riffat Jabeen, Aamir Sanaullah, Muhammad Hanif, Azam Zaka .
Two-exponential estimators for estimating population mean. AIMS Mathematics, 2021, 6(1): 737-753.
doi: 10.3934/math.2021045
Xuechen Liu, Muhammad Arslan .
A general class of estimators on estimating population mean using the auxiliary proportions under simple and two phase sampling. AIMS Mathematics, 2021, 6(12): 13592-13607.
doi: 10.3934/math.2021790
[5]
Khazan Sher, Muhammad Ameeq, Muhammad Muneeb Hassan, Basem A. Alkhaleel, Sidra Naz, Olyan Albalawi .
Novel efficient estimators of finite population mean in stratified random sampling with application. AIMS Mathematics, 2025, 10(3): 5495-5531.
doi: 10.3934/math.2025254
[6]
Saman Hanif Shahbaz, Aisha Fayomi, Muhammad Qaiser Shahbaz .
Estimation of the general population parameter in single- and two-phase sampling. AIMS Mathematics, 2023, 8(7): 14951-14977.
doi: 10.3934/math.2023763
[7]
Amber Yousaf Dar, Nadia Saeed, Moustafa Omar Ahmed Abu-Shawiesh, Saman Hanif Shahbaz, Muhammad Qaiser Shahbaz .
A new class of ratio type estimators in single- and two-phase sampling. AIMS Mathematics, 2022, 7(8): 14208-14226.
doi: 10.3934/math.2022783
[8]
Anoop Kumar, Renu Kumari, Abdullah Mohammed Alomair .
Optimal classes of memory-type estimators of population mean for temporal surveys. AIMS Mathematics, 2025, 10(1): 1008-1025.
doi: 10.3934/math.2025048
[9]
Sohaib Ahmad, Sardar Hussain, Muhammad Aamir, Faridoon Khan, Mohammed N Alshahrani, Mohammed Alqawba .
Estimation of finite population mean using dual auxiliary variable for non-response using simple random sampling. AIMS Mathematics, 2022, 7(3): 4592-4613.
doi: 10.3934/math.2022256
[10]
Sohaib Ahmad, Sardar Hussain, Javid Shabbir, Muhammad Aamir, M. El-Morshedy, Zubair Ahmad, Sharifah Alrajhi .
Improved generalized class of estimators in estimating the finite population mean using two auxiliary variables under two-stage sampling. AIMS Mathematics, 2022, 7(6): 10609-10624.
doi: 10.3934/math.2022592
Abstract
Inhibition of activity and stability structure of mushroom tyrosinase (MT) is highly important, since it is a key enzyme of melanogenesis playing various roles in organisms. In this study, thermodynamic stability and diphenolase activities were investigated in the presence of quercetin-7-linoleate (ligand I) and quercetin-7-oleate (ligand II) on mushroom tyrosinase by experimental and computational methods. Kinetic analyses showed that the inhibition mechanism of these ligands is reversible and competitive manner. The inhibition constants values (KiI = 0.31 and KiII = 0.43 mM) and the half maximal inhibitory concentration (IC50 = 0.58 and 0.71 mM) were determined for ligand I and ligand II respectively. Thermal denaturation for the sole and modified enzyme were performed by using fluorescence spectroscopy to obtain the thermodynamic parameters of denaturation. Type of interactions and orientation of ligands were determined by molecular docking simulations. The binding affinities of the MT–ligand complexes during docking were calculated. In the computational studies performed using the MT (PDBID: 2Y9X) from which tropolone was removed, we showed that the ligands occupied different pockets in MT other than the active site. The best binding energies with values of −9 and −7.9 kcal/mol were calculated and the MolDock scores of the best poses with the lowest root mean square deviation (RMSD) were obtained as −172.70 and −165.75 kcal/mol for complexes of MT–ligand I and MT–ligand II, respectively. Computational simulations and experimental analysis demonstrated that the ligands increased the mushroom tyrosinase stability by reducing the activity of enzyme. In this regard, ligand I showed the potent inhibitory and played an important role in enzyme stability.
1.
Introduction
The use of survey sampling is useful in solving real world problems in the field of environmental changes, engineering, management and biological sciences. For instance, environmental sampling is a key tool to verify sources of pollution and adequacy of hygiene process, refining the frequency and intensity of cleaning and sanitation, identifying problem areas, food safety validation programs, and to give an early cautioning of issues that may require remedial action. Sampling can be conducted to characterize background radiological levels, determine the concentration of radionuclides and make recommendations on environmental surveillance for agricultural products. Over all, it gives the confirmation that product being made will be made under clean conditions.
In case of forming travelling patterns of a certain city residents it is hard to approach every person of the city and ask the information on their travel pattern. A sample data is gathered and based on that information the developers try to understand the travel behavior of residents. Likewise, when choosing the trademark quality of cement, of a specific blend, data resulting from the tests on a sample is used. Similarly, a sample of borehole information is used to find quality soil. The sample is representative of population in all the cases and while doing so the representative ability of the sample data must be ensured statistically.
Velasco-Muñoz, et al. [1] reviewed 25 years of researches on sustainable water use in farming. A bibliometric examination was established to sample 2084 published articles from 1993 to 2017. Results showed that sustainable water used for agriculture attained exponential growth and has turned into a worldwide issue. Serbu, et al. [2] collected water samples from four different locations beside the Cibin River over a time of a year and applied Multiple-Criteria Decision Analysis strategies for the surveying the effect of toxins on the earth.
Ziemer, et al. [3] discussed that how data is collected and in what way the sample of electrical engineering departments is evolved that is used as database. De Mello, et al. [4] proposed theoretical framework that contributes to strengthen representativeness of their outcomes, though some key problems concerning survey study are still open and deserve attention from Software Engineering community. De Mello, et al. [5] described the heterogeneity and members who repeatedly contributed to increase the strength of survey’s results. Consequently, De Mello and Travassos [5] believed that sharing of this experience, questionnaire and idea can be helpful for scientists interested on executing surveys on broader scale in Software Engineering.
The information retrieved from auxiliary variables has resulted in wide ranging gain in performance over estimators which don’t take such information. When the auxiliary variable X is available in advance or observed easily and high correlation exists with study variable Y, the use of auxiliary information is effective to estimate population mean. In these situations ratio, regression and product estimators are good examples to use. Estimation method of regression was used by Watson [6] to estimate the mean area of leaves on plant. Cochran [7] proposed ratio method in case of strong positive correlation existence between Y and X (study and auxiliary variables). Murthy [8] revisited the idea given by Robson [9] that product method of estimation is appropriate if strong negative correlation exits between auxiliary and study variables. Srivastava [10] proposed the general ratio estimator using a single auxiliary variable and given that population information on this variable is not available. Exponential smoothing is one of the forecast methods to recognize substantial changes in data by incorporating the most recent information. Given that there are numerous different approaches to make forecasts, exponential smoothing is significantly easy to learn, forecasts accurately, and its application to recent observations gives this technique an edge over others.
Bahl, et al. [11] proposed exponential product estimator when study variable and auxiliary variable are negatively correlated and exponential ratio estimator, in case of positive correlation, exists between Y and X. Numerous authors including Srivastava [10], Hidiroglou [12], Samiuddin, et al. [13], Singh, et al. [14], Singh, et al. [15], Hanif, et al. [16], Hanif, et al. [17], Singh, et al. [18], Singh, et al. [19], Noor-ul-Amin, et al. [20], Tailor, et al. [21] and Shabbir, et al. [22] have also proposed improved ratio and product for estimating the population average of study variable. Al-Marshadi, et al. [23] suggested estimator for estimating population variance by using multi auxiliary variables.
Generally, ratio and product estimators are less efficient than the linear regression estimator when it passes through the origin. It is observed, in most of the situations, that the regression line does not pass through the origin. Considering this fact, Vishwakarma, et al. [24] proposed the ratio product type estimator to improve the performance of Singh and Espejo [14] estimator using two auxiliary variables under two phase sampling.
Vishwakarma, et al. [25] proposed generalized class of estimators by using the information of multi-auxiliary variables in two-phase sampling scheme and claimed that their generalized class of estimators performed well over the Dash, et al. [26] proposed class of estimators.
Mishra, et al. [27] used log function and proposed a ln-product type estimator for estimating the mean value of study variable Y. Akhlaq, et al. [28] proposed an exponential estimator, which is most efficient than the previous estimators for estimating the process variability by using auxiliary information.
To estimate the population mean, considering the N population units D=(D1,D2,D3..........DN), Let yi and (xi,zi) be the values of study variable (Y) and auxiliary variables (X,Y) respectively. Population averages are ˉY=N−1N∑i=1YiandˉX=N−1N∑i=1Xi where ˉY is the population mean of study variable and ˉX is population mean of auxiliary variable.
Auxiliary information in two-phase sampling proves to be effective in estimating the population mean. The first phase estimates the population variable X (auxiliary) in such a manner that when information of the auxiliary variable is not available, it then evaluates the second phase. The first phase sample selection is known as the primary sample, which is comprised of n1(n1<N) units. We select a sample from ‘N’ units by applying simple random sampling without replacement (SRSWR) technique in the first phase. In some situations, another auxiliary variable (Z) is helpful for obtaining the information of the first auxiliary variable X and both the variables are observed in the first phase sample.
The essential information is estimated in first phase for the auxiliary variable X before moving into the second phase. With the assistance of the auxiliary variable X, the population mean ˉY of Y is estimated in second phase. To serve this purpose, another sample of SRSWR is sorted out from a primary sample of n2 units (n2<n1) Singh, et al. [29]. The sample size n1 from the population ‘N’ is a primary sample. The sample n2 from n1 is a subsample of our study.
The classical ratio estimator of population mean ˉY under double sampling scheme is given by Cochran [30] as:
ˉYr=(ˉy2(ˉx2)−1ˉx1);ˉx2≠0
(1.1)
where ˉy=n−1n∑i=1yiandˉx=n−1n∑i=1xi
Upadhyaya, et al. [31] used available information of coefficient of variation (Cz) and coefficient of kurtosis (β2(z)) from auxiliary variable and proposed estimator for estimating study variable ˉY as:
ˉYUS=ˉy(ˉx′ˉx)(CzˉZ+β2(Z)Czˉz′+β2(Z))
(1.2)
The MSE of [31] estimator up to the order o(n)−1 as:
The coefficient of variation X is Cx=sx(ˉX)−1 , Y is Cy=sy(ˉY)−1 and Z is Cz=sz(ˉZ)−1 while correlation coefficient of (Y,X) is ρyx=sxy(sxsy)−1, is (Y,Z)ρyz=syz(sysz)−1 and (X,Z) is ρxz=sxz(sxsz)−1.
The estimators given above are used for estimating mean of study variable in different conditions. The main purpose of this article is to suggest an improved exponential estimator of ratio type and explores its properties. A ln function and two auxiliary variables are used with in proposed estimator and discussed in following section. Third section is comprised of mathematical illustration of suggested estimator and it’s comparison with some existing estimators ˉY,ˉYS,ˉYSV,ˉYNHandˉYSA. In section four empirical study is carried out while conclusion is being discussed in last section.
2.
Materials and method
Motivated by Cekim, et al. [35], who proposed ratio estimator using ln function for estimation of population variance, We propose a new estimator by combining the exponential and ln ratio terms using the information of two auxiliary variables Z and X in two-phase sampling for estimating population mean ˉY . Let n1 and n2<n1 be the sample sizes of first and second phase respectively, while an unbiased estimator of ˉZ be ˉz1∗=(NˉZ−n1ˉz(1))/(NˉZ−n1ˉz(1))(N−n1)(N−n1) , as suggested by Bandyopadhyay [36] and Srivenkataramana [37]. The proposed estimator is given as:
where θ1 , θ2 are optimization constants and are used to minimize the mean square error while ˉz∗ introduces as transformed variable. The “ln” function has been introduced to control the variability of ratio for first and second phase variables while exponential function on ratio of transformed variables also helps to reduce the estimator’s mean square errors. The properties of the propose estimator can be studied by considering
ˉy=(ˉY+ey),ˉx=(ˉX+ex)andˉz=(ˉZ+ez)
Putting ˉy=(ˉY+ey),ˉx=(ˉX+ex)andˉz=(ˉZ+ez) and ˉz∗1 in Eq (2.1), we get
2.1. Comparing mathematically ˉYg(1)∗∗ with some existed estimators
In this section, we compared our proposed estimator ˉYg(1)∗∗ with some of existed estimators. The comparison has been made in terms of the mean square errors and we have obtained some conditions under which our proposed estimator has smaller minimum MSE as compared to some already existing estimators. These comparisons are:
If the above given expressions are not met then estimators ˉY,ˉYS,ˉYSV,ˉYNHandˉYSA are more efficient than the suggested estimator ˉYg(1)∗∗.
3.
Results
In this section some real populations available in literature have been selected for empirical study to obtain mean square error and relative efficiency of our proposed estimator ˆˉYg(1)∗∗. For checking the performance of suggested estimator the following real data sets have been used.
Sugar Cane Disease “coal of sugar-cane” (This is a disease that is common in sugar-cane plantations in certain areas of Brazil)
Soil Compositions of Physical and Chemical Characteristics
Appliances energy prediction Data Set
Ozone (The data is monthly ozone averages on a very coarse 24 by 24 grid covering Central America, from Jan 1995 to Dec 2000)
Combined Cycle Power Plant Data Set (The voltage output of engines was measured at various combinations of blade speed and sensor extension)
The comparison of our suggested estimator has been made with the conventional unbiased estimators ˉY,ˉYS,ˉYSV,ˉYNHandˉYSA . The depiction of variables for each population is given below:
Table 1.
Description of variables.
Pop.
Y
X
Z
Populations Sources
1
The number of pieces of the stems, out of 50, planted in each plot.
The number of diseased shoots.
The total number of shoots in each plot.
The data were kindly supplied by Dr. C.G.B. Demetrio of Escola Superior de Agricultura, Universidade de Sao Paolo, Brazil
2
Conductivity
Magnesium in me/100gm
Bulk density in gm
Khattree, R., and Naik, D. N. (2000) Multivariate Data Reduction and Discrimination with SAS Software. SAS Institute.
3
Random variable non-dimensional
Pressure (from Chievres weather station), in mm Hg
Humidity outside (from Chievres weather station)
University of Mons (UMONS).
4
Ozone
Radiation
Temperature
Bruntz, S. M., W. S. Cleveland, B. Kleiner, and J. L. Warner. (1974). The Dependence of Ambient Ozone on Solar Radiation, Wind, Temperature, and Mixing Height. In Symposium on Atmospheric Diffusion and Air Pollution, pages 125–128. American Meterological Society, Boston.
5
Net hourly electrical energy output
Ambient Pressure (AP) in the range 992.89-1033.30 milibar
Relative Humidity (RH) in the range 25.56% to 100.16%
Faculty of Engineering, Namık Kemal University, Turkey
It is observed in Table 3 that most of the proposed estimators give more efficient results than the classical ratio estimator. The relative efficacies table clearly indicated that our proposed estimator ˆˉYg(1)∗∗ is more efficient than ˉY,ˉYS,ˉYSV,ˉYNHandˉYSA.
3.1. Simulation results
The simulation study has been steered by generating random populations from a bivariate normal distribution. For this simulation study, a random population of size 50000 was generated, for auxiliary variables X and Z, from standard bivariate normal distribution. Using these auxiliary variables, the study variable Y was generated by using Yi=Xi+Zi+ei , where ei is N(0,1) . From this population two phase samples were generated by using three different first phase and second phase samples as for simulation I 20% of 50000 and then 50% of 10000 (n1=10000,n2=5000) , for simulation II 10% of 50000 and then 40% of 5000 (n1=5000,n2=2000) and for simulation III 25% of 50000 and then 30% of 12500 (n1=12500,n2=3750) respectively. For each of the sample various estimators were computed. The procedure was repeated for 50000 times and using 50000 values of each estimator, the MSE of each estimator was calculated and results are given in Table 4 below. From the results given in Table 4, we can see that the simulated mean square error of our proposed estimator is approximately half of the mean square of other estimators used in the study for (n1=5000,n2=2000) and (n1=12500,n2=3750) . The simulated mean square error of our proposed estimator is approximately 40% of the mean square error of other estimators for (n1=10000,n2=5000) . From this simulation study, we can say that our proposed estimator, ˉY(1)g , will have smaller mean square error while estimation of population mean as compared with the other available estimators of population mean.
In Table 4, the mean square error of our proposed estimator and already developed estimators have been compared. It is observed from the Table 4 that the MSE of our proposed estimator is minimum in all simulated populations, which proves it to be an efficient estimator since the estimator with least mean square error is considered to be most effective.
4.
Discussion
In this study, an exponential ratio type estimator utilizing two auxiliary variables under two-phase sampling is suggested. A theoretical comparison of derived estimator is carried out by establishing the conditions under which proposed estimator, ˆˉYg(1)∗∗ , will be more efficient than the exponential ratio type estimator of Singh and Vishwakarma [29](ˆˉYSV) , Singh, et al. [32](ˆˉYS) , exponential difference of ratio product estimator of Noor-ul-Amin and Hanif [20](ˆˉYNH) , Sanaullah, et al. [33](ˆˉYSA) and classical regression estimator with two auxiliary variables proposed by Kadilar and Cingi [34](ˆYkc) in two phase sampling. We considered real population information as well as simulated data to inspect the performance of proposed estimator under two-phase sampling scheme. In Table 3, the proposed estimator is compared with some of the existing estimators on the basis of their relative efficiencies while Table 4 indicates that the performance of the proposed exponential estimator is better than the Singh and Vishwakarma [29], Singh, et al. [32], Noor-ul-Amin and Hanif [20] and Sanaullah, et al. [33] for all the simulated populations based on their mean square errors. The estimator with higher relative efficiency and least mean square error is considered to be more efficient. It can be clearly observed from Table 3 and Table 4 that the relative efficiency of our proposed estimator is higher for all real populations and its mean square error is minimum in all simulation studies. This proves our proposed estimator to be an efficient estimator.
5.
Conclusion
An exponential type ratio estimator in two-phase sampling has been proposed, which obtains mean square error by involving two auxiliary variables. The main purpose of this study is to compare the efficiency of our proposed estimator with some of the existing exponential estimators. MSE equation of our proposed estimator has been derived theoretically and its efficiency has been checked through different simulations and datasets of different populations from different fields. The percent relative efficacies values obtained from table-3 are (502.5515), (355.1199), (247.3183), (390.9441) and (279.0334), which are highest for all the populations proving our proposed estimator to be most efficient estimator in this study. Sanaullah, et al. [33]
“Ratio Estimator” appears as the second most efficient estimator in term of relative efficiencies for all populations except population 5. Subsequently, looking on the predominance nature of our proposed estimator, we suggest its use for its practical applications especially in the field of environment, engineering and biological sciences.
Acknowledgement
The authors would like to thank Dr. Olga Korosteleva of California State University, Long Beach for valuable feedback on this work. We also would like to thank the referees for their productive suggestions on the paper.
Conflicts of interest
The authors have no conflict of interest.
Acknowledgments
Imam Khomeini International University (Qazvin), Cellular and Molecular Research Center, Qazvin University of Medical Sciences are gratefully acknowledged.
Conflict of interest
The authors declare no conflict of interest.
References
[1]
Lind T, Siegbahn PEM, Crabtree RH (1999) A quantum chemical study of the mechanism of tyrosine. J Phys Chem B 103: 1193-1202.
[2]
Nokinsee D, Shank L, Lee VS, et al. (2015) Estimation of inhibitory effect against tyrosinase activity through homology modeling and molecular docking. Enzyme Res .
[3]
Ismaya WT, Rozeboom HJ, Weijn A, et al. (2011) Crystal structure of Agaricus bisporus mushroom tyrosinase: identity of the tetramer subunits and interaction with tropolone. Biochemistry 50: 5477-5486.
[4]
Matoba Y, Kihara S, Bando N, et al. (2018) Catalytic mechanism of the tyrosinase reaction toward the Tyr98 residue in the caddie protein. PLoS Biol 16: e3000077.
[5]
Murray AF (2016) Tyrosinase Inhibitors Identified from Phytochemicals and Their Mechanism of Control Berkeley.
[6]
Gou L, Lee J, Hao H, et al. (2017) The effect of oxaloacetic acid on tyrosinase activity and structure: Integration of inhibition kinetics with docking simulation. Int J Biol Macromol 101: 59-66.
[7]
Chang TS (2009) An updated review of tyrosinase inhibitors. Int J Mol Sci 10: 2440-2475.
[8]
Kim YJ, Uyama H (2005) Tyrosinase inhibitors from natural and synthetic sources: structure, inhibition mechanism and perspective for the future. Cell Mol Life Sci 62: 1707-1723.
[9]
Rho HS, Ahn SM, Lee BC, et al. (2010) Changes in flavonoid content and tyrosine inhibitory activity in kenaf leaf extract after far-infrared treatment. Bioorg Med Chem Lett 20: 7534-7536.
[10]
Da Hae G, Jo JM, Kim SY, et al. (2019) Tyrosinase inhibitors from natural source as skin-whitening agents and the application of edible insects: A mini review. Inter J Clin Nutr Diet 5.
[11]
Chang TS (2009) An updated review of tyrosinase inhibitors. J Molecul Sci 10: 2440-2475.
[12]
Glatz JFC, Börchers T, Spener F, et al. (1995) Fatty acids in cell signalling: modulation by lipid binding proteins. Prostag, Leukotr Ess 52: 121-127.
[13]
Mainini F, Contini A, Nava D, et al. (2013) Synthesis, molecular characterization and preliminary antioxidant activity evaluation of quercetin fatty esters. J Am Oil Chemists' Soc 90: 1751-1759.
[14]
Simopoulos AP (2002) Omega-3 fatty acids in inflammation and autoimmune diseases. J Am Coll Nutr 21: 495-505.
[15]
Johnson M, Bradford C (2014) Omega-3, omega-6 and omega-9 fatty acids: implications for cardiovascular and other diseases. J Glycomics Lipidomics 4: 2153-0637.
[16]
Ando H, Wen ZM, Kim HY, et al. (2006) Intracellular composition of fatty acid affects the processing and function of tyrosinase through the ubiquitin–proteasome pathway. Biochem J 394: 43-50.
[17]
Richards LB, Li M, van Esch BCAM, et al. (2016) The effects of short-chain fatty acids on the cardiovascular system. Pharma Nutrition 4: 68-111.
[18]
Khan F, Niaz K, Maqbool F, et al. (2016) Molecular targets underlying the anticancer effects of quercetin: an update. Nutrients 8: 529.
[19]
Warnakulasuriya SN, Rupasinghe HP (2014) Long chain fatty acid acylated derivatives of quercetin-3-O-glucoside as antioxidants to prevent lipid oxidation. Biomolecules 4: 980-993.
[20]
Jamali Z, Rezaei Behbehani G, Zare K, et al. (2019) Effect of chrysin omega-3 and 6 fatty acid esters on mushroom tyrosinase activity, stability, and structure. J Food Biochem 43: e12728.
[21]
Ashraf Z, Rafiq M, Seo SY, et al. (2015) Synthesis, kinetic mechanism and docking studies of vanillin derivatives as inhibitors of mushroom tyrosinase. Bioorgan Med Chem 23: 5870-5880.
[22]
Hassani S, Haghbeen K, Fazli M (2016) Non-specific binding sites help to explain mixed inhibition in mushroom tyrosinase activities. EurJ Med Chem 122: 138-148.
[23]
Li ZC, Chen LH, Yu XJ, et al. (2010) Inhibition kinetics of chlorobenzaldehyde thiosemicarbazones on mushroom tyrosinase. J Agr Food Chem 58: 12537-12540.
[24]
Trott O, Olson AJ (2010) AutoDock Vina: improving the speed and accuracy of docking with a new scoring function, efficient optimization, and multithreading. J Comput Chem 31: 455-461.
[25]
Matoba Y, Kihara S, Bando N, et al. (2018) Catalytic mechanism of the tyrosinase reaction toward the Tyr98 residue in the caddie protein. PLoS Biol 16: e3000077.
[26]
Studio A D (2006) 1.7 San Diego, CA, USA: Accelrys Software Inc..
[27]
Mazhab-Jafari MT, Marshall CB, Smith MJ, et al. (2015) Oncogenic and RASopathy-associated K-RAS mutations relieve membrane-dependent occlusion of the effector-binding site. P Natl Acad Sci 112: 6625-6630.
[28]
Kusumaningrum S, Budianto E, Kosela S, et al. (2014) The molecular docking of 1, 4-naphthoquinone derivatives as inhibitors of Polo-like kinase 1 using Molegro Virtual Docker. J App Sci 4: 47-53.
[29]
Thomsen R, Christensen MH (2006) MolDock: a new technique for high-accuracy molecular docking. J Med Chem 49: 3315-3321.
[30]
Batra J Biophysical studies of protein folding and binding stability (2009) .
[31]
Gheibi N, Saboury AA, Haghbeen K, et al. (2009) Dual effects of aliphatic carboxylic acids on cresolase and catecholase reactions of mushroom tyrosinase. J Enzym Inhib Med Chem 24: 1076-1081.
[32]
Gheibi N, Zavareh SH, Behbahani GRR, et al. App Bioch Microbiol (2016) .52: 304-310.
[33]
Jamkhande PG, Ghante MH, Ajgunde BR (2017) Software based approaches for drug designing and development: a systematic review on commonly used software and its applications. Bulletin of Faculty of Pharmacy, Cairo University 55: 203-210.
[34]
Guo YJ, Pan ZZ, Chen CQ, et al. (2010) Inhibitory effects of fatty acids on the activity of mushroom tyrosinase. Appl Biochem Biotech 162: 1564-1573.
[35]
Lestari SR, Lukiati B, Arifah SN, et al. (2019) Medicinal uses of single garlic in hyperlipidemia by fatty acid synthase enzyme inhibitory: Molecular docking, IOP Conference Series: Earth and Environmental Science IOP Publishing, 012008.
[36]
Monserud JH, Schwartz DK (2012) Effects of molecular size and surface hydrophobicity on oligonucleotide interfacial dynamics. Biomacromolecules 13: 4002-4011.
[37]
Shalbafan M, Behbehani GR, Divsalar A (2018) The effect of methotrexate on the structural changes of human serum. J Ponte 74: 60-67.
[38]
Xue YL, Miyakawa T, Hayashi Y (2011) Isolation and tyrosinase inhibitory effects of polyphenols from the leaves of persimmon, Diospyros kaki. J Agr Food Chem 59: 6011-6017.
[39]
McDonnell JR, Reynolds RG, Fogel DB Docking conformationally flexible small molecules into a protein binding site through evolutionary programming (1995) .
[40]
Thomsen R, Christensen MH (2006) MolDock: A new technique for high-accuracy molecular docking. J Med Chem 49: 3315-3321.
[41]
Baek HS, Rho HS, Yoo JW, et al. (2008) The inhibitory effect of new hydroxamic acid derivatives on melanogenesis. B Korean Chem Soc 29: 43-46.
[42]
Kim YJ, Kang KS, Yokozawa T (2008) The anti-melanogenic effect of pycnogenol by its anti-oxidative actions. Food Chem Toxicol 46: 2466-2471.
[43]
Panich U, Pluemsamran T, Wattanarangsan J, et al. (2013) Protective effect of AVS073, a polyherbal formula, against UVA-induced melanogenesis through a redox mechanism involving glutathione-related antioxidant defense. BMC Complem Altern M 13: 1-10.
This article has been cited by:
1.
Hatice Oncel Cekim, Cem Kadilar,
ln-Type Variance Estimators in Simple Random Sampling,
2020,
2220-5810,
689,
10.18187/pjsor.v16i4.3072
2.
Tolga Zaman, Cem Kadilar,
Exponential ratio and product type estimators of the mean in stratified two-phase sampling,
2021,
6,
2473-6988,
4265,
10.3934/math.2021252
3.
Subhash Kumar Yadav, Diksha Arya, Gajendra K. Vishwakarma, Mukesh Kumar Verma,
Generalized Ratio-Cum-Exponential-Log Ratio Type Estimators of Population Mean under Simple Random Sampling Scheme,
2023,
44,
1995-0802,
3889,
10.1134/S1995080223090445
4.
Jing Wang, Sohaib Ahmad, Muhammad Arslan, Showkat Ahmad Lone, A.H. Abd Ellah, Maha A. Aldahlan, Mohammed Elgarhy,
Estimation of finite population mean using double sampling under probability proportional to size sampling in the presence of extreme values,
2023,
9,
24058440,
e21418,
10.1016/j.heliyon.2023.e21418
The number of pieces of the stems, out of 50, planted in each plot.
The number of diseased shoots.
The total number of shoots in each plot.
The data were kindly supplied by Dr. C.G.B. Demetrio of Escola Superior de Agricultura, Universidade de Sao Paolo, Brazil
2
Conductivity
Magnesium in me/100gm
Bulk density in gm
Khattree, R., and Naik, D. N. (2000) Multivariate Data Reduction and Discrimination with SAS Software. SAS Institute.
3
Random variable non-dimensional
Pressure (from Chievres weather station), in mm Hg
Humidity outside (from Chievres weather station)
University of Mons (UMONS).
4
Ozone
Radiation
Temperature
Bruntz, S. M., W. S. Cleveland, B. Kleiner, and J. L. Warner. (1974). The Dependence of Ambient Ozone on Solar Radiation, Wind, Temperature, and Mixing Height. In Symposium on Atmospheric Diffusion and Air Pollution, pages 125–128. American Meterological Society, Boston.
5
Net hourly electrical energy output
Ambient Pressure (AP) in the range 992.89-1033.30 milibar
Relative Humidity (RH) in the range 25.56% to 100.16%
Faculty of Engineering, Namık Kemal University, Turkey
Pop.
N
n1
n2
ˉX
ˉY
ˉZ
Cy
Cx
Cz
ρxy
ρyz
ρxz
1
180
79
33
11.94
20.26
118.14
1.21
0.54
0.37
0.08
0.34
0.40
2
48
21
15
8.4646
6.5885
1.3158
0.5989
0.1599
0.1653
0.5083
0.7626
0.4901
3
19735
9000
5000
79.7
24.9
42.9
0.580
0.186
0.121
0.020
0.004
0.4873
4
111
37
17
184.80
42.099
77.792
0.7868
0.4910
0.1219
0.3483
0.6985
0.2940
5
9571
1000
700
1013.2
454.3
73.3
0.037
0.005
0.199
0.514
0.389
0.099
S.#
Estimators
Pop1
Pop2
Pop3
Pop4
Pop5
1
ˆˉY
100.000
100.000
100.000
100.000
100.000
2
ˆˉYSV
*
100.6738
*
*
169.3055
3
ˆˉYS
100.4436
112.0270
100.025
108.3955
184.5887
4
ˆˉYNH
107.1621
122.0960
*
107.1865
*
5
ˆˉYSA
113.6877
147.9260
102.0920
143.2637
150.0283
6
ˆYkc
465.0547
301.3585
247.1565
322.2064
238.6583
7
ˆˉYg(1)∗∗
502.5515
355.1199
247.3330
390.9441
279.0334
*Percent Relative Efficiency is less than 100.
Estimators
Simulation I n1=10000n2=5000
Simulation II n1=5000n2=2000
Simulation III n1=12500n2=3750
MSE(ˉY(1)∗∗g)
0.007342740
0.01482553
0.008580045
MSE(ˉYsv)
0.007763214
0.01609473
0.008786188
MSE(ˉYs)
0.014134104
0.03650642
0.019750622
MSE(ˉYNH)
0.020980778
0.06862683
0.039805696
MSE(ˉYSA)
0.021681391
0.07091925
0.041749114
Figure 1. The chemical structure of quercetin-7-Linoleate (ligand I) and quercetin-7-Oleate (ligand II)
Figure 2. FT-IR spectra comparison between before (a) and after (b) esterification.
Figure 3. Cavities of MT and the positions of ligand I in tunnel No.4 (site C) and ligand II in tunnel No.3 (site B).
Figure 4. Thermal denaturation profiles, monitored by fluorescence emission (at 330 nm) in concentration of 0.2 mg/ml MT solution in absence and presence of 0.06 mM ligands at pH 6.8.
Figure 5. The standard Gibbs free energy changes (ΔGdo) for thermal denaturation of pure MT, MT+ligand I and MT+ligand II.
Figure 6. Lineweaver–Burk plots for competitive inhibition of MT with L-DOPA as substrate and 40 unit of the MT. The reaction was performed in 10 mM PBS, pH = 6.8, at 298 K, in absence and presence of different concentrations of ligand I (0, 0.02, 0.06 and 0.1 mM).
Figure 7. Lineweaver–Burk plots for inhibition of MT with L-DOPA as substrate and 40 unit of the enzyme. The reaction was performed in 10 mM PBS, pH = 6.8, at 298 K, in absence and presence of different concentrations of ligand II (0, 0.02, 0.06 and 0.1 mM)
Figure 8. 2D –interactions of the best pose of molecular docking studies of MT with ligand I (a) and ligand II (b) as predicted by ligplot+ analysis.
Figure 9. The ligand–protein 3D-interactions ligand I (a) and ligand II (b) with the mushroom tyrosinase (2y9x) in the binding pocket that generated by using Discovery Studio 4.0. The electrostatics interaction (π-sigma) for ligandII represented as brown dashed lines.
Figure 10. Graphical of the MolDock score for the best pose of MT-liagndI (a) and MT-ligandII (b).
Figure 11. Clear display H-bonds between MT residues and [ligand I (a), ligand II(b)].
Catalog
Abstract
1.
Introduction
2.
Materials and method
2.1. Comparing mathematically ˉYg(1)∗∗ with some existed estimators