We utilized density functional theory (DFT) to investigate the electronic structure and Raman spectrum of Azinphos-methyl (AzM) (C10H12N3O3PS2) both in isolation and in combination with gold nanoclusters (Aun, n = 2, 4, and 6). The research highlights a significant enhancement in Raman activity with increasing gold atom count from AzM-Au2 to AzM-Au4. The DFT calculations provide a comprehensive analysis of various electronic properties, including HOMO and LUMO energies, gap energy (Eg), ionization potential (IP), and electron affinity (EA), comparing these with experimental results from Liu et al. (2012). We also examined reactivity parameters, electrostatic properties, molecular electrostatic potential (MEP), Natural bond orbital (NBO) analysis, and atoms-in-molecules theory (AIM). The binding energy trends among the (AzM)-Aun complexes revealed a hierarchy: (AzM)-Au2 > (AzM)-Au6 > (AzM)-Au4. Monte Carlo simulations were used to explore AzM interactions with gold nanoparticles (AuNPs) of various shapes and sizes, indicating that increased Raman intensity correlates with higher global electrophilicity and total polarizability. The results suggested that the stability of the complexes improves with more gold atoms, as evidenced by greater charge transfer, interaction energies, and second-order stabilization energies (E2). Among the complexes studied, AzM-Au2 showed the highest stability. Monte Carlo simulations revealed that the right circular cone-shaped structure, especially at 7 nm, demonstrated the most negative adsorption energy, indicating stronger adsorption interactions. This research fills a gap in previous studies on AzM, providing valuable insights and serving as a reference for future work.
Citation: Oumaima Douass, Muneerah Mogren Al-Mogren, M'Hamed Touil, Samira Dalbouha, Moustapha Belmouden, Bousselham Samoudi, Santiago Sanchez-cortes. Integrating molecular modeling methods to study the interaction between Azinphos-methyl and gold nanomaterials for environmental applications[J]. AIMS Environmental Science, 2024, 11(5): 776-796. doi: 10.3934/environsci.2024039
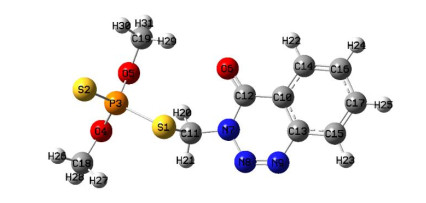
We utilized density functional theory (DFT) to investigate the electronic structure and Raman spectrum of Azinphos-methyl (AzM) (C10H12N3O3PS2) both in isolation and in combination with gold nanoclusters (Aun, n = 2, 4, and 6). The research highlights a significant enhancement in Raman activity with increasing gold atom count from AzM-Au2 to AzM-Au4. The DFT calculations provide a comprehensive analysis of various electronic properties, including HOMO and LUMO energies, gap energy (Eg), ionization potential (IP), and electron affinity (EA), comparing these with experimental results from Liu et al. (2012). We also examined reactivity parameters, electrostatic properties, molecular electrostatic potential (MEP), Natural bond orbital (NBO) analysis, and atoms-in-molecules theory (AIM). The binding energy trends among the (AzM)-Aun complexes revealed a hierarchy: (AzM)-Au2 > (AzM)-Au6 > (AzM)-Au4. Monte Carlo simulations were used to explore AzM interactions with gold nanoparticles (AuNPs) of various shapes and sizes, indicating that increased Raman intensity correlates with higher global electrophilicity and total polarizability. The results suggested that the stability of the complexes improves with more gold atoms, as evidenced by greater charge transfer, interaction energies, and second-order stabilization energies (E2). Among the complexes studied, AzM-Au2 showed the highest stability. Monte Carlo simulations revealed that the right circular cone-shaped structure, especially at 7 nm, demonstrated the most negative adsorption energy, indicating stronger adsorption interactions. This research fills a gap in previous studies on AzM, providing valuable insights and serving as a reference for future work.

| [1] | Azinphos-methyl. Available from: https://webbook.nist.gov/cgi/inchi?ID = C86500 & Mask = 80. |
| [2] |
Singha DK, Majee P, Mondal SK, et al. (2017) Highly selective aqueous phase detection of Azinphos-methyl pesticide in ppb level using a cage-connected 3D MOF. ChemistrySelect 2: 5760–5768. https://doi.org/10.1002/slct.201700963 doi: 10.1002/slct.201700963

|
| [3] |
Topsakal A, Midha S, Yuca E, et al. (2021) Study on the cytocompatibility, mechanical and antimicrobial properties of 3D printed composite scaffolds based on PVA/Gold nanoparticles (AuNP)/Ampicillin (AMP) for bone tissue engineering. Mater Today Commun 28: 102458. https://doi.org/10.1016/j.mtcomm.2021.102458 doi: 10.1016/j.mtcomm.2021.102458
|
| [4] |
Yaqoob AA, Ahmad H, Parveen T, et al. (2020) Recent advances in metal decorated nanomaterials and their various biological applications: A review. Front Chem 8: 341. https://doi.org/10.3389/fchem.2020.00341 doi: 10.3389/fchem.2020.00341
|
| [5] |
Hohenester U, Trugler A (2008) Interaction of single molecules with metallic nanoparticles. IEEE J Sel Top Quant 14: 1430–1440. https://doi.org/10.1109/JSTQE.2008.2007918 doi: 10.1109/JSTQE.2008.2007918
|
| [6] |
Douass O, Samoudi B, Bendaou O, et al. (2022) A brief review of recent advances in surface-enhanced Raman spectroscopy and microfluidics technology for the ultrasensitive detection of pesticides. Egypt J Chem 65: 133–150. https://doi.org/10.21608/ejchem.2022.99036.4764 doi: 10.21608/ejchem.2022.99036.4764
|
| [7] |
Ricci M, Becucci M, Castellucci EM (2019) Chemical enhancement in the SERS spectra of indigo: DFT calculation of the Raman spectra of indigo-Ag14 complexes. Vib Spectrosc 100: 159–166. https://doi.org/10.1016/j.vibspec.2018.12.001 doi: 10.1016/j.vibspec.2018.12.001
|
| [8] |
Ricci M, Lofrumento C, Becucci M, et al. (2018) The Raman and SERS spectra of indigo and indigo-Ag2 complex: DFT calculation and comparison with experiment. Spectrochim Acta A 188: 141–148. https://doi.org/10.1016/j.saa.2017.06.036 doi: 10.1016/j.saa.2017.06.036
|
| [9] |
Hanley S, Giasson J, Revol J, et al. (1992) Atomic force microscopy of cellulose microfibrils: Comparison with transmission electron microscopy. Polymer 33: 4639–4642. https://doi.org/10.1016/0032-3861(92)90426-W doi: 10.1016/0032-3861(92)90426-W
|
| [10] | Basis sets. Available from: https://gaussian.com/basissets/. |
| [11] |
Iranpour M, Fazaeli R, Sadjadi MS, et al. (2019) Natural bond orbital (NBO) and quantum theory of atoms in molecules (QTAIM) analyses of iron-substituted borirene and boryl isomers. Russ J Inorg Chem+ 64: 472–477. https://doi.org/10.1134/S0036023619040107 doi: 10.1134/S0036023619040107
|
| [12] |
Paquet E, Viktor HL (2015) Molecular dynamics, Monte Carlo simulations, and Langevin dynamics: A computational review. Biomed Res Int 2015: 1–18. https://doi.org/10.1155/2015/183918 doi: 10.1155/2015/183918
|
| [13] |
El-Mageed HRA, Taha M (2019) Exploring the intermolecular interaction of serine and threonine dipeptides with gold nanoclusters and nanoparticles of different shapes and sizes by quantum mechanics and molecular simulations. J Mol Liq 296: 111903. https://doi.org/10.1016/j.molliq.2019.111903 doi: 10.1016/j.molliq.2019.111903
|
| [14] |
Bhardwaj S, Rai S, Sau TK, et al. (2015) Theoretical studies of Raman scattering properties of methylphosphine and methylamine adsorbed on gold clusters. Vib Spectrosc 76: 38–47. https://doi.org/10.1016/j.vibspec.2014.12.001 doi: 10.1016/j.vibspec.2014.12.001
|
| [15] |
Hariharan A, Kurnoothala R, Chinthakayala SK, et al. (2021) SERS of Dopamine: Computational and experimental studies. Spectrochim Acta A 260: 119962. https://doi.org/10.1016/j.saa.2021.119962 doi: 10.1016/j.saa.2021.119962
|
| [16] |
Hariharan A, Vadlamudi P (2021) SERS of Epinephrine: A computational and experimental study. J Mol Struct 1246: 131163. https://doi.org/10.1016/j.molstruc.2021.131163 doi: 10.1016/j.molstruc.2021.131163
|
| [17] |
Hariharan A, Vadlamudi P (2021) SERS of norepinephrine: A computational and experimental study. Mater Today Commun 27: 102429. https://doi.org/10.1016/j.mtcomm.2021.102429 doi: 10.1016/j.mtcomm.2021.102429
|
| [18] |
Buglak AA, Kononov AI (2022) Silver cluster interactions with Pterin: Complex structure, binding energies and spectroscopy. Spectrochim Acta A 279: 121467. https://doi.org/10.1016/j.saa.2022.121467 doi: 10.1016/j.saa.2022.121467
|
| [19] |
Yao G, Huang Q (2018) DFT and SERS study of L-cysteine adsorption on the surface of gold nanoparticles. J Phys Chem C 122: 15241–15251. https://doi.org/10.1021/acs.jpcc.8b00949 doi: 10.1021/acs.jpcc.8b00949
|
| [20] |
Miranda MM, Miranda FM, Menziani MC, et al. (2023) Can DFT calculations provide useful information for SERS applications? Molecules 28: 573. https://doi.org/10.3390/molecules28020573 doi: 10.3390/molecules28020573
|
| [21] |
Erickson CB (2018) Comparison of Gaussian process modeling software. Eur J Oper Res. 266: 179–192. https://doi.org/10.1016/j.ejor.2017.10.002 doi: 10.1016/j.ejor.2017.10.002
|
| [22] |
Hill JG (2013) Gaussian basis sets for molecular applications. Int J Quantum Chem 113: 21–34. https://doi.org/10.1002/qua.24355 doi: 10.1002/qua.24355
|
| [23] |
Lu L, Hu H, Hou H, et al. (2013) An improved B3LYP method in the calculation of organic thermochemistry and reactivity. Comput Theor Chem 1015: 64–71. https://doi.org/10.1016/j.comptc.2013.04.009 doi: 10.1016/j.comptc.2013.04.009
|
| [24] |
Goldsmith BR, Florian J, Liu JX, et al. (2019) Two-to-three dimensional transition in neutral gold clusters: The crucial role of van der Waals interactions and temperature. Phys Rev Mater 3: 016002. https://doi.org/10.1103/PhysRevMaterials.3.016002 doi: 10.1103/PhysRevMaterials.3.016002
|
| [25] | Origin 2018 feature highlights. Available from: https://www.originlab.com/2018. |
| [26] | Parr RG, Weitao Y (1994) Density-functional theory of atoms and molecules, Oxford University Press. https://doi.org/10.1093/oso/9780195092769.001.0001 |
| [27] | Electrophilicity. Available from: https://www.sciencedirect.com/topics/chemistry/electrophilicity. |
| [28] |
Kjaergaard HG, Bezar KJ, Brooking KA (1999) Calculation of dipole moment functions with density functional theory: Application to vibrational band intensities. Mol Phys 96: 1125–1138. https://doi.org/10.1080/00268979909483055 doi: 10.1080/00268979909483055
|
| [29] |
Adamo C, Cossi M, Scalmani G, et al. (1999) Accurate static polarizabilities by density functional theory: Assessment of the PBE0 model. Chem Phys Lett 307: 265–271. https://doi.org/10.1016/S0009-2614(99)00515-1 doi: 10.1016/S0009-2614(99)00515-1
|
| [30] |
Linko R, Ryabov M, Strashnov P, et al. (2021) Charge transfer complexes of 1, 3, 6-Trinitro-9, 10-phenanthrenequinone with polycyclic aromatic compounds. Molecules 26: 6391. https://doi.org/10.3390/molecules26216391 doi: 10.3390/molecules26216391
|
| [31] |
Drissi M, Benhalima N, Megrouss Y, et al. (2015) Theoretical and experimental electrostatic potential around the m-nitrophenol molecule. Molecules 20: 4042–4054. https://doi.org/10.3390/molecules20034042 doi: 10.3390/molecules20034042
|
| [32] | Hernandez B, Luque FJ, Orozco M Mixed QM/MM molecular electrostatic potentials. J Comput Aid Mol Des 14: 329–339. |
| [33] |
Ikeda A, Nakao Y, Sato H, et al. (2007) Binding energy of Transition-metal complexes with large π-conjugate systems. Density functional theory vs Post-Hartree-Fock methods. J Phys Chem A 111: 7124–7132. https://doi.org/10.1021/jp0708648 doi: 10.1021/jp0708648
|
| [34] |
Glendening ED, Landis CR, Weinhold F (2012) Natural bond orbital methods. WIRES Comput Mol Sci 2: 1–42. https://doi.org/10.1002/wcms.51 doi: 10.1002/wcms.51
|
| [35] |
Lu T, Chen F (2012) Multiwfn: A multifunctional wavefunction analyzer. J Comput Chem 33: 580–592. https://doi.org/10.1002/jcc.22885 doi: 10.1002/jcc.22885
|
| [36] |
Bourzi H, Oukhrib R, Ibrahimi BE, et al. (2020) Understanding of anti-corrosive behavior of some tetrazole derivatives in acidic medium: Adsorption on Cu (111) surface using quantum chemical calculations and Monte Carlo simulations. Surf Sci 702: 121692. https://doi.org/10.1016/j.susc.2020.121692 doi: 10.1016/j.susc.2020.121692
|
| [37] |
Taha M, Lee MJ (2020) Influence of the alanine side-chain methyl group on the peptide-gold nanoparticles interactions. J Mol Liq 302: 112528. https://doi.org/10.1016/j.molliq.2020.112528 doi: 10.1016/j.molliq.2020.112528
|
| [38] |
Sun H, Jin Z, Yang C, et al. (2016) COMPASS Ⅱ: Extended coverage for polymer and drug-like molecule databases. J Mol Model 22: 47. https://doi.org/10.1007/s00894-016-2909-0 doi: 10.1007/s00894-016-2909-0
|
| [39] |
Ahmad ZU, Chao B, Konggidinata MI, et al. (2018) Molecular simulation and experimental validation of resorcinol adsorption on ordered mesoporous carbon (OMC). J Hazard Mater 354: 258–265. https://doi.org/10.1016/j.jhazmat.2018.04.072 doi: 10.1016/j.jhazmat.2018.04.072
|
| [40] | Materials Studio: Modules Tutorials. |
| [41] |
Kikuchi K, Yoshida M, Maekawa T, et al. (1991) Metropolis Monte Carlo method as a numerical technique to solve the Fokker—Planck equation. Chem Phys Lett 185: 335–338. https://doi.org/10.1016/S0009-2614(91)85070-D doi: 10.1016/S0009-2614(91)85070-D
|
| [42] |
Liu B, Zhou P, Liu X, et al. (2013) Detection of pesticides in fruits by surface-enhanced Raman spectroscopy coupled with gold nanostructures. Food Bioprocess Tech 6: 710–718. https://doi.org/10.1007/s11947-011-0774-5 doi: 10.1007/s11947-011-0774-5
|
| [43] | GaussView, Version 6, Dennington, Roy. Semichem Inc Shawnee Mission KS. |
| [44] |
Hazim A, Abduljalil HM, Hashim A (2020) Structural, spectroscopic, electronic and optical properties of novel Platinum doped (PMMA/ZrO2) and (PMMA/Al2O3) nanocomposites for electronics devices. Trans Electr Electro 21: 550–563. https://doi.org/10.1007/s42341-020-00210-2 doi: 10.1007/s42341-020-00210-2
|
| [45] |
Taha M, Abd El-Mageed HR, Lee MJ (2021) DFT study of cyclic glycine-alanine dipeptide binding to gold nanoclusters. J Mol Graph Model 103: 107823. https://doi.org/10.1016/j.jmgm.2020.107823 doi: 10.1016/j.jmgm.2020.107823
|
| [46] |
Ly NH, Nguyen TH, Nghi NĐ, et al. (2019) Surface-enhanced Raman scattering detection of fipronil pesticide adsorbed on silver nanoparticles. Sensors 19: 1355. https://doi.org/10.3390/s19061355 doi: 10.3390/s19061355
|
| [47] |
Lang XF, Yin PG, Tan EZ, et al. (2013) Theoretical investigation on surface-enhanced Raman evidence for conformation transition of dimercaptoazobenzene adsorbed on gold nanoclusters. J Raman Spectrosc 44: 425–432. https://doi.org/10.1002/jrs.4217 doi: 10.1002/jrs.4217
|
| [48] |
Oukhrib R, Abdellaoui Y, Berisha A, et al. (2021) DFT, Monte Carlo and molecular dynamics simulations for the prediction of corrosion inhibition efficiency of novel pyrazolyl nucleosides on Cu (111) surface in acidic media. Sci Rep 11: 3771. https://doi.org/10.1038/s41598-021-82927-5 doi: 10.1038/s41598-021-82927-5
|


Figures(8) / Tables(10)

Oumaima Douass, Muneerah Mogren Al-Mogren, M'Hamed Touil, Samira Dalbouha, Moustapha Belmouden, Bousselham Samoudi, Santiago Sanchez-cortes. Integrating molecular modeling methods to study the interaction between Azinphos-methyl and gold nanomaterials for environmental applications[J]. AIMS Environmental Science, 2024, 11(5): 776-796. doi: 10.3934/environsci.2024039


 DownLoad: