Figure 1.
Influence of ownership on the reciprocal connection between bank capital and COFI.


This study investigated the simultaneous association between capital and the cost of financial intermediation (COFI) by bridging the gap of ownership effects on the nexus between capital and COFI. This study revealed several significant insights by using data from 44 commercial banks in Bangladesh between 2010 and 2021 and applying two-step system generalized methods of moments (2SGMM). First, a significant nonlinear bidirectional relationship exists between bank capital and COFI. The tendency to generate average and low COFI enables banks to acquire more capital than those with high COFI. In contrast, banks with high and average capital bases can maximize their COFI compared to low ones. Second, state-owned and conventional commercial banks are better positioned to source more capital. However, state-owned and Islamic commercial banks can strengthen the inverted U-shaped relationship between COFI and bank capital than private-owned and Islamic commercial banks. Finally, state-owned commercial banks do not experience the same benefits in COFI from capital increases as privately owned banks. Unlike Islamic commercial banks, conventional banks generate more COFI in the long run as capital rises. The findings provide helpful insights into shaping policy and regulations regarding emerging country's banking systems, especially capital, COFI, and ownership policies.
Citation: Changjun Zheng, Md Mohiuddin Chowdhury, Anupam Das Gupta. Investigating the influence of ownership on the relationship between bank capital and the cost of financial intermediation[J]. Data Science in Finance and Economics, 2024, 4(3): 388-421. doi: 10.3934/DSFE.2024017
| [1] | Changjun Zheng, Md Abdul Mannan Khan, Mohammad Morshedur Rahman, Shahed Bin Sadeque, Rabiul Islam . The impact of monetary policy on banks' risk-taking behavior in an emerging economy: The role of Basel II. Data Science in Finance and Economics, 2023, 3(4): 427-451. doi: 10.3934/DSFE.2023024 |
| [2] | Mesbaul Haque Sazu, Sakila Akter Jahan . Impact of blockchain-enabled analytics as a tool to revolutionize the banking industry. Data Science in Finance and Economics, 2022, 2(3): 275-293. doi: 10.3934/DSFE.2022014 |
| [3] | Farooq Ahmad Bajwa, Jingtao Fu, Ishtiaq Ahmad Bajwa, Manzar Rehman, Karim Abbas . Digital financial inclusion and its dual impact on economic and environmental outcomes in ASEAN countries. Data Science in Finance and Economics, 2025, 5(1): 53-75. doi: 10.3934/DSFE.2025004 |
| [4] | Yen H. Hoang, Duong T.T. Nguyen, Linh H.T. Tran, Nhung T.H. Nguyen, Ngoc B. Vu . Customers' adoption of financial services offered by banks and fintechs partnerships: evidence of a transitional economy. Data Science in Finance and Economics, 2021, 1(1): 77-95. doi: 10.3934/DSFE.2021005 |
| [5] | Dominic Joseph . Estimating credit default probabilities using stochastic optimisation. Data Science in Finance and Economics, 2021, 1(3): 253-271. doi: 10.3934/DSFE.2021014 |
| [6] | Ehsan Ahmadi, Parastoo Mohammadi, Farimah Mokhatab Rafei, Shib Sankar Sana . Behavioral factors and capital structure: identification and prioritization of influential factors. Data Science in Finance and Economics, 2025, 5(1): 76-104. doi: 10.3934/DSFE.2025005 |
| [7] | Maria Paola Priola, Annalisa Molino, Giacomo Tizzanini, Lea Zicchino . The informative value of central banks talks: a topic model application to sentiment analysis. Data Science in Finance and Economics, 2022, 2(3): 181-204. doi: 10.3934/DSFE.2022009 |
| [8] | Xinying Zhang, Chuanjun Zhao, Xianwei Zhou, Xiaojun Wu, Ying Li, Meiling Wu . Capital market and public health emergencies in Chinese sports industry based on a market model. Data Science in Finance and Economics, 2023, 3(2): 112-132. doi: 10.3934/DSFE.2023007 |
| [9] | Kuo-Shing Chen . Interlinkages between Bitcoin, green financial assets, oil, and emerging stock markets. Data Science in Finance and Economics, 2024, 4(1): 160-187. doi: 10.3934/DSFE.2024006 |
| [10] | Angelica Mcwera, Jules Clement Mba . Predicting stock market direction in South African banking sector using ensemble machine learning techniques. Data Science in Finance and Economics, 2023, 3(4): 401-426. doi: 10.3934/DSFE.2023023 |
This study investigated the simultaneous association between capital and the cost of financial intermediation (COFI) by bridging the gap of ownership effects on the nexus between capital and COFI. This study revealed several significant insights by using data from 44 commercial banks in Bangladesh between 2010 and 2021 and applying two-step system generalized methods of moments (2SGMM). First, a significant nonlinear bidirectional relationship exists between bank capital and COFI. The tendency to generate average and low COFI enables banks to acquire more capital than those with high COFI. In contrast, banks with high and average capital bases can maximize their COFI compared to low ones. Second, state-owned and conventional commercial banks are better positioned to source more capital. However, state-owned and Islamic commercial banks can strengthen the inverted U-shaped relationship between COFI and bank capital than private-owned and Islamic commercial banks. Finally, state-owned commercial banks do not experience the same benefits in COFI from capital increases as privately owned banks. Unlike Islamic commercial banks, conventional banks generate more COFI in the long run as capital rises. The findings provide helpful insights into shaping policy and regulations regarding emerging country's banking systems, especially capital, COFI, and ownership policies.
Abbreviations: 2SGMM: Two-step system generalized methods of moments; BSD: Banking sector development; CAR: Capital adequacy ratio; COFI: Cost of financial intermediation; ECTA: Eligible capital to total assets; GDP: Gross domestic product; ID: Income diversification; LLPTL: Loan loss provision to total loan; LSDV: Least square dummy variable; NLTA: Net loan to total assets; OLS: Ordinary least squares; OWNI: Islamic ownership; OWNP: Private ownership; ROA: Ratio of net income to total assets
Financing through capital is typically more expensive than other alternatives for banks. Again, the financial intermediation cost is the prime concern of banks to ensure profitability and long-run sustainability. However, regulatory compliance requires that banks have sufficient capital. Banks, as the financial intermediary, epitomize the focal conduit for moving capital (Otero et al., 2020) from supply units with an interest charge to deficit units by charging an interest margin in the global economy and economic system (Gupta et al., 2021). The global downturn of 2007–2008 severely hampered financial intermediation (Gertler et al., 2012). In response to the economic downturn, regulators worldwide made significant efforts to foster a functional banking system (Berger et al., 2021). This is because a well-functioning baking system promotes the expansion and enhancement of the economy (Levine, 1997). Regulatory authorities always strive to maintain and rebuild public trust in the country's financial system by implementing traditional and novel strategies to increase bank liquidity by emphasizing capital development (Lazopoulos, 2013). So, banks constantly strive to establish and maintain an optimal capital structure to maximize profit margins (Mehzabin et al., 2023) and firm value (Modigliani & Miller, 1958).
In a frictionless world, capital requirements begin with the market's imperfections (Modigliani & Miller, 1958). Although information plays a vital role in a perfectly competitive market situation, complete information consisting of a perfect market concept is impossible (Berger et al., 1995). Again, capital structure theories elucidate that the escalation of equity as a source of financing amplifies the weighted average cost of capital, which is knotted to the rising COFI to recoup the higher cost of capital (Rahman et al., 2018), and capital structure is influenced by both ownership structure and agency costs (Pushner, 1995).
Again, research evidenced that equity capital strengthens shareholder value by boosting investment projects' net worth while minimizing business risks (Gitman & Zutter, 2015). Higher capital requirements can enhance social efficiency by decreasing bank fragility (Archarya et al., 2012), leading to a higher COFI (Huang et al., 2019). Again, increasing capital requirements decreases shareholders' surpluses because of the need to search for deposit financing as the substitute for equity, forcing banks to increase the COFI to maintain the profitability level of the bank (Demirgüç-Kunt & Huizinga, 1999). Charging a higher COFI indicates inefficiency (Peia & Vranceanu, 2018), imperfect competition (Shawtari et al., 2019), poor information sharing, an inadequate legal environment of the business, and suboptimal risk management (Claeys & Vander Vennet, 2008). However, higher COFI, on the contrary, might provide an additional cushion against adverse shocks, resulting in increased profitability and a stable capital foundation for the banking system (Barajas et al., 2000), and for less developed nations, a relatively higher net interest margin is required for business viability through financial instability protection (Gorton & Winton, 1998).
Understanding the simultaneous relationship between bank capital and COFI is vital for policymakers and banking institutions. Despite the extensive literature on bank capital and COFI, there is a notable gap regarding the influence of ownership on this relationship. Different types of banks—state-owned, privately owned, conventional, and Islamic—operate under unique frameworks and regulatory environments, which may lead to varying capital requirements and COFI affairs. Moreover, this investigation centers on Bangladesh's emerging economy. Emerging nations are vital to the growth of the global economy (Bock & Demyanets, 2012), and their governments are profoundly dependent on bank finance to support their economic expansion (Vo, 2018). Like many other countries, Bangladesh's economy is mainly centered around commercial banking institutions (Gupta & Yesmin, 2022), indicating its status as a developing nation with a bank-based economy (Gupta & Sharma, 2023). This study aims to fill this gap by investigating how ownership impacts the relationship between bank capital and COFI, with potential implications for regulatory policies and banking strategies.
This research is significant for several reasons. First, it comprehensively analyzes how different ownership types affect the relationship between bank capital and the COFI, offering valuable insights for regulators and policymakers. By understanding these relationships, regulators can design more effective capital adequacy frameworks that account for ownership-specific characteristics. Second, the findings can help banking institutions balance capital and COFI based on different categories of COFI and capital. This enables banks to optimize their capital structures and COFI-generating tendencies, improving their performance. Finally, this study contributes to the academic literature by providing empirical evidence from an emerging economy, enriching the global understanding of banking practices.
Through analyzing debates and available literature, we intend to address the following inquiries: (ⅰ) How do capital and the cost of financial intermediation (COFI) mutually impact each other simultaneously, including any nonlinear effects? (ⅱ) Do private commercial banks and Islamic commercial banks have a significant effect on bank capital and COFI? And (ⅲ) How do ownership and COFI (capital) jointly impact the bank capital (COFI)? To address the above research questions, the primary objective of this study is to explore the simultaneous association between bank capital and COFI, with a specific emphasis on the influence of ownership. Using unbalanced panel data of 44 commercial banks in Bangladesh from 2010 to 2021, this study applies a 2SGMM approach, yields robust empirical findings, and provides valuable insights into the banking sector within an emerging market context.
This article makes substantial contributions to the existing literature in multiple ways. First, it employs the 2SGMM method to examine the effect of ownership on the simultaneous relationship between bank capital and the cost of financial intermediation (COFI). This study distinguishes itself from prior research, such as (Gharaibeh, 2023; Gupta et al., 2020; Mujtaba et al., 2021; Rastogi et al., 2021), by contributing a novel perspective to the existing body of knowledge. Second, we include quadratic terms for both capital and COFI to identify any nonlinearities in their relationship. We conduct a detailed analysis of these dynamics by categorizing capital and COFI into high, low, and average levels and employing dummy variables. Third, we analyze the effect of capital on COFI and vice versa in the context of different ownership structures. This is done by incorporating interaction terms between ownership and the capital ratio, as well as between ownership and the COFI ratio. Fourth, we assess the relevance of various theories, including the agency theory, agency cost hypothesis, charter value hypothesis, political view of government ownership, and social view of government ownership. We empirically examine how these theories manifest in the relationship between bank capital, COFI, and ownership structures in an emerging Asian economy. Finally, our findings extend beyond the specific emerging Asian economy under study, offering valuable insights for other emerging economies with similar economic conditions. This significantly enriches the academic discourse on banking regulation and performance in diverse economic environments.
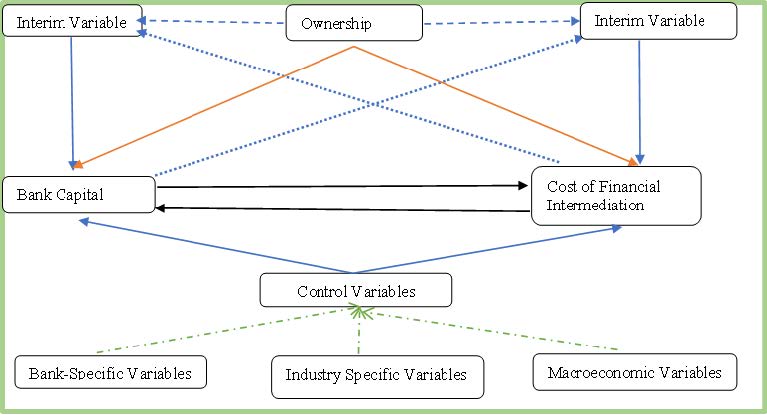
The visual representation of the research's theoretical structure is depicted below in Figure 1.
The rest of the paper is organized into four sections. Sections 2, 3, 4, and 5 encapsulate a literature review, methodology, empirical findings, and conclusion, respectively.
This segment covers a detailed literature analysis on capital, COFI, and ownership. Initially, we will show the theoretical bases of the study, and then, we will delve into studies that explore the association between capital and COFI. Finally, we will examine studies that shed light on the effect of ownership on capital and the COFI.
According to Berle and Means (1932), business owners enlist agents to manage their firms and handle daily operations. However, these agents may misuse company resources for personal gain, leading to a conflict between owners and agents. Ross (1973) identified the agency problem as related to decision-making and the expected outcomes of both principals and agents. The agency cost hypothesis states that having a higher capital ratio can effectively reduce agency costs as it motivates banks to prioritize the interest of shareholders (Berger & Bonaccorsi di Patti, 2006; Jensen & Meckling, 1976). Moreover, the charter value hypothesis suggests that increased efficiency generates economic rents, prompting shareholders to maintain larger equity capital holdings to protect these rents (Berger & Bonaccorsi di Patti, 2006). This hypothesis implies that higher profits motivate bank managers to strengthen capital reserves to mitigate potential liquidation risks (Ahmad & Albaity, 2019).
The dealership model of Ho and Saunder (1981) assumes that banks follow a consistent business strategy irrespective of ownership. However, agency theory posits that the ownership structure is vital in reducing agency conflicts. This is because concentrated ownership enables closer monitoring of managerial behavior, which helps to minimize agency costs (Shleifer & Vishny, 1997). Moreover, the political view of government ownership argues that state-owned banks are used for political purposes, which distorts financial resource allocation and may hinder productivity growth (La Porta et al., 2002; Sapienza, 2004). In contrast, the social view posits that while private banks prioritize profit, state-owned banks focus on financing socially important projects, promoting social development at the expense of profitability (Chen et al., 2016; Sapienza, 2004).
In the aftershock of the financial crisis of 2007–2008, it is widely acknowledged by regulators and government officials alike that boosting capital levels is an essential step toward fortifying the stability and durability of banks (Basel Committee on Banking Supervision, 2009, 2010). Banks tend to operate as inspectors of quality for capital-seeking profitable initiatives in functional economies, guaranteeing greater returns and boosting progress (Dwumfour, 2017). The bank's net interest margin serves as both an indicator of its profitability and COFI (Marinkovic & Radovic, 2010). However, how banks set their COFI has been widely researched in the literature, which started thoroughly from the dealership model of Ho and Saunder (1981). They termed banks as the risk-averse intermediary and opined that the level of risk aversion, transaction magnitude, competition or structure of the market, and interest rate variances are the drivers of COFI. Multiple empirical research has examined and widened the dealership model, utilizing data from a single country or cross-country in the setting of developed and emerging nations (e.g., Allen, 1988; Angbazo, 1997; Cruz-García & Fernández de Guevara, 2019; Entrop et al., 2015; Maudos & Fernández de Guevara, 2004; McShane & Sharpe, 1985; Poghosyan, 2010).
Gupta et al. (2020) conducted a study to analyze the effects of capital on bank performance by using GMM estimation. They opined that well-capitalized banks perform better than low-capitalized banks. Soedarmono and Tarazi (2013) pinpointed the negative connection between the opacity and COFI of banks and opined that higher opacity inversely affects COFI where positively affected by capital. An empirical investigation of Mia (2023) on Bangladeshi commercial banks also finds the influence of capital on COFI. Investigating 32 commercial banks in Bangladesh, Rahman et al. (2018) preached that bank capital ratios have a significant positive relationship with the COFI, meaning that excessive capital needs cause banks to raise COFI. The positive effects of capital on the COFI were also found by Kanapiyanova et al. (2023), Shabir et al. (2023), Moudud-Ul-Huq (2021), Saif-Alyousfi and Saha (2021), and Al-Harbi (2019). Furthermore, research also evidenced a nonlinear relationship between capital and COFI. For instance, Haris et al. (2020) studied the effects of capital on the profitability of Pakistani commercial banks and found a nonlinear inverted U-shaped relationship between capital and COFI. Literature, for example, Ozili and Uadiale (2017) and Puspitasari et al. (2021), evidenced the insignificant impact of capital on COFI. Additionally, research indicates mixed effects of capital on the COFI (Balla & Rose, 2019; Rastogi et al., 2021).
On the other hand, over the past few years, numerous studies have explored the link between COFI and bank capital. According to Rahman et al. (2017), COFI positively impacts capital accumulation, supported by the findings of Moussa (2018). On the other hand, Ahmad et al. (2009) conducted a study in Malaysia between 1995 and 2002, which revealed a significant negative correlation between COFI and capital. This challenges the conventional belief that higher earnings contribute to equity capitalization intended for mitigating risk. Ahmad and Albaity (2019) and Mekonnen (2015) have also reported the negative effects of COFI on capital. However, Raharjo et al. (2014) found the impact of COFI on capital to be statistically insignificant. This lack of substantial association between COFI and bank capital was also observed in the study by Gharaibeh (2023). Furthermore, Aktas et al. (2015) conducted a study that revealed mixed evidence regarding the relationship between COFI and capital accumulation.
Given this ongoing debate, and following the charter value hypothesis, agency theory, and agency cost hypothesis, we assume the following associations between capital and COFI in hypothesis 1.
H1: Cost of financial intermediation (COFI) has a significant positive and nonlinear association with capital.
Ownership structure reflects the benefits of shareholders and managers, significantly impacting an organization's operating and financial performance (Fleming et al., 2005). Banks' propensity to adjust their target capital ratios hinges on whether shareholders possess excess control rights (Lepetit et al., 2015). Moreover, studies advocate that choosing the proper capital structure helps lower agency expenses (Berger & Bonaccorsi di Patti, 2006).
Al-Hares et al. (2013) conducted a study on the quality of capital of Islamic and conventional commercial banks by using the bank-level data of 75 banks in the GCC region. They found that both types of banks in the area seem to fulfill the capitalization standards of Basel Ⅲ, with Islamic banks displaying notably elevated capital ratios compared to their conventional counterparts. The empirical investigation conducted by Jiang et al. (2019) revealed distinctive patterns in target capital ratios across different types of banks. Notably, government-owned banks demonstrate elevated target capital ratios and a more expeditious adjustment of these ratios when juxtaposed with private banks. These findings align with the political perspective, elucidating the government's role in shaping banking dynamics. Furthermore, the authors noted that undercapitalized government-owned banks opt for equity increases. In the examination of the intricate relationship between bank ownership and capital structure, with a focus on variables encompassing the quantum, maturity, and cost of debt, Fernández-Méndez and González (2019) asserted that bank ownership constitutes a substantial determinant in shaping firms' capital structures. Their insights suggest that bank ownership influences debt maturity and cost, consequently mitigating agency costs. Moreover, Mujtaba et al. (2021) opined that ownership concentration is positively linked with regulatory capital. Furthermore, government-owned banks play an important role in developing countries' financial systems. Nevertheless, their presence can negatively affect the performance of privately owned banks (Clarke et al., 2005). Iannotta et al. (2013) exposed that government banks are less capitalized than privately owned ones. Again, in GCC countries, state-owned banks outperform private-owned banks, whereas Islamic banks outperform conventional banks (Alshammari, 2022).
Given the diverse perspectives and following the agency theory and political views of state ownership, the following hypothesis is formulated:
H2: Ownership diversity has a significant impact on the capital of banks.
The dealership model, initially proposed by Ho and Saunder (1981), posits that banks adhere to a consistent business strategy regardless of ownership. This model was later scrutinized and expanded upon by Fungáčová and Poghosyan (2011), who introduced the element of ownership structure. Their analysis of bank data from Russia spanning 1999 to 2007 revealed the significant influence of ownership structure on intermediation costs. Additionally, Toumi (2019) emphasized the value of the COFI as a predictive tool, particularly in distinguishing between Islamic and conventional commercial banks.
Gupta et al. (2020) studied ownership, capitalization, and bank performance using GMM estimation for the period 1998–2016 and revealed interesting insights. Notably, private-sector banks in India were found to be more profitable than their public-sector counterparts. Furthermore, the study highlighted the superior performance of small banks over large banks. The findings also indicated that the performance of public sector banks is less responsive to certain factors than private sector banks. Al-Hares et al. (2013) provided further evidence, showing that Islamic banks, despite lower efficiency, demonstrated higher solvency, profitability, liquidity, and internal growth rates than conventional banks. They also outperformed conventional banks during the global financial crisis of 2006–2009, attributed to their superior capitalization and liquidity reserves and more robust growth across most GCC countries. Rastogi et al. (2021) categorized ownership structures in banking into three groups: institutional ownership, promoter shareholder ownership, and retail investor ownership. Their study revealed that promoter shareholder ownership had significant positive effects on COFI, while institutional ownership had significant adverse effects on COFI. In contrast, retail investor shareholder ownership did not significantly impact COFI.
Given the diverse perspectives and following the agency theory and social views of state ownership, the following hypothesis is formulated:
H3: Ownership diversity has a significant positive effect on COFI.
Moreover, we also formulated the following hypothesis to show the effects of ownership on the relationship between bank capital and the COFI.
H4: The joint effects of ownership and COFI (capital) significantly impact the capital (COFI).
This section delineates the data and variables utilized in the study and the techniques implemented for the empirical analysis.
We collected bank-level data from audited financial statements of respective banks' websites from 2010 to 2021. Additionally, industry-level and macroeconomic data were obtained from the World Bank dataset. The dataset includes detailed financial statements, covering balance sheets and income statements, as well as information on bank ownership types. There are 61 scheduled banks in Bangladesh, including specialized banks, state-owned commercial banks, foreign commercial banks, and private commercial banks (Bangladesh Bank, 2022; Gupta & Yesmin, 2022). All commercial banks were initially included as a sample, but the final sample list was generated using different screening. We excluded foreign commercial and specialized banks due to inconsistent reporting and data unavailability. The remaining banks were categorized by ownership into state-owned, private-owned, conventional, and Islamic banks. Banks not producing annual reports for at least five years were excluded to guarantee data quality and remove extreme outlier values from the dataset.
After implementing the specified filters, the resultant dataset is a robust and comprehensive unbalanced panel of 494 annual observations spanning 44 commercial banks from 2010 to 2021.
The variables used to investigate the relationship between bank capital, COFI, and ownership are shown in detail below:
Following the previous studies of Mehrotra et al. (2023), Abbas et al. (2023), and Mateev et al. (2021), to assess the bank capital, we utilized the eligible capital to total assets ratio to measure bank capital. In addition, we included a quadratic term of this measure to account for possible nonlinearities in the relationship between COFI and bank capital. To further explore the relationship, following the methodology of Tabak et al. (2012) and Mateev and Nasr (2023), we employed capital dummies categorized into three levels: high (≥¯Capital+0.5σCapital), average (>¯Capital−0.5σCapitaland<¯Capital+0.5σCapital), and low (≤¯Capital−0.5σCapital). We have also tested the model's resilience by using the capital adequacy ratio.
The cost of financial intermediation (COFI), often captured by net interest margins, represents the difference between the interest income generated by banks from lending activities and the interest paid to depositors. While net interest margins can be viewed as a measure of bank profitability, they fundamentally represent the cost banks charge for their intermediation services. This cost is the spread between what banks pay for funds (deposits) and what they earn from lending those funds. Previous literature has consistently addressed net interest margins as a proxy for COFI (Gupta et al., 2021; Rahman et al., 2023; Rahman et al., 2018). Thus, COFI reflects the expenses banks incur in facilitating the flow of funds from savers to borrowers. We follow the literature of Gupta et al. (2021) and Rahman et al. (2023) to measure the COFI. We calculate COFI1 by taking the ratio of net interest income over total assets. A higher proportion of the variables indicates a higher COFI, and vice versa. To account for probable nonlinearities in the connection between bank capital and COFI, we have included a quadratic term of this COFI measure. Furthermore, we have used COFI dummies to explore the relationship further into three levels: high (≥¯COFI+0.5σCOFI), average (>¯COFI−0.5σCOFIand<¯COFI+0.5σCOFI), and low (≤¯COFI−0.5σCOFI). We have also tested the model's resilience by using the ratio of net interest income over total earning assets (COFI2).
Table 1 summarizes the estimated variables with sources and references noted in the last column.
| Classification | Variable | Description | Literature References/Sources |
| Capital | ECTA | Eligible capital to total assets | Mateev et al. (2021) |
| CAR | Capital Adequacy Ratio | Mehrotra et al. (2023) | |
| Cost of Financial Intermediation | COFI1 | Interestincome−interestexpensesTotalassets | Rahman et al. (2018) |
| COFI2 | Interestincome−interestexpensesTotalearningassets | Rahman et al. (2023) | |
| Ownership: Dummy Variables | OWNp | Takes a value of one (1) for privately owned commercial banks and zero (0) for state-owned commercial banks. | Alqahtani et al. (2016). Authors Calculation |
| OWNI | Takes a value of one (1) for Islamic commercial banks and zero (0) for conventional commercial banks. | Alqahtani et al. (2016). Authors Calculation |
|
| Banking Sector Development | BSD | Banking industry asset to gross domestic product | Gupta et al. (2021). Source: World Bank data |
| Gross Domestic Product | GDP | Growth of gross domestic product (per capita growth) | Shabir et al. (2023). Source: World Bank data |
| Inflation | Inflation | Annual rate of inflation - Consumer Prices (%) | Entrop et al. (2015) Source: World Bank data |
| Risk | LLPTL | Loan loss provision to total loan | Garel et al. (2022) |
| Income Diversification | ID | Non-interest income to total assets | Sensarma and Ghosh (2004) |
| Bank Size | Size | The logarithm of total assets | Shabir et al. (2023) |
| Profitability | ROA | The ratio of net income to total assets | Carsamer et al. (2022) |
| Liquidity | NLTA | Net loan to total assets | Saeed et al. (2020) |
| Management Efficiency | ME | The ratio of earning assets to total assets | Rahman et al. (2017) |
| High COFI | Dummy Variable | Equal to 1, if COFI≥¯COFI+0.5σCOFI, otherwise 0 | Source: The Authors |
| Low COFI | Dummy Variable | Equal to 1, if COFI≤¯COFI−0.5σCOFI, otherwise 0 | Source: The Authors |
| Avg COFI | Dummy Variable | Equal to 1, if ¯COFI−0.5σCOFI<CoFI<¯COFI+0.5σCOFI, otherwise 0 | Source: The Authors |
| High Capital | Dummy Variable | Equal to 1, if Capital ≥¯RNPL+0.5σRNPL, otherwise 0 | Source: The Authors |
| Low Capital | Dummy Variable | Equal to 1, if Capital ≤¯RNPL−0.5σRNPL, otherwise 0 | Source: The Authors |
| Avg Capital | Dummy Variable | Equal to 1, if ¯RNPL−0.5σRNPL<Capital<¯RNPL+0.5σRNPL, otherwise 0 | Source: The Authors |
| Source: Author's compilation using the mentioned sources/references. | |||
 DownLoad:
CSV
DownLoad:
CSV
We incorporated the squared terms of COFI and capital into various specifications to explore potential nonlinear relationships. Following Hussain and Bashir (2020), we calculated inflection points to interpret the results of these variables and their squared terms. To make sense of the results, we followed the interpretation approach of Berger et al. (2009), Hussain and Bashir (2020), and Zheng et al. (2023). An inflection point refers to the point (in slope) where the relationship between variables undergoes a substantial change, such as a transition from positive to negative or vice versa.
| Inflection Point=−coefficientofvariable2×coefficientofthesquaredtermofthatvariable | (1) |
However, it is not rational to determine where the relationship between the two variables does not change, as this would require a reversal in the direction of their correlation (Khan & Senhadji, 2001).
This section discusses the study's empirical model, covering the baseline and extended bank capital and COFI models. Many researchers use equations based on a single dependent variable to examine the association between the dependent variable and various explanatory variables. However, this method often overlooks the simultaneity and endogeneity issues among the explanatory variables (Abbas et al., 2023). So, following the studies of Gupta et al. (2021) and Abbas et al. (2023), we specify the baseline equations model (simultaneous equations) to determine the interdependence between bank capital and the COFI.
| Yi,t=β0+β1Yi,t−1+β2Xi,t+βq∑6q=3Bi,q,t+β7Ii,r,t+βs∑9r=8Mi,s,t+εi,t……… | (2) |
where subscript i and t represent cross-sectional dimensions across banks and time, respectively. Again, q, r, s represent bank-specific, industry-specific, and macroeconomic-specific perspectives. B, I, and M are vectors of bank-specific, industry-specific, and macroeconomic-specific control variables, respectively. εi,tis the i.i.d (independent and identically distributed) error term.
Yi,t represents the dependent variable—capital and the COFI. Yi,t−1 signifies the lagged dependent variable. Xi,t refers to the endogenous independent variables. For the capital equation, the COFI is the endogenous independent variable, while for the COFI equation, capital is the endogenous independent variable. Bank-specific control variables are presented by Bi,q,t, which includes risk, income diversification, size, and profitability for capital measures; and includes risk, liquidity, size, and management efficiency for COFI measures. Ii,r,t presents the industry-specific variable, which includes BSD. Mi,s,tdenotes macroeconomic variables, including the GDP and inflation. The objective is to identify the simultaneous association between capital and the COFI, and determine the model variables to estimate equation (1) empirically. Table 1 describes the empirical proxy for each of these variables.
Following Arellano and Bover (1995), Blundell and Bond (1998), Rahman et al. (2017), and Moudud-Ul-Huq (2021), this study opted for a two-step system generalized method of moments (2SGMM) to avoid dynamic biases from ordinary least squares (OLS) methods (Nickell, 1981), the endogeneity problem from least square dummy variable (LSDV) methods, and the standard error fixed effects model (Alvi et al., 2021; Roodman, 2009). The 2SGMM addresses the model's endogeneity, heteroscedasticity, and the autocorrelation problem (Gupta & Yesmin, 2022; Zheng et al., 2018).
After conducting pre-diagnostic tests, it was discovered that using OLS as a regression method would not be advisable due to heteroscedasticity (White test for heteroscedasticity) and autocorrelation (LM test for autocorrelation). Instead, using the fixed-effect model based on the results of the Hausman specification tests is recommended. However, the assumption of OLS is rejected by the lagged dependent variables in equations (1) and (2), which restricts the use of the fixed effect model and first-step difference GMM. Therefore, following the recommended decisional procedure of Roodman (2009), we opt for the 2SGMM estimation technique of Arellano and Bover (1995) and Blundell and Bond (1998) to address the unobserved heterogeneity and endogeneity issue of unbalanced panel data. This method will provide unbiased and consistent results.
Two standard tests (Arellano and Bond 1 and 2, and the Hansen test) were conducted to ensure the model's accuracy. Additionally, the null hypothesis was examined through the AR (2) test to detect any second-order correlation between error terms. The p values of AR (2) revealed no second-order serial correlation in all of the applied models, consistent with findings by Rakshit and Bardhan (2019), Ben Naceur and Kandil (2009), and others.
We extend our baseline model based on the research of Liu et al. (2020), Gupta and Yesmin (2022), Moudud-Ul-Huq (2021), and Kasman and Kasman (2015) to analyze the nonlinear effect of the main independent variable and linear and nonlinear joint effect of the endogenous independent variable with ownership dummies on the dependent variables. Specifically, we included two ownership dummies: private commercial banks and Islamic commercial banks. These act as treatment variables, with counterparts assigned a value of 0 in the model. This allows us to compare private commercial banks with state-owned commercial banks and Islamic commercial banks with conventional commercial banks. The extended models are presented as follows:
| Yi,t=β0+β1Yi,t−1+β2Xi,t+β3X2i,t+βq∑7q=4Bi,q,t+β8Ii,r,t+βs∑10r=9Mi,s,t+εi,t−− | (3) |
| Yi,t=β0+β1Yi,t−1+β2Xi,t+β3OWNP(OWNI)+βq∑7q=4Bi,q,t+β8Ii,r,t+βs∑10r=9Mi,s,t+εi,t | (4) |
| Yi,t=β0+β1Yi,t−1+β2Xi,t+β3OWNP(OWNI)×Xi,t+βq∑7q=4Bi,q,t+β8Ii,r,t+βs∑10r=9Mi,s,t+εi,t−−−− | (5) |
| Yi,t=β0+β1Yi,t−1+β2Xi,t+β3OWNP(OWNI)×Xi,t+β4OWNP(OWNI)×X2i,t+βq∑8q=5Bi,q,t+β9Ii,r,t+βs∑11r=10Mi,s,t+εi,t−−−−− | (6) |
Equation (3) presents the nonlinear effect of the main independent variable on the dependent variable. Equation (4) shows the effects of ownership on the dependent variables. Equations (5) and (6) present the combined effect of ownership and main independent variables on the dependent variables. In equation (3), X2i,t refers to the squared term of the dependent variables. In equation (6), the interaction of OWNP(OWNI)×X2i,t addresses the nonlinear and joint effect of the independent variable with the ownership dummy variables.
In this study, equations (2) through (6) are designed to address the research questions and test the specified hypotheses. Specifically, equations (2) and (3) are intended to test hypothesis 1 and reserve causality of capital, respectively. Equation (4) is formulated to evaluate hypotheses 2 and 3, while equations (5) and (6) are constructed to examine hypothesis 4.
In line with previous studies of Fiordelisi et al. (2011), Barra and Ruggiero (2021), and others, we perform the GCT to explore the probable concurrent relationship between bank capital and COFI. Using the approaches of Granger (1969), we develop the following pairwise Granger causality models:
| Capitalt=∑mj=1α1jCapitalt−j+∑mj=1α2jCOFIt−j+εi,t | (7) |
| COFIt=∑mj=1β1jCOFIt−j+∑mj=1β2jCapitalt−j+ϵi,t | (8) |
where Capitalt represents ECTA, COFIt represents COFI1, t denotes the time period (t = 1, 2, 3, ……, T), and j signifies the lag lengths. The error terms εi,t and ϵi,t are considered distinct white noise series. It is important to note that the Granger causality model does not include the extensive controls described in equations (2) through (6). Significance in the coefficients of the Capitali,t and COFIi,t in the above regressions indicates the presence of a bidirectional relationship or Granger causality between them (Granger, 1969). For lag selection, we adopt the ad hoc lag selection process of Jones (1989). As Table A1 in Appendix A shows, our results suggest that the bidirectional relationship between risk and capital may exist in all cases.
This section presents an overview of the statistics (Table 2), and multicollinearity tests (Tables 3–4). To determine the empirical results (Table 5–12), we utilized a 2SGMM panel estimator. We also employed the Hansen over-identification test to ensure the instruments' validity. Our instruments were verified as accurate in all Tables 5–12 specifications.
| Variable | Obs | Mean | Std. Dev. | Min | Max |
| ECTA | 494 | 0.106 | 0.086 | −0.153 | 0.809 |
| CAR | 494 | 0.149 | 0.175 | −0.284 | 2.207 |
| COFIT1 | 494 | 0.020 | 0.012 | −0.023 | 0.077 |
| COFIT2 | 494 | 0.023 | 0.014 | −0.024 | 0.104 |
| LLPTL | 494 | 0.031 | 0.043 | 0.000 | 0.351 |
| ID | 494 | 0.025 | 0.012 | 0.000 | 0.101 |
| NLTA | 494 | 0.634 | 0.140 | 0.004 | 1.963 |
| SIZE | 494 | 12.036 | 1.017 | 8.508 | 14.355 |
| ME | 494 | 0.873 | 0.048 | 0.577 | 1.000 |
| ROA | 494 | 0.899 | 1.103 | −7.490 | 6.050 |
| BSD | 494 | 48.044 | 2.856 | 41.054 | 51.110 |
| GDP | 494 | 5.122 | 1.082 | 2.271 | 6.688 |
| Inflation | 494 | 6.539 | 1.532 | 5.514 | 11.395 |
DownLoad:
CSV
| Variable | ⅥF (Capital Equation) | ⅥF (COFI Equation) |
| ECTA | 2.016 | |
| COFI1 | 1.791 | |
| LLPTL | 1.875 | 1.873 |
| ID | 1.471 | |
| Size | 1.173 | 1.728 |
| ROA | 2.144 | |
| NLTA | 1.719 | |
| ME | 1.305 | |
| BSD | 1.097 | 1.145 |
| GDP | 1.132 | 1.084 |
| Inflation | 1.246 | 1.150 |
DownLoad:
CSV
| Variables | (1) | (2) | (3) | (4) | (5) | (6) | (7) | (8) | (9) | (10) | (11) | (12) | (13) |
| (1) ECTA | 1.000 | ||||||||||||
| (2) CAR | 0.898*** | 1.000 | |||||||||||
| (0.000) | |||||||||||||
| (3) COFIT2 | 0.316*** | 0.181*** | 1.000 | ||||||||||
| (0.000) | (0.000) | ||||||||||||
| (4) COFI1 | 0.312* | 0.166*** | 0.994*** | 1.000 | |||||||||
| (0.000) | (0.000) | (0.000) | |||||||||||
| (5) LLPTL | −0.314*** | −0.230* | −0.554*** | −0.522*** | 1.000 | ||||||||
| (0.000) | (0.000) | (0.000) | (0.000) | ||||||||||
| (6) ID | −0.097** | −0.216*** | −0.132*** | −0.117*** | 0.048 | 1.000 | |||||||
| (0.032) | (0.000) | (0.003) | (0.009) | (0.285) | |||||||||
| (7) NLTA | −0.257*** | −0.396*** | 0.439*** | 0.435*** | −0.460*** | −0.051 | 1.000 | ||||||
| (0.000) | (0.000) | (0.000) | (0.000) | (0.000) | (0.255) | ||||||||
| (8) SIZE | −0.603*** | −0.492*** | −0.299*** | −0.291*** | 0.207*** | −0.006 | 0.169*** | 1.000 | |||||
| (0.000) | (0.000) | (0.000) | (0.000) | (0.000) | (0.894) | (0.000) | |||||||
| (9) ME | 0.030 | 0.095** | 0.044 | −0.034 | −0.372*** | −0.106** | 0.319*** | −0.080* | 1.000 | ||||
| (0.504) | (0.035) | (0.330) | (0.456) | (0.000) | (0.019) | (0.000) | (0.074) | ||||||
| (10) ROA | 0.258*** | 0.098** | 0.453*** | 0.443*** | −0.566*** | 0.364*** | 0.236*** | −0.159*** | 0.024 | 1.000 | |||
| (0.000) | (0.029) | (0.000) | (0.000) | (0.000) | (0.000) | (0.000) | (0.000) | (0.591) | |||||
| (11) BSD | 0.112** | 0.089** | 0.010 | 0.020 | 0.011 | 0.025 | −0.176*** | −0.177*** | −0.170*** | −0.028 | 1.000 | ||
| (0.013) | (0.049) | (0.822) | (0.660) | (0.801) | (0.579) | (0.000) | (0.000) | (0.000) | (0.529) | ||||
| (12) GDP | −0.014 | −0.013 | 0.136*** | 0.130*** | 0.020 | −0.114** | 0.071 | 0.028 | 0.055 | −0.059 | −0.225*** | 1.000 | |
| (0.754) | (0.778) | (0.002) | (0.004) | (0.659) | (0.011) | (0.113) | (0.532) | (0.218) | (0.188) | (0.000) | |||
| (13) Inflation | 0.053 | −0.007 | 0.173*** | 0.182*** | −0.108** | 0.307*** | −0.014 | −0.208*** | −0.147*** | 0.310*** | 0.023 | −0.151*** | 1.000 |
| (0.241) | (0.874) | (0.000) | (0.000) | (0.016) | (0.000) | (0.751) | (0.000) | (0.001) | (0.000) | (0.605) | (0.001) | ||
| Note: Pearson's correlation coefficients. *** p<0.01, ** p<0.05, * p<0.1. | |||||||||||||
DownLoad:
CSV
| Variable Name |
Model Ⅰ | Model Ⅱ | OWNp | OWNI | |||||
| Model Ⅲ | Model Ⅳ | Model Ⅴ | Model Ⅵ | Model Ⅶ | Model Ⅷ | ||||
| ECTA (-1) | 0.5482*** (0.0029) |
0.6216*** (0.0027) |
0.5271*** (0.0031) |
0.6189*** (0.0028) |
0.6192*** (0.0031) |
0.6167*** (0.0031) |
0.5483*** (0.0031) |
0.5451*** (0.0034) |
|
| COFI1 | 0.2767*** (0.0361) |
0.6551*** (0.0281) |
0.4797*** (0.0403) |
0.1453*** (0.0471) |
0.1183** (0.0461) |
0.2621*** (0.0221) |
0.1606** (0.0634) |
0.2388*** (0.0598) |
|
| COFI12 | −11.7778*** (0.4671) |
||||||||
| Inflection Point | 0.0278 | ||||||||
| Ownership | −0.0234*** (0.0021) |
−0.0274*** (0.0027) |
|||||||
| Ownership ×COFI1 | −0.4889*** (0.0351) |
−0.7092*** (0.0357) |
0.1239** (0.0614) |
0.4914*** (0.0633) |
|||||
| Ownership × COFI12 | 19.8455*** (1.2798) |
−13.4958*** (2.2068) |
|||||||
| LLPTL | −0.0136** (0.0061) |
−0.0292*** (0.0053) |
−0.1518*** (0.0087) |
−0.0294*** (0.0064) |
−0.0129** (0.0055) |
−0.0448*** (0.0097) |
−0.0125** (0.0061) |
−0.0251* (0.0088) |
|
| ID | 0.2588*** (0.0351) |
0.2829*** (0.0323) |
0.2692*** (0.0392) |
0.2845*** (0.0246) |
0.2737*** (0.0284) |
−0.2366*** (0.0341) |
0.1617*** (0.0419) |
0.1267*** (0.0452) |
|
| Size | −0.0013*** (0.0002) |
−0.0014*** (0.0003) |
−0.0035*** (0.0004) |
−0.0013*** (0.0003) |
−0.0014*** (0.0003) |
−0.0035* (0.0004) |
−0.0009*** (0.0003) |
−0.0009** (0.0004) |
|
| ROA | 0.0133*** (0.0003) |
0.0128*** (0.0002) |
0.0117** (0.0002) |
0.0124*** (0.0002) |
0.0126*** (0.0002) |
0.0126*** (0.0003) |
0.0135*** (0.0003) |
0.0141*** (0.0004) |
|
| BSD | −0.0008*** (0.00006) |
−0.0007*** (0.00005) |
−0.0011*** (0.0001) |
−0.0007*** (0.00005) |
−0.0007*** (0.00004) |
−0.0004*** (0.00009) |
−0.0008*** (0.00007) |
−0.0009*** (0.00007) |
|
| GDP | −0.0012*** (0.0001) |
−0.0009*** (0.0001) |
−0.0016*** (0.0001) |
−0.0008*** (0.0001) |
−0.0008*** (0.0001) |
−0.0009*** (0.0001) |
−0.0012*** (0.0001) |
−0.0013*** (0.0001) |
|
| Inflation | −0.0031*** (0.0002) |
−0.0026*** (0.0002) |
−0.0037*** (0.0002) |
−0.0029*** (0.0001) |
−0.0027*** (0.0002) |
−0.0015*** (0.0001) |
−0.0028*** (0.0002) |
−0.0028*** (0.0002) |
|
| Constant | 0.1008*** (0.0061) |
0.0499*** (0.0061) |
0.1446*** (0.0097) |
0.0545*** (0.0054) |
0.0535*** (0.0054) |
−0.0053 (0.0091) |
0.0953*** (0.0071) |
0.0977*** (0.0073) |
|
| Hansen Test (p-value) | 0.225 | 0.216 | 0.184 | 0.233 | 0.188 | 0.278 | 0.213 | 0.270 | |
| AR (1) (p-value) |
0.042 | 0.063 | 0.037 | 0.050 | 0.048 | 0.060 | 0.044 | 0.063 | |
| AR (2) (p-value) |
0.304 | 0.305 | 0.283 | 0.276 | 0.297 | 0.313 | 0.313 | 0.337 | |
| Observations | 450 | 450 | 450 | 450 | 450 | 450 | 450 | 450 | |
| Notes: The dependent variable is capital (ECTA), calculated as the ratio of eligible capital to total assets. Standard errors are in parentheses. ***, **, and * denote the significance level at the corresponding 1%, 5%, and 10% level. The p-value of the Hansen test is referred to as J statistics. Tests for first-order (second-order) correlation using Arellano-Bond order 1 and 2 are asymptotically N (0, 1). | |||||||||
DownLoad:
CSV
| Variable Name | C Ⅰ | C Ⅱ | C Ⅲ |
| ECTA (-1) | 0.5478*** (0.0041) |
0.6237*** (0.0043) |
0.5196*** (0.0055) |
| High COFI1 | −0.0144*** (0.0029) |
||
| Avg COFI1 | 0.0031*** (0.0011) |
||
| Low COFI1 | 0.0327*** (0.0027) |
||
| All Control Variables | Yes | Yes | Yes |
| Constant | 0.1046*** (0.0079) |
0.0507*** (0.0061) |
0.0663*** (0.0142) |
| Hansen Test (p-value) | 0.225 | 0.221 | 0.195 |
| AR (1) (p-value) | 0.037 | 0.050 | 0.076 |
| AR (2) (p-value) | 0.337 | 0.263 | 0.355 |
| Observations | 450 | 450 | 450 |
| Notes: The dependent variable is capital (ECTA), calculated as the ratio of eligible capital to total assets. Standard errors are in parentheses. ***, **, and * denote the significance level at the corresponding 1%, 5%, and 10% level. The p-value of the Hansen test is referred to as J statistics. Tests for first-order (second-order) correlation using Arellano-Bond order 1 and 2 are asymptotically N (0, 1). | |||
DownLoad:
CSV
| Variable Name | Model Ⅰ | Model Ⅱ | OWNP | OWNI | ||||
| Model Ⅲ | Model Ⅳ | Model Ⅴ | Model Ⅵ | Model Ⅶ | Model Ⅷ | |||
| COFI1 (-1) | 0.6158*** (0.0119) |
0.6308*** (0.0189) |
0.5888*** (0.0119) |
0.6295*** (0.0172) |
0.6192*** (0.0193) |
0.5901*** (0.014) |
0.5916*** (0.0145) |
0.5988*** (0.0157) |
| ECTA | 0.0332*** (0.0013) |
0.0251*** (0.0041) |
0.0356*** (0.0014) |
0.0398*** (0.0013) |
0.0406*** (0.0019) |
0.0289*** (0.0024) |
0.0355*** (0.0019) |
0.0261*** (0.0054) |
| ECTA2 | 0.0318* (0.0175) |
|||||||
| Ownership | 0.0033*** (0.0004) |
0.0053* (0.0031) |
||||||
| Ownership × ECTA | 0.0278*** (0.0038) |
0.0133** (0.0063) |
0.0236*** (0.0029) |
0.0192*** (0.0037) |
||||
| Ownership × ECTA 2 | 0.0853* (0.0473) |
-0.0292* (0.0167) |
||||||
| LLPTL | −0.0156*** (0.0022) |
−0.0191*** (0.0029) |
−0.0053** (0.0021) |
−0.0138*** (0.0021) |
−0.0094** (0.0048) |
−0.0338*** (0.0028) |
−0.0323*** (0.0025) |
−0.0389*** (0.0042) |
| NLTA | 0.0293*** (0.0004) |
0.0281*** (0.0012) |
0.02733*** (0.0005) |
0.0266*** (0.0008) |
0.0278*** (0.0008) |
0.0276*** (0.0005) |
0.0256*** (0.0007) |
0.0251*** (0.0008) |
| Size | −0.0006*** (0.00007) |
−0.0005*** (0.00007) |
−0.0003*** (0.00009) |
−0.0005*** (0.00007) |
−0.0005*** (0.0001) |
−0.0007*** (0.00008) |
−0.0005*** (0.00006) |
−0.0004*** (0.00007) |
| ME | −0.0361*** (0.0029) |
−0.0351*** (0.0031) |
−0.0395*** (0.0023) |
−0.0465*** (0.0041) |
−0.0451*** (0.0039) |
−0.0393*** (0.0034) |
−0.0461*** (0.0041) |
−0.0439*** (0.0042) |
| BSD | 0.00007*** (0.00002) |
0.00005* (0.00003) |
0.00007** (0.00003) |
0.00003 (0.00004) |
0.00002 (0.00003) |
0.00007** (0.00002) |
0.00004 (0.00003) |
0.00004 (0.00003) |
| GDP | 0.0019*** (0.00005) |
0.0019*** (0.00006) |
0.0021*** (0.00006) |
0.0019*** (0.00006) |
0.0019*** (0.00008) |
0.0019*** (0.00008) |
0.0019*** (0.00009) |
0.0019*** (0.00009) |
| Inflation | 0.00013** (0.00005) |
0.0001*** (0.00005) |
0.0002*** (0.00005) |
0.00008 (0.00008) |
0.00007 (0.00008) |
0.00003 (0.00007) |
0.00001 (0.00008) |
0.00001 (0.00008) |
| Constant | 0.0094** (0.0039) |
0.0093** (0.0042) |
0.0104*** (0.0039) |
0.0218*** (0.0066) |
0.0207*** (0.0062) |
0.0173*** (0.0046) |
0.0234 *** (0.0058) |
0.0216*** (0.0056) |
| Hansen Test (p-value) | 0.211 | 0.205 | 0.229 | 0.331 | 0.252 | 0.163 | 0.205 | 0.216 |
| AR (1) (p-value) |
0.000 | 0.000 | 0.000 | 0.000 | 0.000 | 0.000 | 0.000 | 0.000 |
| AR (2) (p-value) |
0.432 | 0.417 | 0.492 | 0.453 | 0.461 | 0.459 | 0.420 | 0.412 |
| Observations | 450 | 450 | 450 | 450 | 450 | 450 | 450 | 450 |
| Notes: The dependent variable is CoFI1, which is calculated as the ratio of net interest income to total assets. Standard errors are in parentheses. ***, **, and * denote the significance level at the corresponding 1%, 5%, and 10% level. The p-value of the Hansen test is referred to as J statistics. Tests for first-order (second-order) correlation using Arellano-Bond order 1 and 2 are asymptotically N (0, 1). | ||||||||
DownLoad:
CSV
| Variable Name | C Ⅰ | C Ⅱ | C Ⅲ |
| COFI (-1) | 0.5936*** (0.0361) |
0.6047*** (0.0401) |
0.6101*** (0.0404) |
| High ECTA | 0.0041** (0.0016) |
||
| Avg ECTA | 0.0019* (0.0011) |
||
| Low ECTA | -0.0025*** (0.0007) |
||
| All Control Variables | Yes | Yes | Yes |
| Constant | 0.0339*** (0.0074) |
0.0309*** (0.0076) |
0.0321*** (0.0074) |
| Hansen Test (p-value) | 0.267 | 0.277 | 0.272 |
| AR (1) (p-value) | 0.000 | 0.000 | 0.000 |
| AR (2) (p-value) | 0.410 | 0.431 | 0.445 |
| Observations | 450 | 450 | 450 |
| Notes: The dependent variable is CoFI1, which is calculated as the ratio of net interest income to total assets. Standard errors are in parentheses. ***, **, and * denote the significance level at the corresponding 1%, 5%, and 10% level. The p-value of the Hansen test is referred to as J statistics. Tests for first-order (second-order) correlation using Arellano-Bond order 1 and 2 are asymptotically N (0, 1). | |||
DownLoad:
CSV
| Variable Name | Model Ⅰ | Model Ⅱ | OWNP | OWNI | ||||
| Model Ⅲ | Model Ⅳ | Model Ⅴ | Model Ⅵ | Model Ⅶ | Model Ⅷ | |||
| CAR (-1) | 0.4967*** (0.0011) |
0.4799*** (0.0011) |
0.4621*** (0.0015) |
0.4953*** (0.0007) |
0.4489*** (0.0011) |
0.4451*** (0.0013) |
0.4967*** (0.0011) |
0.4979*** (0.0014) |
| COFI1 | 0.2424*** (0.0327) |
0.3148*** (0.0315) |
0.8282*** (0.0447) |
0.1031** (0.0511) |
0.1101* (0.0583) |
0.3838*** (0.0419) |
0.1374* (0.0775) |
0.2569** (0.0995) |
| COFI12 | −1.9824* (1.0588) |
|||||||
| Inflection Point | 0.0315 | |||||||
| Ownership | −0.0696*** (0.0025) |
−0.0491*** (0.0055) |
||||||
| Ownership ×COFI1 | −0.6271*** (0.0387) |
−0.7538*** (0.1033) |
0.0938* (0.0537) |
0.1646* (0.0984) |
||||
| Ownership × COFI12 | 14.8636*** (3.1899) |
−2.7988*** (1.0714) |
||||||
| LLPTL | −0.0541*** (0.0123) |
−0.0505*** (0.0123) |
−0.4697*** (0.0141) |
−0.068*** (0.0119) |
−0.1616*** (0.0089) |
−0.1848*** (0.0117) |
−0.0363*** (0.0124) |
0.0095 (0.0169) |
| ID | 0.1724*** (0.0474) |
0.1303** (0.0513) |
0.2161*** (0.0578) |
0.1498*** (0.0469) |
0.10−65* (0.0571) |
−0.8389*** (0.0819) |
0.0498 (0.0516) |
0.0618 (0.0587) |
| Size | −0.0005* (0.0003) |
−0.0004 (0.0003) |
−0.0064*** (0.0005) |
0.0003 (0.0003) |
−0.0028*** (0.0004) |
−0.0016*** (0.0003) |
−0.0007** (0.0003) |
−0.0008*** (0.0003) |
| ROA | 0.0195*** (0.0005) |
0.0199*** (0.0005) |
0.0139*** (0.0005) |
0.0197*** (0.0005) |
0.0174*** (0.0005) |
0.0179*** (0.0005) |
0.0201*** (0.0005) |
0.0211*** (0.0006) |
| BSD | −0.0021*** (0.00008) |
−0.0022*** (0.00007) |
−0.0025*** (0.0001) |
−0.0021** (0.00007) |
−0.0021*** (0.00009) |
−0.0015*** (0.0001) |
−0.0021*** (0.00008) |
−0.0021*** (0.00009) |
| GDP | −0.0025*** (0.0001) |
−0.0027*** (0.0001) |
−0.0039*** (0.0002) |
−0.0023*** (0.0001) |
−0.0025*** (0.0001) |
−0.0029*** (0.0002) |
−0.0025*** (0.0001) |
−0.0027*** (0.0001) |
| Inflation | −0.0044*** (0.0002) |
−0.0046** (0.0002) |
−0.0064*** (0.0002) |
−0.0046*** (0.0001) |
−0.0053*** (0.0002) |
−0.0024*** (0.0001) |
−0.0043*** (0.0002) |
−0.0044** (0.0002) |
| Constant | 0.1767*** (0.0051) |
0.1983*** (0.0053) |
0.3048*** (0.0141) |
0.1806*** (0.0045) |
0.2375*** (0.0078) |
0.1183*** (0.0079) |
0.1724*** (0.0061) |
0.1691*** (0.0059) |
| Hansen Test (p-value) | 0.234 | 0.221 | 0.236 | 0.225 | 0.219 | 0.386 | 0.250 | 0.169 |
| AR (1) (p-value) |
0.049 | 0.032 | 0.061 | 0.058 | 0.035 | 0.012 | 0.053 | 0.052 |
| AR (2) (p-value) |
0.349 | 0.364 | 0.489 | 0.383 | 0.333 | 0.293 | 0.384 | 0.373 |
| Observations | 450 | 450 | 450 | 450 | 450 | 450 | 450 | 450 |
| Notes: The dependent variable is capital (CAR), calculated as the ratio of tier Ⅰ plus tier Ⅱ capital to risk-weighted assets. Standard errors are in parentheses. ***, **, and * denote the significance level at the corresponding 1%, 5%, and 10% level. The p-value of the Hansen test is referred to as J statistics. Tests for first-order (second-order) correlation using Arellano-Bond order 1 and 2 are asymptotically N (0, 1). | ||||||||
DownLoad:
CSV
| Variable Name | C Ⅰ | C Ⅱ | C Ⅲ |
| CAR (-1) | 0.5004*** (0.0019) |
0.4735*** (0.0023) |
0.4592*** (0.0027) |
| High COFI1 | −0.0088*** (0.0025) |
||
| Avg COFI1 | 0.0091*** (0.0019) |
||
| Low COFI1 | 0.0503*** (0.0046) |
||
| All Control Variables | Yes | Yes | Yes |
| Constant | 0.1787*** (0.0066) |
0.1973*** (0.0085) |
0.1551*** (0.0158) |
| Hansen Test (p-value) | 0.166 | 0.327 | 0.295 |
| AR (1) (p-value) | 0.056 | 0.017 | 0.051 |
| AR (2) (p-value) | 0.383 | 0.196 | 0.327 |
| Observations | 450 | 450 | 450 |
| Notes: The dependent variable is capital (CAR), calculated as the ratio of tier Ⅰ plus tier Ⅱ capital to risk-weighted assets. Standard errors are in parentheses. ***, **, and * denote the significance level at the corresponding 1%, 5%, and 10% level. The p-value of the Hansen test is referred to as J statistics. Tests for first-order (second-order) correlation using Arellano-Bond order 1 and 2 are asymptotically N (0, 1). | |||
DownLoad:
CSV
| Variable Name | Model Ⅰ | Model Ⅱ | OWNP | OWNI | ||||
| Model Ⅲ | Model Ⅳ | Model Ⅴ | Model Ⅵ | Model Ⅶ | Model Ⅷ | |||
| COFI2 (-1) | 0.5701*** (0.0086) |
0.5832*** (0.0141) |
0.5245*** (0.0111) |
0.5516*** (0.0348) |
0.5891*** (0.0171) |
0.5879*** (0.0111) |
0.5753*** (0.0159) |
0.5579*** (0.0136) |
| ECTA | 0.0426*** (0.0014) |
0.0303*** (0.0044) |
0.0481*** (0.0014) |
0.0466*** (0.0065) |
0.0533*** (0.0028) |
0.0381*** (0.0023) |
0.0519*** (0.0019) |
0.0301*** (0.0054) |
| ECTA2 | 0.0432** (0.0181) |
|||||||
| Ownership | 0.0081*** (0.0008) |
0.0025*** (0.0006) |
||||||
| Ownership × ECTA | 0.0332** (0.0132) |
0.0144* (0.0083) |
0.0359*** (0.0062) |
0.0241*** (0.0041) |
||||
| Ownership × ECTA 2 | 0.1665*** (0.0543) |
-0.0447*** (0.0171) |
||||||
| LLPTL | −0.0144*** (0.0015) |
−0.0224*** (0.0041) |
0.0082** (0.0034) |
−0.0225*** (0.0057) |
−0.0042 (0.0061) |
−0.0165*** (0.002)6 |
−0.0123*** (0.0023) |
−0.0453*** (0.0054) |
| NLTA | 0.0401*** (0.0005) |
0.0386*** (0.0013) |
0.0349*** (0.0008) |
0.0377*** (0.0023) |
0.0368*** (0.0012) |
0.0424*** (0.0006) |
0.0369*** (0.0013) |
0.0348*** (0.0011) |
| Size | −0.0008*** (0.00008) |
−0.0007*** (0.00009) |
−0.0001 (0.0001) |
−0.0014*** (0.0002) |
−0.0009*** (0.0001) |
−0.0008*** (0.0001) |
−0.0007*** (0.0001) |
−0.0006*** (0.00007) |
| ME | −0.0552*** (0.0026) |
−0.0561*** (0.0031) |
−0.0666*** (0.0033) |
−0.0771*** (0.0068) |
−0.0713*** (0.0051) |
−0.0603*** (0.0031) |
−0.0681*** (0.0051) |
−0.0659*** (0.0048 |
| BSD | 0.0001*** (0.00003) |
0.00008* (0.00004) |
0.0001*** (0.00002) |
−0.00002 (0.00006) |
−0.000002 (0.00004) |
0.00009*** (0.00003) |
0.00002 (0.00005) |
0.00006 (0.00004) |
| GDP | 0.0022*** (0.00007) |
0.0022*** (0.00007) |
0.0023*** (0.00007) |
0.0021*** (0.0001) |
0.0021*** (0.00009) |
0.0022*** (0.00006) |
0.0021*** (0.00007) |
0.0022*** (0.00008) |
| Inflation | 0.0002*** (0.00003) |
0.0001** (0.00007) |
0.0003*** (0.00008) |
0.00006 (0.0001) |
0.0001 (0.00009) |
0.0002** (0.00007) |
0.0001* (0.00009) |
0.0001 (0.00009) |
| Constant | 0.0203*** (0.0041) |
0.0229*** (0.0058) |
0.0253*** (0.0051) |
0.0558*** (0.0111) |
0.0425*** (0.0088) |
0.0217*** (0.0049) |
0.0356*** (0.0091) |
0.0353*** (0.0072) |
| Hansen Test (p-value) | 0.222 | 0.211 | 0.214 | 0.133 | 0.279 | 0.258 | 0.246 | 0.201 |
| AR (1) (p-value) |
0.001 | 0.000 | 0.001 | 0.000 | 0.001 | 0.000 | 0.001 | 0.001 |
| AR (2) (p-value) |
0.437 | 0.478 | 0.446 | 0.379 | 0.431 | 0.467 | 0.465 | 0.401 |
| Observations | 450 | 450 | 450 | 450 | 450 | 450 | 450 | 450 |
| Notes: The dependent variable is CoFI2, calculated as the ratio of net interest income to total interest-earning assets. Standard errors are in parentheses. ***, **, and * denote the significance level at the corresponding 1%, 5%, and 10% level. The p-value of the Hansen test is referred to as J statistics. Tests for first-order (second-order) correlation using Arellano-Bond order 1 and 2 are asymptotically N (0, 1). | ||||||||
DownLoad:
CSV
| Variable Name | C1 | C2 | C3 |
| COFI (-1) | 0.5629*** (0.0373) |
0.5938*** (0.0408) |
0.5958*** (0.0398) |
| High ECTA | 0.0042** (0.0021) |
||
| Avg ECTA | 0.0022** (0.0009) |
||
| Low ECTA | −0.0024*** (0.0009) |
||
| All Control Variables | Yes | Yes | Yes |
| Constant | 0.0528*** (0.0091) |
0.0452*** (0.0093) |
0.0451*** (0.0082) |
| Hansen Test (p-value) | 0.226 | 0.144 | 0.206 |
| AR (1) (p-value) | 0.001 | 0.001 | 0.002 |
| AR (2) (p-value) | 0.407 | 0.448 | 0.480 |
| Observations | 450 | 450 | 450 |
| Notes: The dependent variable is CoFI2, which is calculated as the ratio of net interest income to average earning assets. Standard errors are in parentheses. ***, **, and * denote the significance level at the corresponding 1%, 5%, and 10% level. The p-value of the Hansen test is referred to as J statistics. Tests for first-order (second-order) correlation using Arellano-Bond order 1 and 2 are asymptotically N (0, 1). | |||
DownLoad:
CSV
Table 4 presents the pairwise correlation between variables, while Table 3 reveals the results of the variance inflation factor test concerning capital and the COFI. We can state that multicollinearity is absent, with no correlation above 0.70 for any independent variables, and a ⅥF (variance inflation factor) value below 10 (Thompson et al., 2017).
The descriptive statistics (Table 2) show that the average capital value is 10.6%, which is higher than both the US average of 8.9% (Berger et al., 2023) and the Asian average of 10.4% (Abbas et al., 2023). The mean value of the COFI is 2%, which is lower than the average for Central and Eastern European Countries of 3.52% (Agoraki & Kouretas, 2019), Asia Pacific of South Asia of 2.98% ((Islam & Nishiyama, 2016), and Asia Pacific of 3% (Fu et al., 2014). The mean value of the credit risk measure is 3.1%, which is lower than the Asian average of 4.5% (Abbas et al., 2023). The average liquidity value is 63.4%, higher than the average value of banks in the MENA region of 53.2% (Bougatef & Mgadmi, 2016) and 14 Muslim countries of 44.62% (Saeed et al., 2020). The mean value of management efficiency is 87.3%, which is higher than the average value of banks in BRICS countries of 85.97% (Rahman et al., 2017) but lower than the Egyptian bank's average of 92.9% (Ben Naceur & Kandil, 2009). On average, income diversity in Bangladeshi commercial banks is 2.5%. This indicates that the banking industry has stable funding sources and is protected from funding fragility. However, this value is higher than the 2.3% average for the MENA region (Mateev et al., 2021). The value of average profitability is 0.899%, which is higher than the Ghanaian banks' average of 0.19% (Carsamer et al., 2022). Industry-specific variables BSD depicts the average value of 48.044 with a standard deviation of 2.856. The average GDP is 5.122%, lower than the South Asian average of 5.97% (Islam & Nishiyama, 2016) and the Asian average of 4.112% (Abbas et al., 2023). However, the average inflation rate is 6.539% with a standard deviation of 1.532, higher than the Asian average of 5.612% (Abbas et al., 2023).
The regression outcomes for equations (2) through (6) are depicted across eight models in Tables 5, 7, 9, and 11. In Tables 6, 8, 10, and 12, we categorize the endogenous independent variables into three groups to show their possible effects on the dependent variables. In Table 5–12, standard errors are reported in parentheses. ***, **, and * denote the significance level at the corresponding 1%, 5%, and 10% level. The p-value of the Hansen test is also called the J statistic, and its null hypothesis suggests that the instruments used are not associated with the residuals (overidentifying restrictions). Tests for first-order (second-order) correlation using Arellano-Bond orders 1 and 2 are asymptotically N (0, 1). In the system GMM estimation, these test the first-differenced residuals.
Table 5 demonstrates how the COFI and ownership affect bank capital. The regression coefficient of the lag-dependent variable is significant, meaning that the previous year's effect carries over to the current year, and the capital ratio remains stable. The positive relationship between the cost of financial intermediation and capital, in Model Ⅰ, implies that higher COFI leads to increased bank capital. This also means that increasing COFI provides managers with better access to capital. This result is consistent with the results of Rahman et al. (2017) but differs from the results of Ahmad et al. (2009). The coefficient value of risk shows a negative relationship between risk and capital. This negative relationship between risk and capital aligns with the results of Moudud-Ul-Huq et al. (2022). Profitability shows a significant positive effect on capital. The positive relationship supports the findings of Garel et al. (2022). The correlation between income diversification and bank capital suggests that banks with a broader range of revenue streams tend to have greater capital levels, indicating that diversification can be a valuable strategy for enhancing financial health. This finding is incongruent with the findings of Gupta et al. (2023). The coefficient of size clearly shows a negative relationship with capital, which indicates that as the size of the bank increases, its capital decreases. In other words, smaller banks may be able to maintain higher capital levels due to a more efficient capital structure relative to their size.
The industry-level variable BSD has a significant negative relationship with capital. It signifies that with the development of the banking sector, banks tend to maintain low proportionate capital. Both macroeconomic variables (GDP and inflation) have shown a significant negative relationship with capital. The negative association between GDP and capital implies that banks maintain lower capital in economic progression than otherwise. The outcome contrasts with the findings of Nguyen and Nghiem (2015). On the other hand, the negative relationship between inflation and capital is consistent with the findings of Alqahtani et al. (2016).
The empirical findings of equations (3)–(6) relate to nonlinear and joint effects of the COFI and ownership on bank capital are presented in Model (Ⅱ) to Model (Ⅷ) of Table 5. Specifically, Model (Ⅱ) examines the nonlinear effect of COFI, while Models (Ⅲ) and (Ⅵ) analyze the impact of ownership on bank capital. Additionally, Models (Ⅳ) and (Ⅶ) explore the joint effect of ownership and COFI, and Models (Ⅴ) and (Ⅷ) investigate the joint effect of ownership and the squared term of COFI on bank capital.
Model Ⅱ of Table 5 reveals a significant inverted U-shaped relationship between COFI and the bank capital. To assess the nature of the connection between the variables in the quadratic equation, we determine the inflection point and compare it to the data distribution. The inflection point of the equation is 0.0278, which surpasses the mean value of COFI and occurs at approximately the 75th percentile of the COFI distribution. This suggests a positive link between COFI and bank capital until the inflection point. However, once that point is exceeded, the relationship becomes negative. This finding partially accepts H1, which posited that COFI exhibits a significant positive impact on bank capital. Our finding supports as well as rejects the charter value hypothesis, which proposes that more efficient banks choose a high capital ratio and higher earnings provide bank managers easy access to capital and self-regulatory incentives for risk minimization (Berger & Bonaccorsi di Patti, 2006; Saunders & Wilson, 2001). Yu (2000) opined that, generally, a bank with a low probability of failure could generate more profit. Furthermore, we categorized COFI into high, average, and low categories to distinguish the possible relationships between COFI and bank capital. The results of the analysis, shown in columns Ⅰ, Ⅱ, and Ⅲ of Table 6, indicate that banks with average and low COFI can source more capital than those with high COFI.
In Model Ⅲ and Model Ⅵ of Table 5, the coefficient of the private ownership and Islamic ownership dummy shows a significant negative relationship with the bank's capital, meaning that the presence of private commercial banks and Islamic commercial banks have less significant effects in ensuring and sourcing more capital than the state-owned banks and conventional banks. These results validate H2, suggesting that the existence of privately owned commercial banks does not guarantee greater capital in the market than the state-owned banks. Conversely, findings also propose that Islamic commercial banks ensure more capital in the market. That validates the hypothesis that ownership diversity has a significant impact on the capital of banks.
In Model Ⅴ, the interaction of the private ownership dummy and COFI shows a significant negative relationship with bank capital, and the interaction of the private ownership dummy and squared term of COFI shows a significant positive relationship with bank capital indicating a U-shaped curve for private commercial banks. This finding also indicates a nonlinear inverted U-shaped relationship between COFI and bank capital for state-owned commercial banks. Again, in Model Ⅷ, the interaction of the Islamic ownership dummy and COFI shows a significant positive relationship with bank capital, and the interaction of Islamic ownership and the squared term of COFI shows a significant negative relationship with bank capital indicating an inverted U-shaped curve for Islamic commercial banks. This finding also indicates a nonlinear U-shaped relationship between COFI and bank capital for conventional commercial banks. These findings reveal that the inverted U-shaped relationship between COFI and bank capital is more pronounced in the state-owned banks and Islamic commercial banks, and state-owned banks and Islamic commercial banks can strengthen the nonlinear inverted U-shaped relationship between COFI and bank capital. On the other hand, these findings also indicate a nonlinear U-shaped relationship between COFI and bank capital for private commercial banks and conventional commercial banks.
Moreover, the findings from Model Ⅲ to Model Ⅷ of Table 5 reveal that private-owned commercial banks initially source less capital as COFI increases but can ultimately increase capital in the long run. On the contrary, though state-owned banks initially can source more capital as COFI rises, their capital base decreases in the long run. This decline is likely due to the poor performance of government banks (Cornett et al., 2010). This result is in line with the "political view of government ownership, " which suggests that state-owned banks are used to provide political sponsorship, which distorts the allocation of financial resources (Sapienza, 2004) and may harm productivity growth (La Porta et al., 2002). Again, the inverted U-shaped (U-shaped) curve for Islamic banks (conventional banks) indicates that Islamic banks (conventional banks) initially source more (less) capital as COFI increases but ultimately source less (more) capital in the long run. These findings mean that, in the long run, the capital of Islamic banks has decreased, which may be due to their poor performance. In contrast, conventional banks' capital has increased, which may be due to their better performance (see, e.g., Cornett et al. (2010)). These findings validate the hypothesis demonstrating the significant impact of the joint effect of ownership and COFI on capital.
Table 7 portrays the variables affecting the COFI and the effects of bank capital on COFI. The table reveals that the previous period's COFI has a positive and significant impact on COFI in subsequent periods. Additionally, a significant positive correlation between capital and COFI indicates that higher capital leads to a higher COFI. It signifies that banks raise/adjust the intermediation cost to cover their cost of capital (Rahman et al., 2018). Such a phenomenon may be attributed to the fact that capital is an expensive funding source, and having a significant amount of costly capital in the bank's overall capital structure necessitates a rise in COFI to cover their expenses or to safeguard shareholders against unexpected situations (Ben Naceur & Kandil, 2009). This result aligns with the findings of Shabir et al. (2023). Our findings support the agency cost hypothesis, which states that having a higher capital ratio can effectively reduce agency costs as it motivates banks to prioritize the interest of shareholders (Berger & Bonaccorsi di Patti, 2006; Jensen & Meckling, 1976).
Risk shows a significant negative relationship with COFI, which implies that increasing risk decreases banks' margins. This result is harmonized with the previous research conducted by Trinugroho et al. (2014). On the other hand, liquidity and COFI have a significant positive relationship, indicating that banks with higher liquidity must tend to have more operating expenses, which they then pass on to their borrowers. This outcome aligns with Ben Naceur and Kandil's (2009) findings. Moreover, size has a significant negative correlation with the COFI, indicating that larger banks cannot generate more COFI like the smaller banks can. This finding is aligned with the results of Rahman et al. (2023). Management efficiency shows a significant negative relationship with COFI, indicating that the more efficient banks tend to charge lower intermediation costs. This aligns with the earlier findings of Rahman et al. (2018).
Industry-specific variable BSD shows a significant positive relationship with the COFI. This result is incongruent with Gupta et al.'s (2021) findings. The macroeconomic variables GDP and inflation show a significant positive relationship with COFI. The positive relationship between GDP and COFI implies that as GDP increases, COFI also increases. This finding is aligned with the results of Hanzlík and Teplý (2020). The positive relationship between inflation and COFI implies that banks charge higher margins due to inflationary pressure. This finding is consistent with Entrop et al.'s (2015) findings.
The empirical findings of equations (3)–(6) related to nonlinear and joint effects of the bank capital and ownership on COFI are presented in Model (Ⅱ) to Model (Ⅷ) of Table 7. Specifically, Model (Ⅱ) examines the nonlinear effect of bank capital, while Models (Ⅲ) and (Ⅵ) analyze the impact of ownership on COFI. Additionally, Models (Ⅳ) and (Ⅶ) explore the joint effect of ownership and capital, and Models (Ⅴ) and (Ⅷ) investigate the joint effect of ownership and the squared term of capital on the COFI.
Model Ⅱ of Table 7 reveals a significant positive relationship between bank capital and COFI, and also a significant positive relationship between the squared term of bank capital and COFI, which indicates a significant nonlinear positive effect of bank capital on the COFI (see, e.g., Deng et al., 2022; Kimeldorf et al., 1982). This suggests that as bank capital increases, COFI experiences a positive impact that strengthens as capital levels rise. This finding also indicates that well-capitalized banks can typically generate more COFI to offset their cost of capital compared to banks with lower capital, both in the short and long term. Unlike section 4.2, here, it is not rational to determine where the relationship between the two variables does not change, as this would require a reversal in the direction of their correlation (Khan & Senhadji, 2001). Therefore, the inflection point cannot be measured here. This finding supports H1, which posits that capital has a significant nonlinear relationship with COFI. Our findings support the agency cost hypothesis, which states that having a higher capital ratio can effectively reduce agency costs as it motivates banks to prioritize the interest of shareholders (Berger & Bonaccorsi di Patti, 2006; Jensen & Meckling, 1976). Furthermore, we categorized capital into high, average, and low categories to distinguish the possible relationships between bank capital and COFI. The results of the analysis, shown in columns Ⅰ, Ⅱ, and Ⅲ of Table 8, indicate that banks with high and average capital can generate more COFI than those with low capital.
In Model Ⅲ and Model Ⅵ of Table 7, the coefficient of the private ownership dummy and Islamic ownership dummy shows a significant positive relationship with the COFI, meaning that the presence of private commercial and Islamic commercial banks has a more substantial impact on the bank's COFI than state-owned and conventional banks. These findings confirm H3. These suggest that the presence of privately owned commercial banks and Islamic commercial banks has a notable positive impact on COFI and can minimize agency conflicts better than their counterparts. Moreover, Model Ⅴ reveals that the interaction between the private ownership dummy and bank capital significantly positively affects COFI. Furthermore, the interaction between private ownership and the squared term of bank capital also exhibits a significant positive association with COFI. Hence, it indicates a nonlinear positive relationship between bank capital and COFI for privately owned banks. This finding also indicates a nonlinear negative association between capital and COFI for state-owned banks and suggests that private-owned banks experience more benefits in COFI from capital increases than state-owned banks. Our findings support the "social view of government ownership" (Sapienza, 2004). This ownership view distinguishes the private and state-owned banks, with private banks maximizing profits and state-owned banks contributing to social development. According to this theory, state-owned banks aim to finance socially significant projects (Sapienza, 2004), even if doing so does not maximize profit (Chen et al., 2016). On the other hand, private-owned commercial banks are gaining more COFI to cover their expenses and protect shareholders from unforeseen situations. These findings support the agency cost hypothesis (Berger & Bonaccorsi di Patti, 2006; Jensen & Meckling, 1976).
The results from Model Ⅷ reveal interesting insights into the relationship between bank capital and COFI for both Islamic banks and conventional banks. Specifically, the study evidences that Islamic banks exhibit a nonlinear inverted U-shaped relationship between bank capital and COFI, while conventional banks display a U-shaped relationship. This finding means that while well-capitalized Islamic banks generate more COFI in the short term, well-capitalized conventional banks tend to generate more COFI in the long run, as they increase their COFI over time to cover capital costs and safeguard their shareholders from unforeseen situations. Considering the long-run effect, these findings align with the agency cost hypothesis for the conventional bank. (Berger & Bonaccorsi di Patti, 2006; Jensen & Meckling, 1976). However, the findings also suggest that the effects of capital on the COFI of Islamic commercial banks do not align with the agency cost hypothesis in the long run. This may be because maximizing shareholder profit is not the only objective of Islamic banks, according to the principles and characteristics of Islamic banking law. Furthermore, traditional agent views do not align with Islamic bank governance, and the Shariah Supervisory Board plays a key role in developing agency relationships in Islamic banks (Al-Nasser Mohammed & Muhammed, 2017). These findings validate H4 demonstrating the significant impact of the joint effect of ownership and capital on COFI.
We conduct a thorough robustness check to ensure the accuracy of our main discoveries. To accomplish this, we follow the study of Shabir et al. (2023), Gupta et al. (2023), Zheng et al. (2017b), and Alves et al. (2023). We used alternate specifications of the dependent variable to confirm the validity of our main findings. Specifically, we use the capital adequacy ratio as an alternative proxy for bank capital. Moreover, we use net interest income to average earning assets (COFI2) as an alternative proxy for COFI. The results of our re-estimated equations (2) to (6) using these proxies are presented in Tables 9 to 12. The impact of COFI and ownership on bank capital is showcased in Table 9, while the effects of different COFI categories on bank capital are displayed in Table 10. Table 11 demonstrates the impact of bank capital and ownership on COFI. Finally, Table 12 presents the effect of varying capital categories on COFI
Our study aims to understand the impact of ownership on the association between bank capital and the cost of financial intermediation. The descriptive statistics reveal that the variables conform to a normal distribution, with both the mean and standard deviation values appearing promising. Notably, BSD has a higher standard deviation, while COFI1 has a lower one. Moreover, the correlation matrix and variance inflation factor demonstrate no multicollinearity in the dataset, and the variable relationship is typical. We employ the highly efficient and dependable two-step system GMM technique to acquire results, and we also carry out a robustness test using alternative proxies of dependent variables. The analysis shows that COFI has a significant positive effect on bank capital, which aligns with the findings of Rahman et al. (2017) but differs from the results of Ahmad et al. (2009). The analyses show that higher COFI increases bank capital and gives managers better access to capital. Our study also uncovered a significant inverted U-shaped relationship between COFI and bank capital. In other words, there is a positive link between COFI and the bank until the inflection point, after which the relationship becomes negative. This finding partially accepts H1, and also supports and contradicts the charter value hypothesis, which suggests that more efficient banks opt for a high capital ratio, and higher earnings provide bank managers with easy access to capital and self-regulatory incentives for risk minimization (Berger & Bonaccorsi di Patti, 2006; Saunders & Wilson, 2001). Additionally, banks with average and low COFI can source more capital than those with high COFI levels. On the other hand, capital has a significant positive effect on the COFI, corresponding with previous findings of Shabir et al. (2023). This finding indicates that higher capital leads to a higher COFI. We also observe a significant, nonlinear positive correlation between capital and COFI, meaning that as banks increase their capital, COFI experiences a progressively stronger impact. This result suggests that well-capitalized banks are better equipped to generate COFI and offset their cost of capital than their less-capitalized counterparts in the short and long term. Our results support the agency cost hypothesis by demonstrating that a higher capital ratio can reduce agency costs and motivate banks to prioritize shareholder interests (Berger & Bonaccorsi di Patti, 2006; Jensen & Meckling, 1976). Additionally, banks with average capital can generate more COFI than those with high and low COFI.
Again, our findings reveal that the presence of private commercial banks and Islamic commercial banks have less significant effects on ensuring and sourcing more capital than state-owned and conventional banks. Specifically, our analysis suggests an inverted U-shaped relationship between COFI and bank capital, which is more pronounced in state-owned and Islamic commercial banks. The presence of these types of banks further strengthens this nonlinear relationship. Again, privately owned commercial banks exhibit a nonlinear U-shaped relationship between COFI and bank capital. These results suggest that while state-owned banks can initially source more capital as COFI rises, their capital base may decrease in the long run due to poor performance. Conversely, privately owned commercial banks may initially source less capital as COFI increases but can increase their capital in the long run. The inverted U-shaped (U-shaped) curve for Islamic (conventional) banks indicates that they initially source more (less) capital as COFI increases but ultimately can source less (more) capital in the long run. These findings suggest that, in the long run, the capital of Islamic banks decreases as COFI rises, possibly due to their poor performance. On the other hand, conventional banks have seen increased capital, possibly due to their better performance in the long run (see, e.g., Cornett et al. (2010). These results support our third hypothesis and also align with the political view of state ownership.
Furthermore, our study has shown that the presence of private commercial banks and Islamic commercial banks have more significant effects on COFI than the state-owned and conventional banks. The study also identifies that private-owned banks have a nonlinear positive relationship between bank capital and COFI, which suggests that they may experience more benefits in COFI from capital increases than the state-owned banks. However, private-owned commercial banks are gaining more COFI to cover expenses and protect shareholders from unforeseen situations. Islamic banks exhibit a nonlinear inverted U-shaped relationship between bank capital and COFI, while conventional banks display a U-shaped relationship. The findings mean that while well-capitalized Islamic banks may generate more COFI in the short term, well-capitalized conventional banks tend to generate more COFI in the long term as they increase their COFI over time to cover capital costs and safeguard their shareholders from unforeseen situations. These findings support our third hypothesis and also align with the social view of government ownership and the agency cost hypothesis.
This study empirically examines how ownership influences the relationship between bank capital and the COFI Bangladeshi banks from 2010 to 2021. Several studies focused on individual capital and the COFI measures, ignoring the simultaneous relationship between capital and the COFI and the ownership effect on that nexus. To fill this gap, we investigated the mediating role of ownership in the concurrent relationship between bank capital and the COFI in an emerging economy. This study considered bank capital and the cost of financial intermediation as dependent variables, while ownership, banking sector development (BSD), GDP, inflation, risk, income diversification, bank size, profitability, liquidity, and management efficiency were independent variables. To identify potential nonlinear effects, we categorized the bank capital and COFI variables into high, average, and low categories. Given the nature of the data and pre-diagnostic tests, we employed the two-step system GMM for regression analysis. To ensure the validity of our findings, we conducted a robustness check using different specifications for the dependent variables.
The study's findings specified a significant bidirectional nonlinear relationship between bank capital and the cost of financial intermediation. This suggests an optimum COFI level where sourcing capital can be maximized. However, due to bank capital's nonlinear and consistent effects on COFI, our research does not provide any evidence to determine an optimal capital level for maximum COFI. Our specifications do not provide any evidence for defining the optimal capital level or COFI level. Our findings support the agency cost hypothesis and also support as well as reject the charter value hypothesis. Our results suggest that banks with average and low COFI can source more capital than those with high COFI and that banks with high and average capital can maximize their COFI compared to those with low capital bases.
Our study provided significant evidence of the ownership effect on the simultaneous relationship between capital and COFI. Our findings indicated that state-owned and conventional commercial banks are better positioned to source capital. The state-owned banks and Islamic commercial banks strengthen the inverted U-shaped relationship between COFI and bank capital than private-owned and conventional commercial banks. Additionally, our study showed that state-owned banks are more adept at acquiring capital when COFI rises. However, their capital foundations tend to decrease gradually, aligning with the "political view of government ownership" (Sapienza, 2004). Our results also indicated that the capital of Islamic banks has decreased with the increase of COFI in the long run, which can be attributed to their poor performance. On the other hand, conventional commercial banks have experienced increased capital in the long run as COFI has gone up, which could be attributed to their superior performance (see, e.g., (Cornett et al., 2010)).
Again, when considering the effect of capital on the COFI with ownership effects, the study discovered that private commercial banks have a more significant effect on strengthening the nonlinear positive relationship between bank capital and COFI than state-owned commercial banks. In addition, the study found that state-owned banks do not experience the same benefits in COFI from capital increases as privately owned banks, which supports the "social view of government ownership". The study also showed that conventional commercial banks increase their COFI over time to cover the cost of capital and protect their shareholders from unforeseen situations, aligning with the agency cost hypothesis. However, the long-run effects of capital on the COFI of Islamic banks do not support the agency cost hypothesis, possibly due to the principles and characteristics of Islamic banks.
The findings of this study highlighted the heterogeneous bi-directional interrelationship between capital and the COFI, considering the ownership effect. So, the results provide significant policy implications, particularly for emerging nations like Bangladesh. Banks behave differently regarding charging for financial intermediation at different periods. Therefore, policymakers should closely monitor the behavior and incentives of different banks to ensure an efficient market, encouraging them to share information appropriately. In addition, regulators should be vigilant about banks' capital financing. While higher capital can minimize risk and strengthen shareholder value, it can also increase the banks' weighted average cost of capital, raising the COFI. Moreover, banks must exercise prudence in capital financing and charging margins, considering market segmentation based on depositors' and borrowers' qualities and capabilities (Dell'Ariccia & Marquez, 2004). Policymakers and regulators must keep a watchful eye on banks to ensure a fair and efficient financial system.
In conclusion, this study solely examined the influence of ownership on the capital-COFI relationship within a single nation and did not consider the transnational ramifications. However, we intend to explore this aspect in future research endeavors.
The authors declare that no Artificial Intelligence (AI) tools were utilized in developing this article.
This research received no grants from public, commercial, or not-for-profit sectors.
All authors declare no conflicts of interest.
Conceptualization: Changjun Zheng, Md Mohiuddin Chowdhury, and Anupam Das Gupta;
Methodology: Md Mohiuddin Chowdhury. and Anupam Das Gupta;
Formal Analysis: Md Mohiuddin Chowdhury. and Anupam Das Gupta;
Original Draft Preparation: Md Mohiuddin Chowdhury;
Review and Editing: Md Mohiuddin Chowdhury, Changjun Zheng, and Anupam Das Gupta;
Supervision: Changjun Zheng
| Null Hypothesis | Two Lags | Three Lags | Four Lags | |||
| F-statistics | Probability | F-statistics | Probability | F- Statistics | Probability | |
| ECTA does not Granger Cause COFI | 0.6158 | 0.5406 | 2.0969 | 0.0198** | 2.6034 | 0.000*** |
| COFI does not Granger Cause ECTA | 1.2413 | 0.2899 | 5.1543 | 0.0016*** | 6.7039 | 0.0000*** |
| Note: The asterisks represent different significance levels, where *** indicates 1% and ** indicates 5%. | ||||||
DownLoad:
CSV
| [1] |
Abbas F, Ali S, Ahmad M (2023) Does economic growth affect the relationship between banks' capital, liquidity and profitability: empirical evidence from emerging economies. J Econ Admin Sci 39: 366–381. https://doi.org/10.1108/JEAS-03-2021-0056 doi: 10.1108/JEAS-03-2021-0056

|
| [2] |
Agoraki MEK, Kouretas GP (2019) The determinants of net interest margin during transition. Rev Quant Financ Account 53: 1005–1029. https://doi.org/10.1007/s11156-018-0773-y doi: 10.1007/s11156-018-0773-y
|
| [3] |
Ahmad R, Albaity M (2019) The determinants of bank capital for East Asian countries. Glob Bus Rev 20: 1311–1323. https://doi.org/10.1177/0972150919848915 doi: 10.1177/0972150919848915
|
| [4] |
Ahmad R, Ariff M, Skully MJ (2009) The Determinants of Bank Capital Ratios in a Developing Economy. Asia Pac Financ Mark 15: 255–272. https://doi.org/10.1007/s10690-009-9081-9 doi: 10.1007/s10690-009-9081-9
|
| [5] |
Aktas R, Acikalin S, Bakin B, et al. (2015) The determinants of banks' capital adequacy ratio: Some evidence from South Eastern European countries. J Econ Behav Stud 7: 79–88. https://doi.org/10.22610/jebs.v7i1(J).565 doi: 10.22610/jebs.v7i1(J).565
|
| [6] |
Al-Harbi A (2019) The determinants of conventional banks profitability in developing and underdeveloped OIC countries. J Econ Financ Adm Sci 24: 4–28. https://doi.org/10.1108/JEFAS-05-2018-0043 doi: 10.1108/JEFAS-05-2018-0043
|
| [7] | Al-Hares OM, AbuGhazaleh NM, El-Galfy AM (2013) Financial performance and compliance with Basel Ⅲ capital standards: Conventional vs. Islamic banks. J Appl Bus Res 29: 1031–1048. |
| [8] |
Al-Nasser Mohammed SAS, Muhammed J (2017) The relationship between agency theory, stakeholder theory and Shariah supervisory board in Islamic banking: An attempt towards discussion. Humanomics 33: 75–83. https://doi.org/10.1108/H-08-2016-0062 doi: 10.1108/H-08-2016-0062
|
| [9] |
Allen L (1988) The Determinants of Bank Interest Margins: A Note. J Financ Quant Anal 23: 231–235. https://doi.org/10.2307/2330883 doi: 10.2307/2330883
|
| [10] |
Alqahtani F, Mayes DG, Brown K (2016) Economic turmoil and Islamic banking: Evidence from the Gulf Cooperation Council. Pac-Basin Financ J 39: 44–56. https://doi.org/10.1016/j.pacfin.2016.05.017 doi: 10.1016/j.pacfin.2016.05.017
|
| [11] |
Alshammari T (2022) State ownership and bank performance: conventional vs Islamic banks. J Islamic Account Bus Res 13: 141–156. https://doi.org/10.1108/JIABR-06-2021-0161 doi: 10.1108/JIABR-06-2021-0161
|
| [12] |
Alves CF, Citterio A, Marques BP (2023) Bank-specific capital requirements: Short and long-run determinants. Financ Res Lette 52: 103558. https://doi.org/10.1016/j.frl.2022.103558 doi: 10.1016/j.frl.2022.103558
|
| [13] |
Alvi MA, Akhtar K, Rafique A (2021) Does efficiency play a transmission role in the relationship between competition and stability in the banking industry? New evidence from South Asian economies. J Public Aff 21. https://doi.org/10.1002/pa.2678 doi: 10.1002/pa.2678
|
| [14] |
Angbazo L (1997) Commercial bank net interest margins, default risk, interest-rate risk, and off-balance sheet banking. J Bank Financ 21: 55–87. https://doi.org/10.1016/S0378-4266(96)00025-8 doi: 10.1016/S0378-4266(96)00025-8
|
| [15] |
Archarya VV, Mehran H, Schuermann T, et al. (2012) Robust capital regulation. Curr Issues Econ Financ 18: 1–11. https://doi.org/10.2139/ssrn.2070102 doi: 10.2139/ssrn.2070102
|
| [16] |
Arellano M, Bover O (1995) Another look at the instrumental variable estimation of error-components models. J Econometrics 68: 29–51. https://doi.org/10.1016/0304-4076(94)01642-D doi: 10.1016/0304-4076(94)01642-D
|
| [17] |
Balla E, Rose MJ (2019) Earnings, risk-taking, and capital accumulation in small and large community banks. J Bank Financ 103: 36–50. https://doi.org/10.1016/j.jbankfin.2019.03.005 doi: 10.1016/j.jbankfin.2019.03.005
|
| [18] | Bangladesh Bank (2022) Annual Report. Available from: https://www.bb.org.bd/pub/annual/anreport/ar2122.pdf. |
| [19] |
Barajas A, Steiner R, Salazar N (2000) The impact of liberalization and foreign investment in Colombia's financial sector. J Dev Econ 63: 157–196. https://doi.org/10.1016/S0304-3878(00)00104-8 doi: 10.1016/S0304-3878(00)00104-8
|
| [20] |
Barra C, Ruggiero N (2021) Do microeconomic and macroeconomic factors influence Italian bank credit risk in different local markets? Evidence from cooperative and non-cooperative banks. J Econ Bus 114: 105976. https://doi.org/10.1016/j.jeconbus.2020.105976 doi: 10.1016/j.jeconbus.2020.105976
|
| [21] | Basel Committee on Banking Supervision (2009) Strengthening the resilience of the banking sector. B. f. I. Settlements. Available from: https://www.bis.org/publ/bcbs164.pdf. |
| [22] | Basel Committee on Banking Supervision (2010) An assessment of the long-term economic impact of stronger capital and liquidity requirements. B. f. I. Settlements. Available from: https://www.bis.org/publ/bcbs173.pdf. |
| [23] |
Ben Naceur S, Kandil M (2009) The impact of capital requirements on banks' cost of intermediation and performance: The case of Egypt. J Econ Bus 61: 70–89. https://doi.org/10.1016/j.jeconbus.2007.12.001 doi: 10.1016/j.jeconbus.2007.12.001
|
| [24] |
Berger AN, Bonaccorsi di Patti E (2006) Capital structure and firm performance: A new approach to testing agency theory and an application to the banking industry. J Bank Financ 30: 1065–1102. https://doi.org/10.1016/j.jbankfin.2005.05.015 doi: 10.1016/j.jbankfin.2005.05.015
|
| [25] |
Berger AN, Demirgüç-Kunt A, Moshirian F, et al. (2021) The way forward for banks during the COVID-19 crisis and beyond: Government and central bank responses, threats to the global banking industry. J Bank Financ 133: 106303. https://doi.org/10.1016/j.jbankfin.2021.106303 doi: 10.1016/j.jbankfin.2021.106303
|
| [26] |
Berger AN, Herring RJ, Szegö GP (1995) The role of capital in financial institutions. J Bank Financ 19: 393–430. https://doi.org/10.1016/0378-4266(95)00002-X doi: 10.1016/0378-4266(95)00002-X
|
| [27] |
Berger AN, Klapper LF, Turk-Ariss R (2009) Bank Competition and Financial Stability. J Financ Serv Res 35: 99–118. https://doi.org/10.1007/s10693-008-0050-7 doi: 10.1007/s10693-008-0050-7
|
| [28] |
Berger AN, Öztekin Ö, Roman RA (2023) Geographic deregulation and bank capital structure. J Bank Financ 149: 106761. https://doi.org/10.1016/j.jbankfin.2023.106761 doi: 10.1016/j.jbankfin.2023.106761
|
| [29] | Berle A, Means G (1932) The modern corporation and private property. Harcourt, Brace & World, Inc, New York, NY. |
| [30] |
Blundell R, Bond S (1998) Initial conditions and moment restrictions in dynamic panel data models. J Econometrics 87: 115–143. https://doi.org/10.1016/S0304-4076(98)00009-8 doi: 10.1016/S0304-4076(98)00009-8
|
| [31] | Bock RD, Demyanets A (2012) Bank Asset Quality in Emerging Markets: Determinants and Spillovers. I. M. Fund. Available from: https://www.elibrary.imf.org. |
| [32] |
Bougatef K, Mgadmi N (2016) The impact of prudential regulation on bank capital and risk-taking: The case of MENA countries. Span Rev Financ Econ 14: 51–56. https://doi.org/10.1016/j.srfe.2015.11.001 doi: 10.1016/j.srfe.2015.11.001
|
| [33] |
Carsamer E, Abbam A, Queku YN (2022) Bank capital, liquidity and risk in Ghana. J Financ Regul Compl 30: 149–166. https://doi.org/10.1108/JFRC-12-2020-0117 doi: 10.1108/JFRC-12-2020-0117
|
| [34] |
Chen YS, Chen Y, Lin CY, et al. (2016) Is there a bright side to government banks? Evidence from the global financial crisis. J Financ Stabil 26: 128–143. https://doi.org/10.1016/j.jfs.2016.08.006 doi: 10.1016/j.jfs.2016.08.006
|
| [35] |
Claeys S, Vander Vennet R (2008) Determinants of bank interest margins in Central and Eastern Europe: A comparison with the West. Econ Syst 32: 197–216. https://doi.org/10.1016/j.ecosys.2007.04.001 doi: 10.1016/j.ecosys.2007.04.001
|
| [36] |
Clarke GRG, Cull R, Shirley MM (2005) Bank privatization in developing countries: A summary of lessons and findings. J Bank Financ 29: 1905–1930. https://doi.org/10.1016/j.jbankfin.2005.03.006 doi: 10.1016/j.jbankfin.2005.03.006
|
| [37] |
Cornett MM, Guo L, Khaksari S, et al. (2010) The impact of state ownership on performance differences in privately-owned versus state-owned banks: An international comparison. J Financ Intermed 19: 74–94. https://doi.org/10.1016/j.jfi.2008.09.005 doi: 10.1016/j.jfi.2008.09.005
|
| [38] |
Cruz-García P, Fernández de Guevara J (2019) Determinants of net interest margin: the effect of capital requirements and deposit insurance scheme. Eu J Financ 26: 1102–1123. https://doi.org/10.1080/1351847X.2019.1700149 doi: 10.1080/1351847X.2019.1700149
|
| [39] |
Demirgüç-Kunt A, Huizinga H (1999) Determinants of Commercial Bank Interest Margins and Profitability: Some International Evidence. World Bank Econ Rev 13: 379–408. https://doi.org/10.1093/wber/13.2.379 doi: 10.1093/wber/13.2.379
|
| [40] |
Deng W, Wang J, Zhang R (2022) Measures of concordance and testing of independence in multivariate structure. J Multivariate Anal 191: 105035. https://doi.org/10.1016/j.jmva.2022.105035 doi: 10.1016/j.jmva.2022.105035
|
| [41] |
Dwumfour RA (2017) Explaining banking stability in Sub-Saharan Africa. Res Int Bus Financ 41: 260–279. https://doi.org/10.1016/j.ribaf.2017.04.027 doi: 10.1016/j.ribaf.2017.04.027
|
| [42] |
Entrop O, Memmel C, Ruprecht B, et al. (2015) Determinants of bank interest margins: Impact of maturity transformation. J Bank Financ 54: 1–19. https://doi.org/10.1016/j.jbankfin.2014.12.001 doi: 10.1016/j.jbankfin.2014.12.001
|
| [43] |
Fernández-Méndez C, González VM (2019) Bank ownership, lending relationships and capital structure: Evidence from Spain. BRQ Bus Res Quart 22: 137–154. https://doi.org/10.1016/j.brq.2018.05.002 doi: 10.1016/j.brq.2018.05.002
|
| [44] |
Fiordelisi F, Marques-Ibanez D, Molyneux P (2011) Efficiency and risk in European banking. J Bank Financ 35: 1315–1326. https://doi.org/10.1016/j.jbankfin.2010.10.005 doi: 10.1016/j.jbankfin.2010.10.005
|
| [45] |
Fleming G, Heaney R, McCosker R (2005) Agency costs and ownership structure in Australia. Pac-Basin Financ J 13: 29–52. https://doi.org/10.1016/j.pacfin.2004.04.001 doi: 10.1016/j.pacfin.2004.04.001
|
| [46] |
Fu XM, Lin YR, Molyneux P (2014) Bank competition and financial stability in Asia Pacific. J Bank Financ 38: 64–77. https://doi.org/10.1016/j.jbankfin.2013.09.012 doi: 10.1016/j.jbankfin.2013.09.012
|
| [47] |
Fungáčová Z, Poghosyan T (2011) Determinants of bank interest margins in Russia: Does bank ownership matter? Econ Syst 35: 481–495. https://doi.org/10.1016/j.ecosys.2010.11.007 doi: 10.1016/j.ecosys.2010.11.007
|
| [48] |
Garel A, Petit-Romec A, Vennet RV (2022) Institutional Shareholders and Bank Capital. J Financ Intermed 50: 100960. https://doi.org/10.1016/j.jfi.2022.100960 doi: 10.1016/j.jfi.2022.100960
|
| [49] |
Gertler M, Kiyotaki N, Queralto A (2012) Financial crises, bank risk exposure and government financial policy. J Monetary Econ 59: S17–S34. https://doi.org/10.1016/j.jmoneco.2012.11.007 doi: 10.1016/j.jmoneco.2012.11.007
|
| [50] |
Gharaibeh AMO (2023) The Determinants of Capital Adequacy in the Jordanian Banking Sector: An Autoregressive Distributed Lag-Bound Testing Approach. Int J Financ Stud 11: 75. https://doi.org/https://doi.org/10.3390/ijfs11020075 doi: 10.3390/ijfs11020075
|
| [51] | Gitman LJ, Zutter CJ (2015) Principles of Managerial Finance (6th ed.). Pearson Higher Education AU. |
| [52] |
Gorton G, Winton A (1998) Banking in Transition Economies: Does Efficiency Require Instability? J Money Credit Bank 30: 621–650. https://doi.org/10.2307/2601261 doi: 10.2307/2601261
|
| [53] |
Granger CW (1969) Investigating causal relations by econometric models and cross-spectral methods. Econometrica J Econometric Soc 37: 424–438. https://doi.org/10.2307/1912791 doi: 10.2307/1912791
|
| [54] |
Gupta AD, Sarker N, Rahman MR (2021) Relationship among cost of financial intermediation, risk, and efficiency: Empirical evidence from Bangladeshi commercial banks. Cogent Econ Financ 9: 1967575. https://doi.org/10.1080/23322039.2021.1967575 doi: 10.1080/23322039.2021.1967575
|
| [55] |
Gupta AD, Yesmin A (2022) Effect of Risk and Market Competition on Efficiency of Commercial Banks: Does Ownership Matter. J Bus Econ Financ 11: 22–42. https://doi.org/10.17261/Pressacademia.2022.1550 doi: 10.17261/Pressacademia.2022.1550
|
| [56] |
Gupta J, Kashiramka S, Ly KC, et al. (2023) The interrelationship between bank capital and liquidity creation: A non-linear perspective from the Asia-Pacific region. Int Rev Econ Financ 85: 793–820. https://doi.org/10.1016/j.iref.2023.02.017 doi: 10.1016/j.iref.2023.02.017
|
| [57] |
Gupta N, Mahakud J, McMillan D (2020) Ownership, bank size, capitalization and bank performance: Evidence from India. Cogent Econ Financ 8. https://doi.org/10.1080/23322039.2020.1808282 doi: 10.1080/23322039.2020.1808282
|
| [58] |
Gupta PK, Sharma S (2023) Role of corporate governance in asset quality of banks: comparison between government-owned and private banks. Manag Financ 49: 724–740. https://doi.org/10.1108/MF-04-2022-0165 doi: 10.1108/MF-04-2022-0165
|
| [59] |
Hanzlík P, Teplý P (2020) Key factors of the net interest margin of European and US banks in a low interest rate environment. Int J Financ Econ 27: 2795–2818. https://doi.org/10.1002/ijfe.2299 doi: 10.1002/ijfe.2299
|
| [60] |
Haris M, Tan Y, Malik A, et al. (2020) A study on the impact of capitalization on the profitability of banks in emerging markets: A case of Pakistan. J Risk Financ Manage 13: 217. https://doi.org/10.3390/jrfm13090217 doi: 10.3390/jrfm13090217
|
| [61] |
Ho TSY, Saunder A (1981) The determinants of bank interest margins: theory and empirical evidence. J Financ Quant Anal 16: 581–600. https://doi.org/10.2307/2330377 doi: 10.2307/2330377
|
| [62] |
Huang FW, Chen S, Tsai JY (2019) Optimal bank interest margin under capital regulation: bank as a liquidity provider. J Financ Econ Policy 11: 158–173. https://doi.org/10.1108/JFEP-12-2017-0124 doi: 10.1108/JFEP-12-2017-0124
|
| [63] |
Hussain M, Bashir U (2020) Risk-competition nexus: Evidence from Chinese banking industry. Asia Pac Manag Rev 25: 23–37. https://doi.org/10.1016/j.apmrv.2019.06.001 doi: 10.1016/j.apmrv.2019.06.001
|
| [64] |
Iannotta G, Nocera G, Sironi A (2013) The impact of government ownership on bank risk. J Financ Int 22: 152–176. https://doi.org/10.1016/j.jfi.2012.11.002 doi: 10.1016/j.jfi.2012.11.002
|
| [65] |
Islam MS, Nishiyama SI (2016) The determinants of bank net interest margins: A panel evidence from South Asian countries. Res Int Bus Financ 37: 501–514. https://doi.org/10.1016/j.ribaf.2016.01.024 doi: 10.1016/j.ribaf.2016.01.024
|
| [66] |
Jensen MC, Meckling WH (1976) Theory of the firm: Managerial behaviour, agency costs and ownership structure. J Financ Econ 3: 305–360. https://doi.org/10.1016/0304-405X(76)90026-X doi: 10.1016/0304-405X(76)90026-X
|
| [67] |
Jiang C, Liu H, Molyneux P (2019) Do different forms of government ownership matter for bank capital behavior? Evidence from China. J Financ Stabil 40: 38–49. https://doi.org/10.1016/j.jfs.2018.11.005 doi: 10.1016/j.jfs.2018.11.005
|
| [68] |
Jones JD (1989) A comparison of lag–length selection techniques in tests of Granger causality between money growth and inflation: evidence for the US, 1959–86. Appl Econ 21: 809–822. https://doi.org/https://doi.org/10.1080/758520275 doi: 10.1080/758520275
|
| [69] |
Kanapiyanova K, Faizulayev A, Ruzanov R, et al. (2023) Does social and governmental responsibility matter for financial stability and bank profitability? Evidence from commercial and Islamic banks. J Islamic Account Bus Res 14: 451–472. https://doi.org/10.1108/JIABR-01-2022-0004 doi: 10.1108/JIABR-01-2022-0004
|
| [70] |
Kasman S, Kasman A (2015) Bank competition, concentration and financial stability in the Turkish banking industry. Econ Syst 39: 502–517. https://doi.org/10.1016/j.ecosys.2014.12.003 doi: 10.1016/j.ecosys.2014.12.003
|
| [71] |
Khan MS, Senhadji AS (2001) Threshold effects in the relationship between inflation and growth. IMF Staff Papers 48: 1–21. https://doi.org/10.2307/4621658 doi: 10.2307/4621658
|
| [72] | Kimeldorf G, May JH, Sampson AR (1982) Concordant and discordant monotone correlations and their evaluation by nonlinear optimization. Stud Manag Sci 19: 117–130. https://apps.dtic.mil/sti/pdfs/ADA093816.pdf |
| [73] |
La Porta R, Lopez‐de‐Silanes F, Shleifer A (2002) Government ownership of banks. J Financ 57: 265–301. https://doi.org/10.1111/1540-6261.00422 doi: 10.1111/1540-6261.00422
|
| [74] |
Lazopoulos I (2013) Liquidity uncertainty and intermediation. J Bank Financ 37: 403–414. https://doi.org/10.1016/j.jbankfin.2012.09.026 doi: 10.1016/j.jbankfin.2012.09.026
|
| [75] |
Lepetit L, Saghi-Zedek N, Tarazi A (2015) Excess control rights, bank capital structure adjustments, and lending. J Financ Econ 115: 574–591. https://doi.org/10.1016/j.jfineco.2014.10.004 doi: 10.1016/j.jfineco.2014.10.004
|
| [76] | Levine R (1997) Financial Development and Economic Growth: Views and Agenda. J Econ lit 35: 688–726. https://www.jstor.org/stable/2729790 |
| [77] |
Liu Y, Brahma S, Boateng A (2020) Impact of ownership structure and ownership concentration on credit risk of Chinese commercial banks. Int J Manag Financ 16: 253–272. https://doi.org/10.1108/IJMF-03-2019-0094 doi: 10.1108/IJMF-03-2019-0094
|
| [78] |
Marinkovic S, Radovic O (2010) On the determinants of interest margin in transition banking: the case of Serbia. Manag Financ 36: 1028–1042. https://doi.org/10.1108/03074351011088432 doi: 10.1108/03074351011088432
|
| [79] |
Mateev M, Nasr T (2023) Banking system stability in the MENA region: the impact of market power and capital requirements on banks' risk-taking behavior. Int J Islamic Middle Eastern Financ Manag 16: 1107–1140. https://doi.org/10.1108/IMEFM-05-2022-0198 doi: 10.1108/IMEFM-05-2022-0198
|
| [80] |
Mateev M, Tariq MU, Sahyouni A (2021) Competition, capital growth and risk-taking in emerging markets: Policy implications for banking sector stability during COVID-19 pandemic. PLoS One 16: e0253803. https://doi.org/10.1371/journal.pone.0253803 doi: 10.1371/journal.pone.0253803
|
| [81] |
Maudos Jn, Fernández de Guevara J (2004) Factors explaining the interest margin in the banking sectors of the European Union. J Bank Financ 28: 2259–2281. https://doi.org/10.1016/j.jbankfin.2003.09.004 doi: 10.1016/j.jbankfin.2003.09.004
|
| [82] |
McShane RW, Sharpe IG (1985) A time series/cross section analysis of the determinants of Australian trading bank loan/deposit interest margins: 1962–1981. J Bank Financ 9: 115–136. https://doi.org/10.1016/0378-4266(85)90065-2 doi: 10.1016/0378-4266(85)90065-2
|
| [83] |
Mehrotra P, Vyas V, Naik PK (2023) Behaviour of Capital and Risk Under Basel Regulations: A Simultaneous Equations Model Study of Indian Commercial Banks. Glob Bus Rev 1–19. https://doi.org/10.1177/09721509221146059 doi: 10.1177/09721509221146059
|
| [84] |
Mehzabin S, Shahriar A, Hoque MN, et al. (2023) The effect of capital structure, operating efficiency and non-interest income on bank profitability: new evidence from Asia. Asian J Econ Bank 7: 25–44. https://doi.org/10.1108/AJEB-03-2022-0036 doi: 10.1108/AJEB-03-2022-0036
|
| [85] | Mekonnen Y (2015) Determinants of capital adequacy of Ethiopia commercial banks. Eu Sci J 11: 315–331. https://eujournal.org/index.php/esj/article/view/6222 |
| [86] |
Mia MDR (2023) Market competition, capital regulation and cost of financial intermediation: an empirical study on the banking sector of Bangladesh. Asian J Econ Bank 7: 251–276. https://doi.org/10.1108/AJEB-03-2022-0028 doi: 10.1108/AJEB-03-2022-0028
|
| [87] | Modigliani F, Miller MH (1958) The Cost of Capital, Corporation Finance and the Theory of Investment. Am Econ Rev 48: 261–297. https://www.jstor.org/stable/1809766 |
| [88] |
Moudud-Ul-Huq S (2021) Does bank competition matter for performance and risk-taking? Empirical evidence from BRICS countries. Int J Emerg Mark 16: 409–447. https://doi.org/10.1108/IJOEM-03-2019-0197 doi: 10.1108/IJOEM-03-2019-0197
|
| [89] |
Moudud-Ul-Huq S, Ahmed K, Chowdhury MAF, et al. (2022) How do banks' capital regulation and risk-taking respond to COVID-19? Empirical insights of ownership structure. Int J Islamic Middle Eastern Financ Manag 15: 406–424. https://doi.org/10.1108/IMEFM-07-2020-0372 doi: 10.1108/IMEFM-07-2020-0372
|
| [90] | Moussa MAB (2018) Determinants of bank capital: Case of Tunisia. J Appl Financ Bank 8: 1–15. Available from: http://www.scienpress.com/Upload/JAFB/Vol%208_2_1.pdf. |
| [91] |
Mujtaba G, Akhtar Y, Ashfaq S, et al. (2021) The nexus between Basel capital requirements, risk-taking and profitability: what about emerging economies? Econ Res-Ekon Istraž 1–22. https://doi.org/10.1080/1331677X.2021.1890177 doi: 10.1080/1331677X.2021.1890177
|
| [92] |
Nguyen TPT, Nghiem SH (2015) The interrelationships among default risk, capital ratio and efficiency. Manag Financ 41: 507–525. https://doi.org/10.1108/MF-12-2013-0354 doi: 10.1108/MF-12-2013-0354
|
| [93] |
Nickell S (1981) Biases in dynamic models with fixed effects. Econometrica: J Econometric Soc 49: 1417–1426. https://doi.org/10.2307/1911408 doi: 10.2307/1911408
|
| [94] |
Otero L, Razia A, Cunill OM, et al. (2020) What determines efficiency in MENA banks? J Bus Res 112: 331–341. https://doi.org/10.1016/j.jbusres.2019.11.002 doi: 10.1016/j.jbusres.2019.11.002
|
| [95] |
Ozili PK, Uadiale O (2017) Ownership concentration and bank profitability. Futur Bus J 3: 159–171. https://doi.org/10.1016/j.fbj.2017.07.001 doi: 10.1016/j.fbj.2017.07.001
|
| [96] |
Peia O, Vranceanu R (2018) The cost of capital in a model of financial intermediation with coordination frictions. Oxford Econ Pap 70: 266–285. https://doi.org/10.1093/oep/gpx037 doi: 10.1093/oep/gpx037
|
| [97] |
Poghosyan T (2010) Re-examining the impact of foreign bank participation on interest margins in emerging markets. Emerg Mark Rev 11: 390–403. https://doi.org/10.1016/j.ememar.2010.08.003 doi: 10.1016/j.ememar.2010.08.003
|
| [98] |
Pushner GM (1995) Equity ownership structure, leverage, and productivity: Empirical evidence from Japan. Pac-Basin Financ J 3: 241–255. https://doi.org/10.1016/0927-538X(95)00003-4 doi: 10.1016/0927-538X(95)00003-4
|
| [99] |
Puspitasari E, Sudiyatno B, Hartoto WE, et al. (2021) Net interest margin and return on assets: A Case Study in Indonesia. J Asian Financ Econ Bus 8: 727–734. https://doi.org/10.13106/jafeb.2021.vol8.no4.0727 doi: 10.13106/jafeb.2021.vol8.no4.0727
|
| [100] |
Raharjo PG, Hakim DB, Manurung AH, et al. (2014) Determinant of capital ratio: A panel data analysis on state-owned banks in Indonesia. Bull Monetary Econ Bank 16: 395–414. https://doi.org/10.21098/bemp.v16i4.19 doi: 10.21098/bemp.v16i4.19
|
| [101] |
Rahman M, Ashraf B, Zheng C, et al. (2017) Impact of Cost Efficiency on Bank Capital and the Cost of Financial Intermediation: Evidence from BRICS Countries. Int J Financ Stud 5: 32. https://doi.org/10.3390/ijfs5040032 doi: 10.3390/ijfs5040032
|
| [102] |
Rahman MM, Rahman M, Masud MAK (2023) Determinants of the Cost of Financial Intermediation: Evidence from Emerging Economies. Int J Financ Stud 11. https://doi.org/10.3390/ijfs11010011 doi: 10.3390/ijfs11010011
|
| [103] |
Rahman MM, Zheng C, Ashraf BN, et al. (2018) Capital requirements, the cost of financial intermediation and bank risk-taking: Empirical evidence from Bangladesh. Res Int Bus Financ 44: 488–503. https://doi.org/10.1016/j.ribaf.2017.07.119 doi: 10.1016/j.ribaf.2017.07.119
|
| [104] |
Rakshit B, Bardhan S (2019) Bank Competition and its Determinants: Evidence from Indian Banking. Int J Econ Bus 26: 283–313. https://doi.org/10.1080/13571516.2019.1592995 doi: 10.1080/13571516.2019.1592995
|
| [105] |
Rastogi S, Gupte R, Meenakshi R (2021) A holistic perspective on bank performance using regulation, profitability, and risk-taking with a view on ownership concentration. J Risk Financ Manag 14: 111. https://doi.org/10.3390/jrfm14030111 doi: 10.3390/jrfm14030111
|
| [106] |
Roodman D (2009) How to do xtabond2: An introduction to difference and system GMM in Stata. Stata J 9: 86–136. https://doi.org//10.1177/1536867X0900900106 doi: 10.1177/1536867X0900900106
|
| [107] |
Saeed M, Izzeldin M, Hassan MK, et al. (2020) The inter-temporal relationship between risk, capital and efficiency: The case of Islamic and conventional banks. Pac-Basin Financ J 62: 101328. https://doi.org/10.1016/j.pacfin.2020.101328 doi: 10.1016/j.pacfin.2020.101328
|
| [108] |
Saif-Alyousfi AY, Saha A (2021) Determinants of banks' risk-taking behavior, stability and profitability: Evidence from GCC countries. Int J Islamic Middle Eastern Financ Manag 14: 874–907. https://doi.org/10.1108/IMEFM-03-2019-0129 doi: 10.1108/IMEFM-03-2019-0129
|
| [109] |
Sapienza P (2004) The effects of government ownership on bank lending. J Financ Econ 72: 357–384. https://doi.org/10.1016/j.jfineco.2002.10.002 doi: 10.1016/j.jfineco.2002.10.002
|
| [110] |
Saunders A, Wilson B (2001) An analysis of bank charter value and its risk-constraining incentives. J Financ Serv Res 19: 185–195. https://doi.org/10.1023/A:1011163522271 doi: 10.1023/A:1011163522271
|
| [111] |
Sensarma R, Ghosh S (2004) Net interest margin: does ownership matter? Vikalpa 29: 41–48. https://doi.org/10.1177/0256090920040104 doi: 10.1177/0256090920040104
|
| [112] |
Shabir M, Jiang P, Wang W, et al. (2023) COVID-19 pandemic impact on banking sector: A cross-country analysis. J Multinatl Financ Manag 67: 100784. https://doi.org/10.1016/j.mulfin.2023.100784 doi: 10.1016/j.mulfin.2023.100784
|
| [113] |
Shawtari FA, Ariff M, Razak SHA (2019) Efficiency and bank margins: a comparative analysis of Islamic and conventional banks in Yemen. J Islamic Account Bus Res 10: 50–72. https://doi.org/10.1108/JIABR-07-2015-0033 doi: 10.1108/JIABR-07-2015-0033
|
| [114] |
Shleifer A, Vishny RW (1997) A survey of corporate governance. J Financ 52: 737–783. https://doi.org/10.1111/j.1540-6261.1997.tb04820.x doi: 10.1111/j.1540-6261.1997.tb04820.x
|
| [115] |
Soedarmono W, Tarazi A (2013) Bank opacity, intermediation cost and globalization: Evidence from a sample of publicly traded banks in Asia. J Asian Econ 29: 91–100. https://doi.org/10.1016/j.asieco.2013.09.003 doi: 10.1016/j.asieco.2013.09.003
|
| [116] |
Tabak BM, Fazio DM, Cajueiro DO (2012) The relationship between banking market competition and risk-taking: Do size and capitalization matter? J Bank Financ 36: 3366–3381. https://doi.org/10.1016/j.jbankfin.2012.07.022 doi: 10.1016/j.jbankfin.2012.07.022
|
| [117] |
Thompson CG, Kim RS, Aloe AM, et al. (2017) Extracting the Variance Inflation Factor and Other Multicollinearity Diagnostics from Typical Regression Results. Basic Appl Soc Psych 39: 81–90. https://doi.org/10.1080/01973533.2016.1277529 doi: 10.1080/01973533.2016.1277529
|
| [118] |
Toumi K (2019) Islamic ethics, capital structure and profitability of banks; what makes Islamic banks different? Int J Islamic Middle Eastern Financ Manag 13: 116–134. https://doi.org/10.1108/imefm-05-2016-0061 doi: 10.1108/imefm-05-2016-0061
|
| [119] |
Trinugroho I, Agusman A, Tarazi A (2014) Why have bank interest margins been so high in Indonesia since the 1997/1998 financial crisis? Res Int Bus Financ 32: 139–158. https://doi.org/10.1016/j.ribaf.2014.04.001 doi: 10.1016/j.ribaf.2014.04.001
|
| [120] |
Vo XV (2018) Bank lending behavior in emerging markets. Financ Res Lett 27: 129–134. https://doi.org/10.1016/j.frl.2018.02.011 doi: 10.1016/j.frl.2018.02.011
|
| [121] |
Yu HC (2000) Banks' capital structure and the liquid asset–policy implication of Taiwan. Pac Econ Rev 5: 109–114. https://doi.org/10.1111/1468-0106.00093 doi: 10.1111/1468-0106.00093
|
| [122] |
Zheng C, Chowdhury MM, Khan MAM, et al. (2023) Effects of ownership on the relationship between bank capital and financial performance: evidence from Bangladesh. Int J Res Bus Soc Sci 12: 260–274. https://doi.org/10.20525/ijrbs.v12i9.2787 doi: 10.20525/ijrbs.v12i9.2787
|
| [123] |
Zheng C, Gupta AD, Moudud-Ul-Huq S (2018) Do human capital and cost efficiency affect risk and capital of commercial banks? An empirical study of a developing country. Asian Econ Financ Rev 8: 22–37. https://doi.org/10.18488/journal.aefr.2018.81.22.37 doi: 10.18488/journal.aefr.2018.81.22.37
|
| 1. | Changjun Zheng, Md Mohiuddin Chowdhury, Anupam Das Gupta, Md Nazmul Islam, Muhammad Usman Tariq, Effects of competition and ownership on the simultaneous relationship between bank risk and capital: Evidence from an emerging economy of Bangladesh, 2024, 19, 1932-6203, e0311428, 10.1371/journal.pone.0311428 | |
| 2. | Liyuan Zhang, Limian Ci, Yonghong Wu, Benchawan Wiwatanapataphee, Blockchain asset portfolio optimization with proportional and fixed transaction fees, 2025, 10, 2473-6988, 6694, 10.3934/math.2025306 |
Figures(1) / Tables(13)
Changjun Zheng, Md Mohiuddin Chowdhury, Anupam Das Gupta. Investigating the influence of ownership on the relationship between bank capital and the cost of financial intermediation[J]. Data Science in Finance and Economics, 2024, 4(3): 388-421. doi: 10.3934/DSFE.2024017

| Classification | Variable | Description | Literature References/Sources |
| Capital | ECTA | Eligible capital to total assets | Mateev et al. (2021) |
| CAR | Capital Adequacy Ratio | Mehrotra et al. (2023) | |
| Cost of Financial Intermediation | COFI1 | Interestincome−interestexpensesTotalassets | Rahman et al. (2018) |
| COFI2 | Interestincome−interestexpensesTotalearningassets | Rahman et al. (2023) | |
| Ownership: Dummy Variables | OWNp | Takes a value of one (1) for privately owned commercial banks and zero (0) for state-owned commercial banks. | Alqahtani et al. (2016). Authors Calculation |
| OWNI | Takes a value of one (1) for Islamic commercial banks and zero (0) for conventional commercial banks. | Alqahtani et al. (2016). Authors Calculation |
|
| Banking Sector Development | BSD | Banking industry asset to gross domestic product | Gupta et al. (2021). Source: World Bank data |
| Gross Domestic Product | GDP | Growth of gross domestic product (per capita growth) | Shabir et al. (2023). Source: World Bank data |
| Inflation | Inflation | Annual rate of inflation - Consumer Prices (%) | Entrop et al. (2015) Source: World Bank data |
| Risk | LLPTL | Loan loss provision to total loan | Garel et al. (2022) |
| Income Diversification | ID | Non-interest income to total assets | Sensarma and Ghosh (2004) |
| Bank Size | Size | The logarithm of total assets | Shabir et al. (2023) |
| Profitability | ROA | The ratio of net income to total assets | Carsamer et al. (2022) |
| Liquidity | NLTA | Net loan to total assets | Saeed et al. (2020) |
| Management Efficiency | ME | The ratio of earning assets to total assets | Rahman et al. (2017) |
| High COFI | Dummy Variable | Equal to 1, if COFI≥¯COFI+0.5σCOFI, otherwise 0 | Source: The Authors |
| Low COFI | Dummy Variable | Equal to 1, if COFI≤¯COFI−0.5σCOFI, otherwise 0 | Source: The Authors |
| Avg COFI | Dummy Variable | Equal to 1, if ¯COFI−0.5σCOFI<CoFI<¯COFI+0.5σCOFI, otherwise 0 | Source: The Authors |
| High Capital | Dummy Variable | Equal to 1, if Capital ≥¯RNPL+0.5σRNPL, otherwise 0 | Source: The Authors |
| Low Capital | Dummy Variable | Equal to 1, if Capital ≤¯RNPL−0.5σRNPL, otherwise 0 | Source: The Authors |
| Avg Capital | Dummy Variable | Equal to 1, if ¯RNPL−0.5σRNPL<Capital<¯RNPL+0.5σRNPL, otherwise 0 | Source: The Authors |
| Source: Author's compilation using the mentioned sources/references. | |||
DownLoad:
CSV
| Variable | Obs | Mean | Std. Dev. | Min | Max |
| ECTA | 494 | 0.106 | 0.086 | −0.153 | 0.809 |
| CAR | 494 | 0.149 | 0.175 | −0.284 | 2.207 |
| COFIT1 | 494 | 0.020 | 0.012 | −0.023 | 0.077 |
| COFIT2 | 494 | 0.023 | 0.014 | −0.024 | 0.104 |
| LLPTL | 494 | 0.031 | 0.043 | 0.000 | 0.351 |
| ID | 494 | 0.025 | 0.012 | 0.000 | 0.101 |
| NLTA | 494 | 0.634 | 0.140 | 0.004 | 1.963 |
| SIZE | 494 | 12.036 | 1.017 | 8.508 | 14.355 |
| ME | 494 | 0.873 | 0.048 | 0.577 | 1.000 |
| ROA | 494 | 0.899 | 1.103 | −7.490 | 6.050 |
| BSD | 494 | 48.044 | 2.856 | 41.054 | 51.110 |
| GDP | 494 | 5.122 | 1.082 | 2.271 | 6.688 |
| Inflation | 494 | 6.539 | 1.532 | 5.514 | 11.395 |
DownLoad:
CSV
| Variable | ⅥF (Capital Equation) | ⅥF (COFI Equation) |
| ECTA | 2.016 | |
| COFI1 | 1.791 | |
| LLPTL | 1.875 | 1.873 |
| ID | 1.471 | |
| Size | 1.173 | 1.728 |
| ROA | 2.144 | |
| NLTA | 1.719 | |
| ME | 1.305 | |
| BSD | 1.097 | 1.145 |
| GDP | 1.132 | 1.084 |
| Inflation | 1.246 | 1.150 |
DownLoad:
CSV
| Variables | (1) | (2) | (3) | (4) | (5) | (6) | (7) | (8) | (9) | (10) | (11) | (12) | (13) |
| (1) ECTA | 1.000 | ||||||||||||
| (2) CAR | 0.898*** | 1.000 | |||||||||||
| (0.000) | |||||||||||||
| (3) COFIT2 | 0.316*** | 0.181*** | 1.000 | ||||||||||
| (0.000) | (0.000) | ||||||||||||
| (4) COFI1 | 0.312* | 0.166*** | 0.994*** | 1.000 | |||||||||
| (0.000) | (0.000) | (0.000) | |||||||||||
| (5) LLPTL | −0.314*** | −0.230* | −0.554*** | −0.522*** | 1.000 | ||||||||
| (0.000) | (0.000) | (0.000) | (0.000) | ||||||||||
| (6) ID | −0.097** | −0.216*** | −0.132*** | −0.117*** | 0.048 | 1.000 | |||||||
| (0.032) | (0.000) | (0.003) | (0.009) | (0.285) | |||||||||
| (7) NLTA | −0.257*** | −0.396*** | 0.439*** | 0.435*** | −0.460*** | −0.051 | 1.000 | ||||||
| (0.000) | (0.000) | (0.000) | (0.000) | (0.000) | (0.255) | ||||||||
| (8) SIZE | −0.603*** | −0.492*** | −0.299*** | −0.291*** | 0.207*** | −0.006 | 0.169*** | 1.000 | |||||
| (0.000) | (0.000) | (0.000) | (0.000) | (0.000) | (0.894) | (0.000) | |||||||
| (9) ME | 0.030 | 0.095** | 0.044 | −0.034 | −0.372*** | −0.106** | 0.319*** | −0.080* | 1.000 | ||||
| (0.504) | (0.035) | (0.330) | (0.456) | (0.000) | (0.019) | (0.000) | (0.074) | ||||||
| (10) ROA | 0.258*** | 0.098** | 0.453*** | 0.443*** | −0.566*** | 0.364*** | 0.236*** | −0.159*** | 0.024 | 1.000 | |||
| (0.000) | (0.029) | (0.000) | (0.000) | (0.000) | (0.000) | (0.000) | (0.000) | (0.591) | |||||
| (11) BSD | 0.112** | 0.089** | 0.010 | 0.020 | 0.011 | 0.025 | −0.176*** | −0.177*** | −0.170*** | −0.028 | 1.000 | ||
| (0.013) | (0.049) | (0.822) | (0.660) | (0.801) | (0.579) | (0.000) | (0.000) | (0.000) | (0.529) | ||||
| (12) GDP | −0.014 | −0.013 | 0.136*** | 0.130*** | 0.020 | −0.114** | 0.071 | 0.028 | 0.055 | −0.059 | −0.225*** | 1.000 | |
| (0.754) | (0.778) | (0.002) | (0.004) | (0.659) | (0.011) | (0.113) | (0.532) | (0.218) | (0.188) | (0.000) | |||
| (13) Inflation | 0.053 | −0.007 | 0.173*** | 0.182*** | −0.108** | 0.307*** | −0.014 | −0.208*** | −0.147*** | 0.310*** | 0.023 | −0.151*** | 1.000 |
| (0.241) | (0.874) | (0.000) | (0.000) | (0.016) | (0.000) | (0.751) | (0.000) | (0.001) | (0.000) | (0.605) | (0.001) | ||
| Note: Pearson's correlation coefficients. *** p<0.01, ** p<0.05, * p<0.1. | |||||||||||||
DownLoad:
CSV
| Variable Name |
Model Ⅰ | Model Ⅱ | OWNp | OWNI | |||||
| Model Ⅲ | Model Ⅳ | Model Ⅴ | Model Ⅵ | Model Ⅶ | Model Ⅷ | ||||
| ECTA (-1) | 0.5482*** (0.0029) |
0.6216*** (0.0027) |
0.5271*** (0.0031) |
0.6189*** (0.0028) |
0.6192*** (0.0031) |
0.6167*** (0.0031) |
0.5483*** (0.0031) |
0.5451*** (0.0034) |
|
| COFI1 | 0.2767*** (0.0361) |
0.6551*** (0.0281) |
0.4797*** (0.0403) |
0.1453*** (0.0471) |
0.1183** (0.0461) |
0.2621*** (0.0221) |
0.1606** (0.0634) |
0.2388*** (0.0598) |
|
| COFI12 | −11.7778*** (0.4671) |
||||||||
| Inflection Point | 0.0278 | ||||||||
| Ownership | −0.0234*** (0.0021) |
−0.0274*** (0.0027) |
|||||||
| Ownership ×COFI1 | −0.4889*** (0.0351) |
−0.7092*** (0.0357) |
0.1239** (0.0614) |
0.4914*** (0.0633) |
|||||
| Ownership × COFI12 | 19.8455*** (1.2798) |
−13.4958*** (2.2068) |
|||||||
| LLPTL | −0.0136** (0.0061) |
−0.0292*** (0.0053) |
−0.1518*** (0.0087) |
−0.0294*** (0.0064) |
−0.0129** (0.0055) |
−0.0448*** (0.0097) |
−0.0125** (0.0061) |
−0.0251* (0.0088) |
|
| ID | 0.2588*** (0.0351) |
0.2829*** (0.0323) |
0.2692*** (0.0392) |
0.2845*** (0.0246) |
0.2737*** (0.0284) |
−0.2366*** (0.0341) |
0.1617*** (0.0419) |
0.1267*** (0.0452) |
|
| Size | −0.0013*** (0.0002) |
−0.0014*** (0.0003) |
−0.0035*** (0.0004) |
−0.0013*** (0.0003) |
−0.0014*** (0.0003) |
−0.0035* (0.0004) |
−0.0009*** (0.0003) |
−0.0009** (0.0004) |
|
| ROA | 0.0133*** (0.0003) |
0.0128*** (0.0002) |
0.0117** (0.0002) |
0.0124*** (0.0002) |
0.0126*** (0.0002) |
0.0126*** (0.0003) |
0.0135*** (0.0003) |
0.0141*** (0.0004) |
|
| BSD | −0.0008*** (0.00006) |
−0.0007*** (0.00005) |
−0.0011*** (0.0001) |
−0.0007*** (0.00005) |
−0.0007*** (0.00004) |
−0.0004*** (0.00009) |
−0.0008*** (0.00007) |
−0.0009*** (0.00007) |
|
| GDP | −0.0012*** (0.0001) |
−0.0009*** (0.0001) |
−0.0016*** (0.0001) |
−0.0008*** (0.0001) |
−0.0008*** (0.0001) |
−0.0009*** (0.0001) |
−0.0012*** (0.0001) |
−0.0013*** (0.0001) |
|
| Inflation | −0.0031*** (0.0002) |
−0.0026*** (0.0002) |
−0.0037*** (0.0002) |
−0.0029*** (0.0001) |
−0.0027*** (0.0002) |
−0.0015*** (0.0001) |
−0.0028*** (0.0002) |
−0.0028*** (0.0002) |
|
| Constant | 0.1008*** (0.0061) |
0.0499*** (0.0061) |
0.1446*** (0.0097) |
0.0545*** (0.0054) |
0.0535*** (0.0054) |
−0.0053 (0.0091) |
0.0953*** (0.0071) |
0.0977*** (0.0073) |
|
| Hansen Test (p-value) | 0.225 | 0.216 | 0.184 | 0.233 | 0.188 | 0.278 | 0.213 | 0.270 | |
| AR (1) (p-value) |
0.042 | 0.063 | 0.037 | 0.050 | 0.048 | 0.060 | 0.044 | 0.063 | |
| AR (2) (p-value) |
0.304 | 0.305 | 0.283 | 0.276 | 0.297 | 0.313 | 0.313 | 0.337 | |
| Observations | 450 | 450 | 450 | 450 | 450 | 450 | 450 | 450 | |
| Notes: The dependent variable is capital (ECTA), calculated as the ratio of eligible capital to total assets. Standard errors are in parentheses. ***, **, and * denote the significance level at the corresponding 1%, 5%, and 10% level. The p-value of the Hansen test is referred to as J statistics. Tests for first-order (second-order) correlation using Arellano-Bond order 1 and 2 are asymptotically N (0, 1). | |||||||||
DownLoad:
CSV
| Variable Name | C Ⅰ | C Ⅱ | C Ⅲ |
| ECTA (-1) | 0.5478*** (0.0041) |
0.6237*** (0.0043) |
0.5196*** (0.0055) |
| High COFI1 | −0.0144*** (0.0029) |
||
| Avg COFI1 | 0.0031*** (0.0011) |
||
| Low COFI1 | 0.0327*** (0.0027) |
||
| All Control Variables | Yes | Yes | Yes |
| Constant | 0.1046*** (0.0079) |
0.0507*** (0.0061) |
0.0663*** (0.0142) |
| Hansen Test (p-value) | 0.225 | 0.221 | 0.195 |
| AR (1) (p-value) | 0.037 | 0.050 | 0.076 |
| AR (2) (p-value) | 0.337 | 0.263 | 0.355 |
| Observations | 450 | 450 | 450 |
| Notes: The dependent variable is capital (ECTA), calculated as the ratio of eligible capital to total assets. Standard errors are in parentheses. ***, **, and * denote the significance level at the corresponding 1%, 5%, and 10% level. The p-value of the Hansen test is referred to as J statistics. Tests for first-order (second-order) correlation using Arellano-Bond order 1 and 2 are asymptotically N (0, 1). | |||
DownLoad:
CSV
| Variable Name | Model Ⅰ | Model Ⅱ | OWNP | OWNI | ||||
| Model Ⅲ | Model Ⅳ | Model Ⅴ | Model Ⅵ | Model Ⅶ | Model Ⅷ | |||
| COFI1 (-1) | 0.6158*** (0.0119) |
0.6308*** (0.0189) |
0.5888*** (0.0119) |
0.6295*** (0.0172) |
0.6192*** (0.0193) |
0.5901*** (0.014) |
0.5916*** (0.0145) |
0.5988*** (0.0157) |
| ECTA | 0.0332*** (0.0013) |
0.0251*** (0.0041) |
0.0356*** (0.0014) |
0.0398*** (0.0013) |
0.0406*** (0.0019) |
0.0289*** (0.0024) |
0.0355*** (0.0019) |
0.0261*** (0.0054) |
| ECTA2 | 0.0318* (0.0175) |
|||||||
| Ownership | 0.0033*** (0.0004) |
0.0053* (0.0031) |
||||||
| Ownership × ECTA | 0.0278*** (0.0038) |
0.0133** (0.0063) |
0.0236*** (0.0029) |
0.0192*** (0.0037) |
||||
| Ownership × ECTA 2 | 0.0853* (0.0473) |
-0.0292* (0.0167) |
||||||
| LLPTL | −0.0156*** (0.0022) |
−0.0191*** (0.0029) |
−0.0053** (0.0021) |
−0.0138*** (0.0021) |
−0.0094** (0.0048) |
−0.0338*** (0.0028) |
−0.0323*** (0.0025) |
−0.0389*** (0.0042) |
| NLTA | 0.0293*** (0.0004) |
0.0281*** (0.0012) |
0.02733*** (0.0005) |
0.0266*** (0.0008) |
0.0278*** (0.0008) |
0.0276*** (0.0005) |
0.0256*** (0.0007) |
0.0251*** (0.0008) |
| Size | −0.0006*** (0.00007) |
−0.0005*** (0.00007) |
−0.0003*** (0.00009) |
−0.0005*** (0.00007) |
−0.0005*** (0.0001) |
−0.0007*** (0.00008) |
−0.0005*** (0.00006) |
−0.0004*** (0.00007) |
| ME | −0.0361*** (0.0029) |
−0.0351*** (0.0031) |
−0.0395*** (0.0023) |
−0.0465*** (0.0041) |
−0.0451*** (0.0039) |
−0.0393*** (0.0034) |
−0.0461*** (0.0041) |
−0.0439*** (0.0042) |
| BSD | 0.00007*** (0.00002) |
0.00005* (0.00003) |
0.00007** (0.00003) |
0.00003 (0.00004) |
0.00002 (0.00003) |
0.00007** (0.00002) |
0.00004 (0.00003) |
0.00004 (0.00003) |
| GDP | 0.0019*** (0.00005) |
0.0019*** (0.00006) |
0.0021*** (0.00006) |
0.0019*** (0.00006) |
0.0019*** (0.00008) |
0.0019*** (0.00008) |
0.0019*** (0.00009) |
0.0019*** (0.00009) |
| Inflation | 0.00013** (0.00005) |
0.0001*** (0.00005) |
0.0002*** (0.00005) |
0.00008 (0.00008) |
0.00007 (0.00008) |
0.00003 (0.00007) |
0.00001 (0.00008) |
0.00001 (0.00008) |
| Constant | 0.0094** (0.0039) |
0.0093** (0.0042) |
0.0104*** (0.0039) |
0.0218*** (0.0066) |
0.0207*** (0.0062) |
0.0173*** (0.0046) |
0.0234 *** (0.0058) |
0.0216*** (0.0056) |
| Hansen Test (p-value) | 0.211 | 0.205 | 0.229 | 0.331 | 0.252 | 0.163 | 0.205 | 0.216 |
| AR (1) (p-value) |
0.000 | 0.000 | 0.000 | 0.000 | 0.000 | 0.000 | 0.000 | 0.000 |
| AR (2) (p-value) |
0.432 | 0.417 | 0.492 | 0.453 | 0.461 | 0.459 | 0.420 | 0.412 |
| Observations | 450 | 450 | 450 | 450 | 450 | 450 | 450 | 450 |
| Notes: The dependent variable is CoFI1, which is calculated as the ratio of net interest income to total assets. Standard errors are in parentheses. ***, **, and * denote the significance level at the corresponding 1%, 5%, and 10% level. The p-value of the Hansen test is referred to as J statistics. Tests for first-order (second-order) correlation using Arellano-Bond order 1 and 2 are asymptotically N (0, 1). | ||||||||
DownLoad:
CSV
| Variable Name | C Ⅰ | C Ⅱ | C Ⅲ |
| COFI (-1) | 0.5936*** (0.0361) |
0.6047*** (0.0401) |
0.6101*** (0.0404) |
| High ECTA | 0.0041** (0.0016) |
||
| Avg ECTA | 0.0019* (0.0011) |
||
| Low ECTA | -0.0025*** (0.0007) |
||
| All Control Variables | Yes | Yes | Yes |
| Constant | 0.0339*** (0.0074) |
0.0309*** (0.0076) |
0.0321*** (0.0074) |
| Hansen Test (p-value) | 0.267 | 0.277 | 0.272 |
| AR (1) (p-value) | 0.000 | 0.000 | 0.000 |
| AR (2) (p-value) | 0.410 | 0.431 | 0.445 |
| Observations | 450 | 450 | 450 |
| Notes: The dependent variable is CoFI1, which is calculated as the ratio of net interest income to total assets. Standard errors are in parentheses. ***, **, and * denote the significance level at the corresponding 1%, 5%, and 10% level. The p-value of the Hansen test is referred to as J statistics. Tests for first-order (second-order) correlation using Arellano-Bond order 1 and 2 are asymptotically N (0, 1). | |||
DownLoad:
CSV
| Variable Name | Model Ⅰ | Model Ⅱ | OWNP | OWNI | ||||
| Model Ⅲ | Model Ⅳ | Model Ⅴ | Model Ⅵ | Model Ⅶ | Model Ⅷ | |||
| CAR (-1) | 0.4967*** (0.0011) |
0.4799*** (0.0011) |
0.4621*** (0.0015) |
0.4953*** (0.0007) |
0.4489*** (0.0011) |
0.4451*** (0.0013) |
0.4967*** (0.0011) |
0.4979*** (0.0014) |
| COFI1 | 0.2424*** (0.0327) |
0.3148*** (0.0315) |
0.8282*** (0.0447) |
0.1031** (0.0511) |
0.1101* (0.0583) |
0.3838*** (0.0419) |
0.1374* (0.0775) |
0.2569** (0.0995) |
| COFI12 | −1.9824* (1.0588) |
|||||||
| Inflection Point | 0.0315 | |||||||
| Ownership | −0.0696*** (0.0025) |
−0.0491*** (0.0055) |
||||||
| Ownership ×COFI1 | −0.6271*** (0.0387) |
−0.7538*** (0.1033) |
0.0938* (0.0537) |
0.1646* (0.0984) |
||||
| Ownership × COFI12 | 14.8636*** (3.1899) |
−2.7988*** (1.0714) |
||||||
| LLPTL | −0.0541*** (0.0123) |
−0.0505*** (0.0123) |
−0.4697*** (0.0141) |
−0.068*** (0.0119) |
−0.1616*** (0.0089) |
−0.1848*** (0.0117) |
−0.0363*** (0.0124) |
0.0095 (0.0169) |
| ID | 0.1724*** (0.0474) |
0.1303** (0.0513) |
0.2161*** (0.0578) |
0.1498*** (0.0469) |
0.10−65* (0.0571) |
−0.8389*** (0.0819) |
0.0498 (0.0516) |
0.0618 (0.0587) |
| Size | −0.0005* (0.0003) |
−0.0004 (0.0003) |
−0.0064*** (0.0005) |
0.0003 (0.0003) |
−0.0028*** (0.0004) |
−0.0016*** (0.0003) |
−0.0007** (0.0003) |
−0.0008*** (0.0003) |
| ROA | 0.0195*** (0.0005) |
0.0199*** (0.0005) |
0.0139*** (0.0005) |
0.0197*** (0.0005) |
0.0174*** (0.0005) |
0.0179*** (0.0005) |
0.0201*** (0.0005) |
0.0211*** (0.0006) |
| BSD | −0.0021*** (0.00008) |
−0.0022*** (0.00007) |
−0.0025*** (0.0001) |
−0.0021** (0.00007) |
−0.0021*** (0.00009) |
−0.0015*** (0.0001) |
−0.0021*** (0.00008) |
−0.0021*** (0.00009) |
| GDP | −0.0025*** (0.0001) |
−0.0027*** (0.0001) |
−0.0039*** (0.0002) |
−0.0023*** (0.0001) |
−0.0025*** (0.0001) |
−0.0029*** (0.0002) |
−0.0025*** (0.0001) |
−0.0027*** (0.0001) |
| Inflation | −0.0044*** (0.0002) |
−0.0046** (0.0002) |
−0.0064*** (0.0002) |
−0.0046*** (0.0001) |
−0.0053*** (0.0002) |
−0.0024*** (0.0001) |
−0.0043*** (0.0002) |
−0.0044** (0.0002) |
| Constant | 0.1767*** (0.0051) |
0.1983*** (0.0053) |
0.3048*** (0.0141) |
0.1806*** (0.0045) |
0.2375*** (0.0078) |
0.1183*** (0.0079) |
0.1724*** (0.0061) |
0.1691*** (0.0059) |
| Hansen Test (p-value) | 0.234 | 0.221 | 0.236 | 0.225 | 0.219 | 0.386 | 0.250 | 0.169 |
| AR (1) (p-value) |
0.049 | 0.032 | 0.061 | 0.058 | 0.035 | 0.012 | 0.053 | 0.052 |
| AR (2) (p-value) |
0.349 | 0.364 | 0.489 | 0.383 | 0.333 | 0.293 | 0.384 | 0.373 |
| Observations | 450 | 450 | 450 | 450 | 450 | 450 | 450 | 450 |
| Notes: The dependent variable is capital (CAR), calculated as the ratio of tier Ⅰ plus tier Ⅱ capital to risk-weighted assets. Standard errors are in parentheses. ***, **, and * denote the significance level at the corresponding 1%, 5%, and 10% level. The p-value of the Hansen test is referred to as J statistics. Tests for first-order (second-order) correlation using Arellano-Bond order 1 and 2 are asymptotically N (0, 1). | ||||||||
DownLoad:
CSV
| Variable Name | C Ⅰ | C Ⅱ | C Ⅲ |
| CAR (-1) | 0.5004*** (0.0019) |
0.4735*** (0.0023) |
0.4592*** (0.0027) |
| High COFI1 | −0.0088*** (0.0025) |
||
| Avg COFI1 | 0.0091*** (0.0019) |
||
| Low COFI1 | 0.0503*** (0.0046) |
||
| All Control Variables | Yes | Yes | Yes |
| Constant | 0.1787*** (0.0066) |
0.1973*** (0.0085) |
0.1551*** (0.0158) |
| Hansen Test (p-value) | 0.166 | 0.327 | 0.295 |
| AR (1) (p-value) | 0.056 | 0.017 | 0.051 |
| AR (2) (p-value) | 0.383 | 0.196 | 0.327 |
| Observations | 450 | 450 | 450 |
| Notes: The dependent variable is capital (CAR), calculated as the ratio of tier Ⅰ plus tier Ⅱ capital to risk-weighted assets. Standard errors are in parentheses. ***, **, and * denote the significance level at the corresponding 1%, 5%, and 10% level. The p-value of the Hansen test is referred to as J statistics. Tests for first-order (second-order) correlation using Arellano-Bond order 1 and 2 are asymptotically N (0, 1). | |||
DownLoad:
CSV
| Variable Name | Model Ⅰ | Model Ⅱ | OWNP | OWNI | ||||
| Model Ⅲ | Model Ⅳ | Model Ⅴ | Model Ⅵ | Model Ⅶ | Model Ⅷ | |||
| COFI2 (-1) | 0.5701*** (0.0086) |
0.5832*** (0.0141) |
0.5245*** (0.0111) |
0.5516*** (0.0348) |
0.5891*** (0.0171) |
0.5879*** (0.0111) |
0.5753*** (0.0159) |
0.5579*** (0.0136) |
| ECTA | 0.0426*** (0.0014) |
0.0303*** (0.0044) |
0.0481*** (0.0014) |
0.0466*** (0.0065) |
0.0533*** (0.0028) |
0.0381*** (0.0023) |
0.0519*** (0.0019) |
0.0301*** (0.0054) |
| ECTA2 | 0.0432** (0.0181) |
|||||||
| Ownership | 0.0081*** (0.0008) |
0.0025*** (0.0006) |
||||||
| Ownership × ECTA | 0.0332** (0.0132) |
0.0144* (0.0083) |
0.0359*** (0.0062) |
0.0241*** (0.0041) |
||||
| Ownership × ECTA 2 | 0.1665*** (0.0543) |
-0.0447*** (0.0171) |
||||||
| LLPTL | −0.0144*** (0.0015) |
−0.0224*** (0.0041) |
0.0082** (0.0034) |
−0.0225*** (0.0057) |
−0.0042 (0.0061) |
−0.0165*** (0.002)6 |
−0.0123*** (0.0023) |
−0.0453*** (0.0054) |
| NLTA | 0.0401*** (0.0005) |
0.0386*** (0.0013) |
0.0349*** (0.0008) |
0.0377*** (0.0023) |
0.0368*** (0.0012) |
0.0424*** (0.0006) |
0.0369*** (0.0013) |
0.0348*** (0.0011) |
| Size | −0.0008*** (0.00008) |
−0.0007*** (0.00009) |
−0.0001 (0.0001) |
−0.0014*** (0.0002) |
−0.0009*** (0.0001) |
−0.0008*** (0.0001) |
−0.0007*** (0.0001) |
−0.0006*** (0.00007) |
| ME | −0.0552*** (0.0026) |
−0.0561*** (0.0031) |
−0.0666*** (0.0033) |
−0.0771*** (0.0068) |
−0.0713*** (0.0051) |
−0.0603*** (0.0031) |
−0.0681*** (0.0051) |
−0.0659*** (0.0048 |
| BSD | 0.0001*** (0.00003) |
0.00008* (0.00004) |
0.0001*** (0.00002) |
−0.00002 (0.00006) |
−0.000002 (0.00004) |
0.00009*** (0.00003) |
0.00002 (0.00005) |
0.00006 (0.00004) |
| GDP | 0.0022*** (0.00007) |
0.0022*** (0.00007) |
0.0023*** (0.00007) |
0.0021*** (0.0001) |
0.0021*** (0.00009) |
0.0022*** (0.00006) |
0.0021*** (0.00007) |
0.0022*** (0.00008) |
| Inflation | 0.0002*** (0.00003) |
0.0001** (0.00007) |
0.0003*** (0.00008) |
0.00006 (0.0001) |
0.0001 (0.00009) |
0.0002** (0.00007) |
0.0001* (0.00009) |
0.0001 (0.00009) |
| Constant | 0.0203*** (0.0041) |
0.0229*** (0.0058) |
0.0253*** (0.0051) |
0.0558*** (0.0111) |
0.0425*** (0.0088) |
0.0217*** (0.0049) |
0.0356*** (0.0091) |
0.0353*** (0.0072) |
| Hansen Test (p-value) | 0.222 | 0.211 | 0.214 | 0.133 | 0.279 | 0.258 | 0.246 | 0.201 |
| AR (1) (p-value) |
0.001 | 0.000 | 0.001 | 0.000 | 0.001 | 0.000 | 0.001 | 0.001 |
| AR (2) (p-value) |
0.437 | 0.478 | 0.446 | 0.379 | 0.431 | 0.467 | 0.465 | 0.401 |
| Observations | 450 | 450 | 450 | 450 | 450 | 450 | 450 | 450 |
| Notes: The dependent variable is CoFI2, calculated as the ratio of net interest income to total interest-earning assets. Standard errors are in parentheses. ***, **, and * denote the significance level at the corresponding 1%, 5%, and 10% level. The p-value of the Hansen test is referred to as J statistics. Tests for first-order (second-order) correlation using Arellano-Bond order 1 and 2 are asymptotically N (0, 1). | ||||||||
DownLoad:
CSV
| Variable Name | C1 | C2 | C3 |
| COFI (-1) | 0.5629*** (0.0373) |
0.5938*** (0.0408) |
0.5958*** (0.0398) |
| High ECTA | 0.0042** (0.0021) |
||
| Avg ECTA | 0.0022** (0.0009) |
||
| Low ECTA | −0.0024*** (0.0009) |
||
| All Control Variables | Yes | Yes | Yes |
| Constant | 0.0528*** (0.0091) |
0.0452*** (0.0093) |
0.0451*** (0.0082) |
| Hansen Test (p-value) | 0.226 | 0.144 | 0.206 |
| AR (1) (p-value) | 0.001 | 0.001 | 0.002 |
| AR (2) (p-value) | 0.407 | 0.448 | 0.480 |
| Observations | 450 | 450 | 450 |
| Notes: The dependent variable is CoFI2, which is calculated as the ratio of net interest income to average earning assets. Standard errors are in parentheses. ***, **, and * denote the significance level at the corresponding 1%, 5%, and 10% level. The p-value of the Hansen test is referred to as J statistics. Tests for first-order (second-order) correlation using Arellano-Bond order 1 and 2 are asymptotically N (0, 1). | |||
DownLoad:
CSV
| Null Hypothesis | Two Lags | Three Lags | Four Lags | |||
| F-statistics | Probability | F-statistics | Probability | F- Statistics | Probability | |
| ECTA does not Granger Cause COFI | 0.6158 | 0.5406 | 2.0969 | 0.0198** | 2.6034 | 0.000*** |
| COFI does not Granger Cause ECTA | 1.2413 | 0.2899 | 5.1543 | 0.0016*** | 6.7039 | 0.0000*** |
| Note: The asterisks represent different significance levels, where *** indicates 1% and ** indicates 5%. | ||||||
DownLoad:
CSV
| Classification | Variable | Description | Literature References/Sources |
| Capital | ECTA | Eligible capital to total assets | Mateev et al. (2021) |
| CAR | Capital Adequacy Ratio | Mehrotra et al. (2023) | |
| Cost of Financial Intermediation | COFI1 | Interestincome−interestexpensesTotalassets | Rahman et al. (2018) |
| COFI2 | Interestincome−interestexpensesTotalearningassets | Rahman et al. (2023) | |
| Ownership: Dummy Variables | OWNp | Takes a value of one (1) for privately owned commercial banks and zero (0) for state-owned commercial banks. | Alqahtani et al. (2016). Authors Calculation |
| OWNI | Takes a value of one (1) for Islamic commercial banks and zero (0) for conventional commercial banks. | Alqahtani et al. (2016). Authors Calculation |
|
| Banking Sector Development | BSD | Banking industry asset to gross domestic product | Gupta et al. (2021). Source: World Bank data |
| Gross Domestic Product | GDP | Growth of gross domestic product (per capita growth) | Shabir et al. (2023). Source: World Bank data |
| Inflation | Inflation | Annual rate of inflation - Consumer Prices (%) | Entrop et al. (2015) Source: World Bank data |
| Risk | LLPTL | Loan loss provision to total loan | Garel et al. (2022) |
| Income Diversification | ID | Non-interest income to total assets | Sensarma and Ghosh (2004) |
| Bank Size | Size | The logarithm of total assets | Shabir et al. (2023) |
| Profitability | ROA | The ratio of net income to total assets | Carsamer et al. (2022) |
| Liquidity | NLTA | Net loan to total assets | Saeed et al. (2020) |
| Management Efficiency | ME | The ratio of earning assets to total assets | Rahman et al. (2017) |
| High COFI | Dummy Variable | Equal to 1, if COFI≥¯COFI+0.5σCOFI, otherwise 0 | Source: The Authors |
| Low COFI | Dummy Variable | Equal to 1, if COFI≤¯COFI−0.5σCOFI, otherwise 0 | Source: The Authors |
| Avg COFI | Dummy Variable | Equal to 1, if ¯COFI−0.5σCOFI<CoFI<¯COFI+0.5σCOFI, otherwise 0 | Source: The Authors |
| High Capital | Dummy Variable | Equal to 1, if Capital ≥¯RNPL+0.5σRNPL, otherwise 0 | Source: The Authors |
| Low Capital | Dummy Variable | Equal to 1, if Capital ≤¯RNPL−0.5σRNPL, otherwise 0 | Source: The Authors |
| Avg Capital | Dummy Variable | Equal to 1, if ¯RNPL−0.5σRNPL<Capital<¯RNPL+0.5σRNPL, otherwise 0 | Source: The Authors |
| Source: Author's compilation using the mentioned sources/references. | |||
| Variable | Obs | Mean | Std. Dev. | Min | Max |
| ECTA | 494 | 0.106 | 0.086 | −0.153 | 0.809 |
| CAR | 494 | 0.149 | 0.175 | −0.284 | 2.207 |
| COFIT1 | 494 | 0.020 | 0.012 | −0.023 | 0.077 |
| COFIT2 | 494 | 0.023 | 0.014 | −0.024 | 0.104 |
| LLPTL | 494 | 0.031 | 0.043 | 0.000 | 0.351 |
| ID | 494 | 0.025 | 0.012 | 0.000 | 0.101 |
| NLTA | 494 | 0.634 | 0.140 | 0.004 | 1.963 |
| SIZE | 494 | 12.036 | 1.017 | 8.508 | 14.355 |
| ME | 494 | 0.873 | 0.048 | 0.577 | 1.000 |
| ROA | 494 | 0.899 | 1.103 | −7.490 | 6.050 |
| BSD | 494 | 48.044 | 2.856 | 41.054 | 51.110 |
| GDP | 494 | 5.122 | 1.082 | 2.271 | 6.688 |
| Inflation | 494 | 6.539 | 1.532 | 5.514 | 11.395 |
| Variable | ⅥF (Capital Equation) | ⅥF (COFI Equation) |
| ECTA | 2.016 | |
| COFI1 | 1.791 | |
| LLPTL | 1.875 | 1.873 |
| ID | 1.471 | |
| Size | 1.173 | 1.728 |
| ROA | 2.144 | |
| NLTA | 1.719 | |
| ME | 1.305 | |
| BSD | 1.097 | 1.145 |
| GDP | 1.132 | 1.084 |
| Inflation | 1.246 | 1.150 |
| Variables | (1) | (2) | (3) | (4) | (5) | (6) | (7) | (8) | (9) | (10) | (11) | (12) | (13) |
| (1) ECTA | 1.000 | ||||||||||||
| (2) CAR | 0.898*** | 1.000 | |||||||||||
| (0.000) | |||||||||||||
| (3) COFIT2 | 0.316*** | 0.181*** | 1.000 | ||||||||||
| (0.000) | (0.000) | ||||||||||||
| (4) COFI1 | 0.312* | 0.166*** | 0.994*** | 1.000 | |||||||||
| (0.000) | (0.000) | (0.000) | |||||||||||
| (5) LLPTL | −0.314*** | −0.230* | −0.554*** | −0.522*** | 1.000 | ||||||||
| (0.000) | (0.000) | (0.000) | (0.000) | ||||||||||
| (6) ID | −0.097** | −0.216*** | −0.132*** | −0.117*** | 0.048 | 1.000 | |||||||
| (0.032) | (0.000) | (0.003) | (0.009) | (0.285) | |||||||||
| (7) NLTA | −0.257*** | −0.396*** | 0.439*** | 0.435*** | −0.460*** | −0.051 | 1.000 | ||||||
| (0.000) | (0.000) | (0.000) | (0.000) | (0.000) | (0.255) | ||||||||
| (8) SIZE | −0.603*** | −0.492*** | −0.299*** | −0.291*** | 0.207*** | −0.006 | 0.169*** | 1.000 | |||||
| (0.000) | (0.000) | (0.000) | (0.000) | (0.000) | (0.894) | (0.000) | |||||||
| (9) ME | 0.030 | 0.095** | 0.044 | −0.034 | −0.372*** | −0.106** | 0.319*** | −0.080* | 1.000 | ||||
| (0.504) | (0.035) | (0.330) | (0.456) | (0.000) | (0.019) | (0.000) | (0.074) | ||||||
| (10) ROA | 0.258*** | 0.098** | 0.453*** | 0.443*** | −0.566*** | 0.364*** | 0.236*** | −0.159*** | 0.024 | 1.000 | |||
| (0.000) | (0.029) | (0.000) | (0.000) | (0.000) | (0.000) | (0.000) | (0.000) | (0.591) | |||||
| (11) BSD | 0.112** | 0.089** | 0.010 | 0.020 | 0.011 | 0.025 | −0.176*** | −0.177*** | −0.170*** | −0.028 | 1.000 | ||
| (0.013) | (0.049) | (0.822) | (0.660) | (0.801) | (0.579) | (0.000) | (0.000) | (0.000) | (0.529) | ||||
| (12) GDP | −0.014 | −0.013 | 0.136*** | 0.130*** | 0.020 | −0.114** | 0.071 | 0.028 | 0.055 | −0.059 | −0.225*** | 1.000 | |
| (0.754) | (0.778) | (0.002) | (0.004) | (0.659) | (0.011) | (0.113) | (0.532) | (0.218) | (0.188) | (0.000) | |||
| (13) Inflation | 0.053 | −0.007 | 0.173*** | 0.182*** | −0.108** | 0.307*** | −0.014 | −0.208*** | −0.147*** | 0.310*** | 0.023 | −0.151*** | 1.000 |
| (0.241) | (0.874) | (0.000) | (0.000) | (0.016) | (0.000) | (0.751) | (0.000) | (0.001) | (0.000) | (0.605) | (0.001) | ||
| Note: Pearson's correlation coefficients. *** p<0.01, ** p<0.05, * p<0.1. | |||||||||||||
| Variable Name |
Model Ⅰ | Model Ⅱ | OWNp | OWNI | |||||
| Model Ⅲ | Model Ⅳ | Model Ⅴ | Model Ⅵ | Model Ⅶ | Model Ⅷ | ||||
| ECTA (-1) | 0.5482*** (0.0029) |
0.6216*** (0.0027) |
0.5271*** (0.0031) |
0.6189*** (0.0028) |
0.6192*** (0.0031) |
0.6167*** (0.0031) |
0.5483*** (0.0031) |
0.5451*** (0.0034) |
|
| COFI1 | 0.2767*** (0.0361) |
0.6551*** (0.0281) |
0.4797*** (0.0403) |
0.1453*** (0.0471) |
0.1183** (0.0461) |
0.2621*** (0.0221) |
0.1606** (0.0634) |
0.2388*** (0.0598) |
|
| COFI12 | −11.7778*** (0.4671) |
||||||||
| Inflection Point | 0.0278 | ||||||||
| Ownership | −0.0234*** (0.0021) |
−0.0274*** (0.0027) |
|||||||
| Ownership ×COFI1 | −0.4889*** (0.0351) |
−0.7092*** (0.0357) |
0.1239** (0.0614) |
0.4914*** (0.0633) |
|||||
| Ownership × COFI12 | 19.8455*** (1.2798) |
−13.4958*** (2.2068) |
|||||||
| LLPTL | −0.0136** (0.0061) |
−0.0292*** (0.0053) |
−0.1518*** (0.0087) |
−0.0294*** (0.0064) |
−0.0129** (0.0055) |
−0.0448*** (0.0097) |
−0.0125** (0.0061) |
−0.0251* (0.0088) |
|
| ID | 0.2588*** (0.0351) |
0.2829*** (0.0323) |
0.2692*** (0.0392) |
0.2845*** (0.0246) |
0.2737*** (0.0284) |
−0.2366*** (0.0341) |
0.1617*** (0.0419) |
0.1267*** (0.0452) |
|
| Size | −0.0013*** (0.0002) |
−0.0014*** (0.0003) |
−0.0035*** (0.0004) |
−0.0013*** (0.0003) |
−0.0014*** (0.0003) |
−0.0035* (0.0004) |
−0.0009*** (0.0003) |
−0.0009** (0.0004) |
|
| ROA | 0.0133*** (0.0003) |
0.0128*** (0.0002) |
0.0117** (0.0002) |
0.0124*** (0.0002) |
0.0126*** (0.0002) |
0.0126*** (0.0003) |
0.0135*** (0.0003) |
0.0141*** (0.0004) |
|
| BSD | −0.0008*** (0.00006) |
−0.0007*** (0.00005) |
−0.0011*** (0.0001) |
−0.0007*** (0.00005) |
−0.0007*** (0.00004) |
−0.0004*** (0.00009) |
−0.0008*** (0.00007) |
−0.0009*** (0.00007) |
|
| GDP | −0.0012*** (0.0001) |
−0.0009*** (0.0001) |
−0.0016*** (0.0001) |
−0.0008*** (0.0001) |
−0.0008*** (0.0001) |
−0.0009*** (0.0001) |
−0.0012*** (0.0001) |
−0.0013*** (0.0001) |
|
| Inflation | −0.0031*** (0.0002) |
−0.0026*** (0.0002) |
−0.0037*** (0.0002) |
−0.0029*** (0.0001) |
−0.0027*** (0.0002) |
−0.0015*** (0.0001) |
−0.0028*** (0.0002) |
−0.0028*** (0.0002) |
|
| Constant | 0.1008*** (0.0061) |
0.0499*** (0.0061) |
0.1446*** (0.0097) |
0.0545*** (0.0054) |
0.0535*** (0.0054) |
−0.0053 (0.0091) |
0.0953*** (0.0071) |
0.0977*** (0.0073) |
|
| Hansen Test (p-value) | 0.225 | 0.216 | 0.184 | 0.233 | 0.188 | 0.278 | 0.213 | 0.270 | |
| AR (1) (p-value) |
0.042 | 0.063 | 0.037 | 0.050 | 0.048 | 0.060 | 0.044 | 0.063 | |
| AR (2) (p-value) |
0.304 | 0.305 | 0.283 | 0.276 | 0.297 | 0.313 | 0.313 | 0.337 | |
| Observations | 450 | 450 | 450 | 450 | 450 | 450 | 450 | 450 | |
| Notes: The dependent variable is capital (ECTA), calculated as the ratio of eligible capital to total assets. Standard errors are in parentheses. ***, **, and * denote the significance level at the corresponding 1%, 5%, and 10% level. The p-value of the Hansen test is referred to as J statistics. Tests for first-order (second-order) correlation using Arellano-Bond order 1 and 2 are asymptotically N (0, 1). | |||||||||
| Variable Name | C Ⅰ | C Ⅱ | C Ⅲ |
| ECTA (-1) | 0.5478*** (0.0041) |
0.6237*** (0.0043) |
0.5196*** (0.0055) |
| High COFI1 | −0.0144*** (0.0029) |
||
| Avg COFI1 | 0.0031*** (0.0011) |
||
| Low COFI1 | 0.0327*** (0.0027) |
||
| All Control Variables | Yes | Yes | Yes |
| Constant | 0.1046*** (0.0079) |
0.0507*** (0.0061) |
0.0663*** (0.0142) |
| Hansen Test (p-value) | 0.225 | 0.221 | 0.195 |
| AR (1) (p-value) | 0.037 | 0.050 | 0.076 |
| AR (2) (p-value) | 0.337 | 0.263 | 0.355 |
| Observations | 450 | 450 | 450 |
| Notes: The dependent variable is capital (ECTA), calculated as the ratio of eligible capital to total assets. Standard errors are in parentheses. ***, **, and * denote the significance level at the corresponding 1%, 5%, and 10% level. The p-value of the Hansen test is referred to as J statistics. Tests for first-order (second-order) correlation using Arellano-Bond order 1 and 2 are asymptotically N (0, 1). | |||
| Variable Name | Model Ⅰ | Model Ⅱ | OWNP | OWNI | ||||
| Model Ⅲ | Model Ⅳ | Model Ⅴ | Model Ⅵ | Model Ⅶ | Model Ⅷ | |||
| COFI1 (-1) | 0.6158*** (0.0119) |
0.6308*** (0.0189) |
0.5888*** (0.0119) |
0.6295*** (0.0172) |
0.6192*** (0.0193) |
0.5901*** (0.014) |
0.5916*** (0.0145) |
0.5988*** (0.0157) |
| ECTA | 0.0332*** (0.0013) |
0.0251*** (0.0041) |
0.0356*** (0.0014) |
0.0398*** (0.0013) |
0.0406*** (0.0019) |
0.0289*** (0.0024) |
0.0355*** (0.0019) |
0.0261*** (0.0054) |
| ECTA2 | 0.0318* (0.0175) |
|||||||
| Ownership | 0.0033*** (0.0004) |
0.0053* (0.0031) |
||||||
| Ownership × ECTA | 0.0278*** (0.0038) |
0.0133** (0.0063) |
0.0236*** (0.0029) |
0.0192*** (0.0037) |
||||
| Ownership × ECTA 2 | 0.0853* (0.0473) |
-0.0292* (0.0167) |
||||||
| LLPTL | −0.0156*** (0.0022) |
−0.0191*** (0.0029) |
−0.0053** (0.0021) |
−0.0138*** (0.0021) |
−0.0094** (0.0048) |
−0.0338*** (0.0028) |
−0.0323*** (0.0025) |
−0.0389*** (0.0042) |
| NLTA | 0.0293*** (0.0004) |
0.0281*** (0.0012) |
0.02733*** (0.0005) |
0.0266*** (0.0008) |
0.0278*** (0.0008) |
0.0276*** (0.0005) |
0.0256*** (0.0007) |
0.0251*** (0.0008) |
| Size | −0.0006*** (0.00007) |
−0.0005*** (0.00007) |
−0.0003*** (0.00009) |
−0.0005*** (0.00007) |
−0.0005*** (0.0001) |
−0.0007*** (0.00008) |
−0.0005*** (0.00006) |
−0.0004*** (0.00007) |
| ME | −0.0361*** (0.0029) |
−0.0351*** (0.0031) |
−0.0395*** (0.0023) |
−0.0465*** (0.0041) |
−0.0451*** (0.0039) |
−0.0393*** (0.0034) |
−0.0461*** (0.0041) |
−0.0439*** (0.0042) |
| BSD | 0.00007*** (0.00002) |
0.00005* (0.00003) |
0.00007** (0.00003) |
0.00003 (0.00004) |
0.00002 (0.00003) |
0.00007** (0.00002) |
0.00004 (0.00003) |
0.00004 (0.00003) |
| GDP | 0.0019*** (0.00005) |
0.0019*** (0.00006) |
0.0021*** (0.00006) |
0.0019*** (0.00006) |
0.0019*** (0.00008) |
0.0019*** (0.00008) |
0.0019*** (0.00009) |
0.0019*** (0.00009) |
| Inflation | 0.00013** (0.00005) |
0.0001*** (0.00005) |
0.0002*** (0.00005) |
0.00008 (0.00008) |
0.00007 (0.00008) |
0.00003 (0.00007) |
0.00001 (0.00008) |
0.00001 (0.00008) |
| Constant | 0.0094** (0.0039) |
0.0093** (0.0042) |
0.0104*** (0.0039) |
0.0218*** (0.0066) |
0.0207*** (0.0062) |
0.0173*** (0.0046) |
0.0234 *** (0.0058) |
0.0216*** (0.0056) |
| Hansen Test (p-value) | 0.211 | 0.205 | 0.229 | 0.331 | 0.252 | 0.163 | 0.205 | 0.216 |
| AR (1) (p-value) |
0.000 | 0.000 | 0.000 | 0.000 | 0.000 | 0.000 | 0.000 | 0.000 |
| AR (2) (p-value) |
0.432 | 0.417 | 0.492 | 0.453 | 0.461 | 0.459 | 0.420 | 0.412 |
| Observations | 450 | 450 | 450 | 450 | 450 | 450 | 450 | 450 |
| Notes: The dependent variable is CoFI1, which is calculated as the ratio of net interest income to total assets. Standard errors are in parentheses. ***, **, and * denote the significance level at the corresponding 1%, 5%, and 10% level. The p-value of the Hansen test is referred to as J statistics. Tests for first-order (second-order) correlation using Arellano-Bond order 1 and 2 are asymptotically N (0, 1). | ||||||||
| Variable Name | C Ⅰ | C Ⅱ | C Ⅲ |
| COFI (-1) | 0.5936*** (0.0361) |
0.6047*** (0.0401) |
0.6101*** (0.0404) |
| High ECTA | 0.0041** (0.0016) |
||
| Avg ECTA | 0.0019* (0.0011) |
||
| Low ECTA | -0.0025*** (0.0007) |
||
| All Control Variables | Yes | Yes | Yes |
| Constant | 0.0339*** (0.0074) |
0.0309*** (0.0076) |
0.0321*** (0.0074) |
| Hansen Test (p-value) | 0.267 | 0.277 | 0.272 |
| AR (1) (p-value) | 0.000 | 0.000 | 0.000 |
| AR (2) (p-value) | 0.410 | 0.431 | 0.445 |
| Observations | 450 | 450 | 450 |
| Notes: The dependent variable is CoFI1, which is calculated as the ratio of net interest income to total assets. Standard errors are in parentheses. ***, **, and * denote the significance level at the corresponding 1%, 5%, and 10% level. The p-value of the Hansen test is referred to as J statistics. Tests for first-order (second-order) correlation using Arellano-Bond order 1 and 2 are asymptotically N (0, 1). | |||
| Variable Name | Model Ⅰ | Model Ⅱ | OWNP | OWNI | ||||
| Model Ⅲ | Model Ⅳ | Model Ⅴ | Model Ⅵ | Model Ⅶ | Model Ⅷ | |||
| CAR (-1) | 0.4967*** (0.0011) |
0.4799*** (0.0011) |
0.4621*** (0.0015) |
0.4953*** (0.0007) |
0.4489*** (0.0011) |
0.4451*** (0.0013) |
0.4967*** (0.0011) |
0.4979*** (0.0014) |
| COFI1 | 0.2424*** (0.0327) |
0.3148*** (0.0315) |
0.8282*** (0.0447) |
0.1031** (0.0511) |
0.1101* (0.0583) |
0.3838*** (0.0419) |
0.1374* (0.0775) |
0.2569** (0.0995) |
| COFI12 | −1.9824* (1.0588) |
|||||||
| Inflection Point | 0.0315 | |||||||
| Ownership | −0.0696*** (0.0025) |
−0.0491*** (0.0055) |
||||||
| Ownership ×COFI1 | −0.6271*** (0.0387) |
−0.7538*** (0.1033) |
0.0938* (0.0537) |
0.1646* (0.0984) |
||||
| Ownership × COFI12 | 14.8636*** (3.1899) |
−2.7988*** (1.0714) |
||||||
| LLPTL | −0.0541*** (0.0123) |
−0.0505*** (0.0123) |
−0.4697*** (0.0141) |
−0.068*** (0.0119) |
−0.1616*** (0.0089) |
−0.1848*** (0.0117) |
−0.0363*** (0.0124) |
0.0095 (0.0169) |
| ID | 0.1724*** (0.0474) |
0.1303** (0.0513) |
0.2161*** (0.0578) |
0.1498*** (0.0469) |
0.10−65* (0.0571) |
−0.8389*** (0.0819) |
0.0498 (0.0516) |
0.0618 (0.0587) |
| Size | −0.0005* (0.0003) |
−0.0004 (0.0003) |
−0.0064*** (0.0005) |
0.0003 (0.0003) |
−0.0028*** (0.0004) |
−0.0016*** (0.0003) |
−0.0007** (0.0003) |
−0.0008*** (0.0003) |
| ROA | 0.0195*** (0.0005) |
0.0199*** (0.0005) |
0.0139*** (0.0005) |
0.0197*** (0.0005) |
0.0174*** (0.0005) |
0.0179*** (0.0005) |
0.0201*** (0.0005) |
0.0211*** (0.0006) |
| BSD | −0.0021*** (0.00008) |
−0.0022*** (0.00007) |
−0.0025*** (0.0001) |
−0.0021** (0.00007) |
−0.0021*** (0.00009) |
−0.0015*** (0.0001) |
−0.0021*** (0.00008) |
−0.0021*** (0.00009) |
| GDP | −0.0025*** (0.0001) |
−0.0027*** (0.0001) |
−0.0039*** (0.0002) |
−0.0023*** (0.0001) |
−0.0025*** (0.0001) |
−0.0029*** (0.0002) |
−0.0025*** (0.0001) |
−0.0027*** (0.0001) |
| Inflation | −0.0044*** (0.0002) |
−0.0046** (0.0002) |
−0.0064*** (0.0002) |
−0.0046*** (0.0001) |
−0.0053*** (0.0002) |
−0.0024*** (0.0001) |
−0.0043*** (0.0002) |
−0.0044** (0.0002) |
| Constant | 0.1767*** (0.0051) |
0.1983*** (0.0053) |
0.3048*** (0.0141) |
0.1806*** (0.0045) |
0.2375*** (0.0078) |
0.1183*** (0.0079) |
0.1724*** (0.0061) |
0.1691*** (0.0059) |
| Hansen Test (p-value) | 0.234 | 0.221 | 0.236 | 0.225 | 0.219 | 0.386 | 0.250 | 0.169 |
| AR (1) (p-value) |
0.049 | 0.032 | 0.061 | 0.058 | 0.035 | 0.012 | 0.053 | 0.052 |
| AR (2) (p-value) |
0.349 | 0.364 | 0.489 | 0.383 | 0.333 | 0.293 | 0.384 | 0.373 |
| Observations | 450 | 450 | 450 | 450 | 450 | 450 | 450 | 450 |
| Notes: The dependent variable is capital (CAR), calculated as the ratio of tier Ⅰ plus tier Ⅱ capital to risk-weighted assets. Standard errors are in parentheses. ***, **, and * denote the significance level at the corresponding 1%, 5%, and 10% level. The p-value of the Hansen test is referred to as J statistics. Tests for first-order (second-order) correlation using Arellano-Bond order 1 and 2 are asymptotically N (0, 1). | ||||||||
| Variable Name | C Ⅰ | C Ⅱ | C Ⅲ |
| CAR (-1) | 0.5004*** (0.0019) |
0.4735*** (0.0023) |
0.4592*** (0.0027) |
| High COFI1 | −0.0088*** (0.0025) |
||
| Avg COFI1 | 0.0091*** (0.0019) |
||
| Low COFI1 | 0.0503*** (0.0046) |
||
| All Control Variables | Yes | Yes | Yes |
| Constant | 0.1787*** (0.0066) |
0.1973*** (0.0085) |
0.1551*** (0.0158) |
| Hansen Test (p-value) | 0.166 | 0.327 | 0.295 |
| AR (1) (p-value) | 0.056 | 0.017 | 0.051 |
| AR (2) (p-value) | 0.383 | 0.196 | 0.327 |
| Observations | 450 | 450 | 450 |
| Notes: The dependent variable is capital (CAR), calculated as the ratio of tier Ⅰ plus tier Ⅱ capital to risk-weighted assets. Standard errors are in parentheses. ***, **, and * denote the significance level at the corresponding 1%, 5%, and 10% level. The p-value of the Hansen test is referred to as J statistics. Tests for first-order (second-order) correlation using Arellano-Bond order 1 and 2 are asymptotically N (0, 1). | |||
| Variable Name | Model Ⅰ | Model Ⅱ | OWNP | OWNI | ||||
| Model Ⅲ | Model Ⅳ | Model Ⅴ | Model Ⅵ | Model Ⅶ | Model Ⅷ | |||
| COFI2 (-1) | 0.5701*** (0.0086) |
0.5832*** (0.0141) |
0.5245*** (0.0111) |
0.5516*** (0.0348) |
0.5891*** (0.0171) |
0.5879*** (0.0111) |
0.5753*** (0.0159) |
0.5579*** (0.0136) |
| ECTA | 0.0426*** (0.0014) |
0.0303*** (0.0044) |
0.0481*** (0.0014) |
0.0466*** (0.0065) |
0.0533*** (0.0028) |
0.0381*** (0.0023) |
0.0519*** (0.0019) |
0.0301*** (0.0054) |
| ECTA2 | 0.0432** (0.0181) |
|||||||
| Ownership | 0.0081*** (0.0008) |
0.0025*** (0.0006) |
||||||
| Ownership × ECTA | 0.0332** (0.0132) |
0.0144* (0.0083) |
0.0359*** (0.0062) |
0.0241*** (0.0041) |
||||
| Ownership × ECTA 2 | 0.1665*** (0.0543) |
-0.0447*** (0.0171) |
||||||
| LLPTL | −0.0144*** (0.0015) |
−0.0224*** (0.0041) |
0.0082** (0.0034) |
−0.0225*** (0.0057) |
−0.0042 (0.0061) |
−0.0165*** (0.002)6 |
−0.0123*** (0.0023) |
−0.0453*** (0.0054) |
| NLTA | 0.0401*** (0.0005) |
0.0386*** (0.0013) |
0.0349*** (0.0008) |
0.0377*** (0.0023) |
0.0368*** (0.0012) |
0.0424*** (0.0006) |
0.0369*** (0.0013) |
0.0348*** (0.0011) |
| Size | −0.0008*** (0.00008) |
−0.0007*** (0.00009) |
−0.0001 (0.0001) |
−0.0014*** (0.0002) |
−0.0009*** (0.0001) |
−0.0008*** (0.0001) |
−0.0007*** (0.0001) |
−0.0006*** (0.00007) |
| ME | −0.0552*** (0.0026) |
−0.0561*** (0.0031) |
−0.0666*** (0.0033) |
−0.0771*** (0.0068) |
−0.0713*** (0.0051) |
−0.0603*** (0.0031) |
−0.0681*** (0.0051) |
−0.0659*** (0.0048 |
| BSD | 0.0001*** (0.00003) |
0.00008* (0.00004) |
0.0001*** (0.00002) |
−0.00002 (0.00006) |
−0.000002 (0.00004) |
0.00009*** (0.00003) |
0.00002 (0.00005) |
0.00006 (0.00004) |
| GDP | 0.0022*** (0.00007) |
0.0022*** (0.00007) |
0.0023*** (0.00007) |
0.0021*** (0.0001) |
0.0021*** (0.00009) |
0.0022*** (0.00006) |
0.0021*** (0.00007) |
0.0022*** (0.00008) |
| Inflation | 0.0002*** (0.00003) |
0.0001** (0.00007) |
0.0003*** (0.00008) |
0.00006 (0.0001) |
0.0001 (0.00009) |
0.0002** (0.00007) |
0.0001* (0.00009) |
0.0001 (0.00009) |
| Constant | 0.0203*** (0.0041) |
0.0229*** (0.0058) |
0.0253*** (0.0051) |
0.0558*** (0.0111) |
0.0425*** (0.0088) |
0.0217*** (0.0049) |
0.0356*** (0.0091) |
0.0353*** (0.0072) |
| Hansen Test (p-value) | 0.222 | 0.211 | 0.214 | 0.133 | 0.279 | 0.258 | 0.246 | 0.201 |
| AR (1) (p-value) |
0.001 | 0.000 | 0.001 | 0.000 | 0.001 | 0.000 | 0.001 | 0.001 |
| AR (2) (p-value) |
0.437 | 0.478 | 0.446 | 0.379 | 0.431 | 0.467 | 0.465 | 0.401 |
| Observations | 450 | 450 | 450 | 450 | 450 | 450 | 450 | 450 |
| Notes: The dependent variable is CoFI2, calculated as the ratio of net interest income to total interest-earning assets. Standard errors are in parentheses. ***, **, and * denote the significance level at the corresponding 1%, 5%, and 10% level. The p-value of the Hansen test is referred to as J statistics. Tests for first-order (second-order) correlation using Arellano-Bond order 1 and 2 are asymptotically N (0, 1). | ||||||||
| Variable Name | C1 | C2 | C3 |
| COFI (-1) | 0.5629*** (0.0373) |
0.5938*** (0.0408) |
0.5958*** (0.0398) |
| High ECTA | 0.0042** (0.0021) |
||
| Avg ECTA | 0.0022** (0.0009) |
||
| Low ECTA | −0.0024*** (0.0009) |
||
| All Control Variables | Yes | Yes | Yes |
| Constant | 0.0528*** (0.0091) |
0.0452*** (0.0093) |
0.0451*** (0.0082) |
| Hansen Test (p-value) | 0.226 | 0.144 | 0.206 |
| AR (1) (p-value) | 0.001 | 0.001 | 0.002 |
| AR (2) (p-value) | 0.407 | 0.448 | 0.480 |
| Observations | 450 | 450 | 450 |
| Notes: The dependent variable is CoFI2, which is calculated as the ratio of net interest income to average earning assets. Standard errors are in parentheses. ***, **, and * denote the significance level at the corresponding 1%, 5%, and 10% level. The p-value of the Hansen test is referred to as J statistics. Tests for first-order (second-order) correlation using Arellano-Bond order 1 and 2 are asymptotically N (0, 1). | |||
| Null Hypothesis | Two Lags | Three Lags | Four Lags | |||
| F-statistics | Probability | F-statistics | Probability | F- Statistics | Probability | |
| ECTA does not Granger Cause COFI | 0.6158 | 0.5406 | 2.0969 | 0.0198** | 2.6034 | 0.000*** |
| COFI does not Granger Cause ECTA | 1.2413 | 0.2899 | 5.1543 | 0.0016*** | 6.7039 | 0.0000*** |
| Note: The asterisks represent different significance levels, where *** indicates 1% and ** indicates 5%. | ||||||
