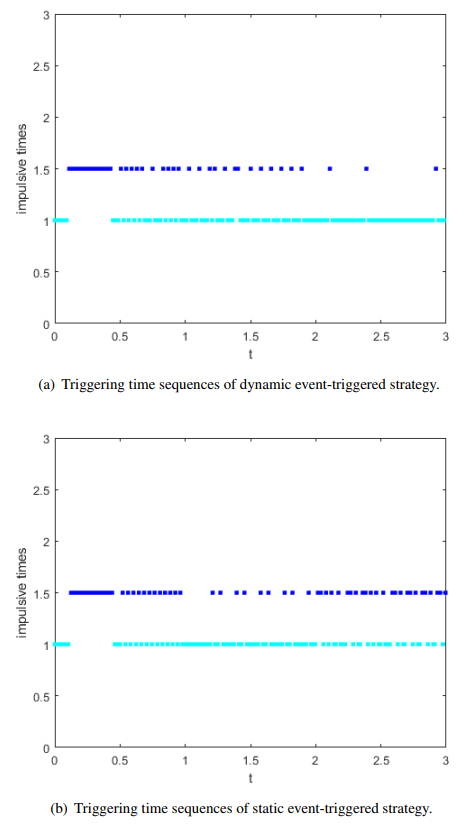
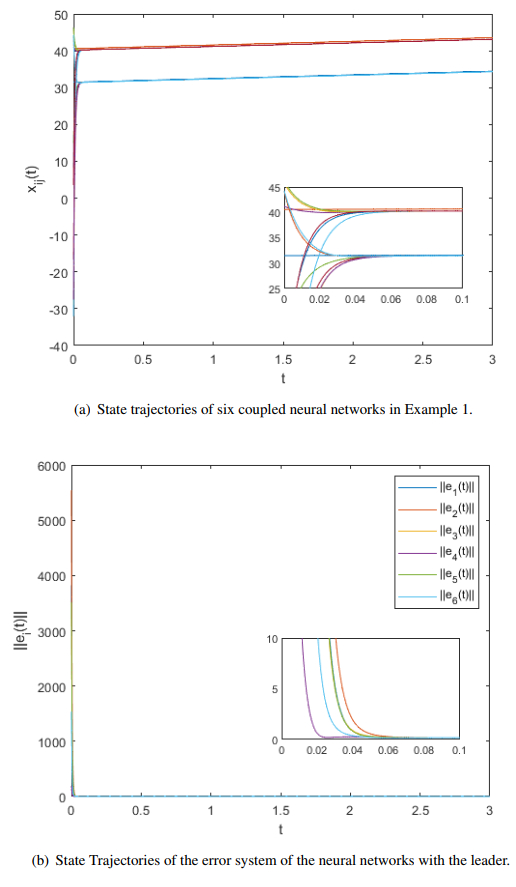
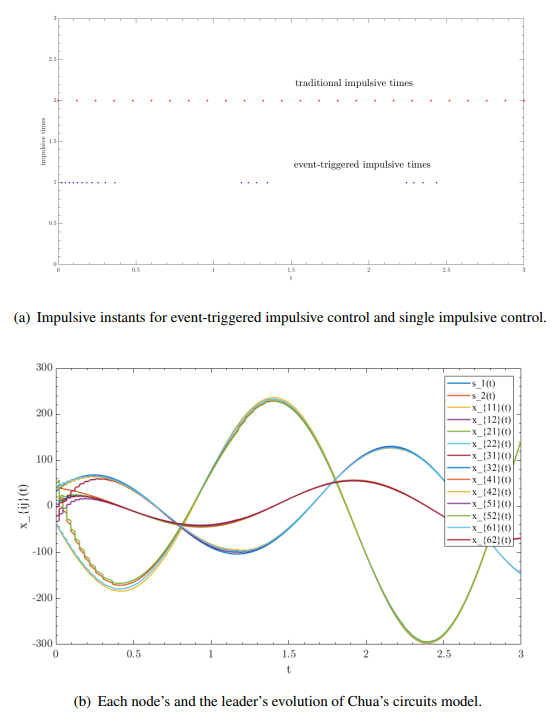
In this paper, the impulsive synchronization of a class of nonlinear multiple neural networks (MNNs) with multi-delays was considered under a dynamic event-based mechanism. To achieve a more comprehensive synchronization outcome and mitigate the conservativeness of impulsive control due to predetermined time sequences, we integrated a dynamic event-triggered strategy. This approach formed a novel control framework for generalized MNNs, where impulsive inputs were applied only under specific conditions governed by event-triggering rules. Towards the above objectives, the impulsive jumping system, resulting from dynamic component, and matrix measure method were invoked to directly increase the computational simplicity and extensibility of the study. As the outcome, the synchronization criteria for the MNNs could be achieved, and the exponential convergence rate is resolved by considering both the generalized comparison principle regarding impulsive systems and the variable parameter formula. Moreover, Zeno-freeness of the achieved triggering regulation is ensured. Finally, two numerical examples confirmed the validity of the designed approach.
Citation: Chengbo Yi, Jiayi Cai, Rui Guo. Synchronization of a class of nonlinear multiple neural networks with delays via a dynamic event-triggered impulsive control strategy[J]. Electronic Research Archive, 2024, 32(7): 4581-4603. doi: 10.3934/era.2024208
In this paper, the impulsive synchronization of a class of nonlinear multiple neural networks (MNNs) with multi-delays was considered under a dynamic event-based mechanism. To achieve a more comprehensive synchronization outcome and mitigate the conservativeness of impulsive control due to predetermined time sequences, we integrated a dynamic event-triggered strategy. This approach formed a novel control framework for generalized MNNs, where impulsive inputs were applied only under specific conditions governed by event-triggering rules. Towards the above objectives, the impulsive jumping system, resulting from dynamic component, and matrix measure method were invoked to directly increase the computational simplicity and extensibility of the study. As the outcome, the synchronization criteria for the MNNs could be achieved, and the exponential convergence rate is resolved by considering both the generalized comparison principle regarding impulsive systems and the variable parameter formula. Moreover, Zeno-freeness of the achieved triggering regulation is ensured. Finally, two numerical examples confirmed the validity of the designed approach.

| [1] |
P. Protachevicz, K. Iarosz, I. Caldas, C. Antonopoulos, A. M. Batista, J. Kurths, Influence of autapses on synchronization in neural networks with chemical synapses, Front. Syst. Neurosci., 14 (2020), 604563. https://doi.org/10.3389/fnsys.2020.604563 doi: 10.3389/fnsys.2020.604563

|
| [2] |
N. Gunasekaran, G. Zhai, Q. Yu, Sampled-data synchronization of delayed multi-agent networks and its application to coupled circuit, Neurocomputing, 413 (2020), 499–511. https://doi.org/10.1016/J.NEUCOM.2020.05.060 doi: 10.1016/J.NEUCOM.2020.05.060
|
| [3] |
N. Gunasekaran, G. Zhai, Stability analysis for uncertain switched delayed complex-valued neural networks, Neurocomputing, 367 (2019), 198–206. https://doi.org/10.1016/J.NEUCOM.2019.08.030 doi: 10.1016/J.NEUCOM.2019.08.030
|
| [4] |
F. Ferrari, R. Viana, A. Reis, K. Iarosz, I. Caldas, A. Batista, A network of networks model to study phase synchronization using structural connection matrix of human brain, Physica A, 496 (2018), 162–170. https://doi.org/10.1016/J.PHYSA.2017.12.129 doi: 10.1016/J.PHYSA.2017.12.129
|
| [5] |
X. Zhang, Q. Han, Z, Zeng, Hierarchical type stability criteria for delayed neural networks via Canonical Bessel–Legendre inequalities, IEEE Trans. Cybern., 48 (2018), 1660–1671. https://doi.org/10.1109/TCYB.2017.2776283 doi: 10.1109/TCYB.2017.2776283
|
| [6] |
L. Hou, P. Ma, X. Ma, H. Sun, $H_{\infty}$ exponential synchronization of switched cellular neural networks based on disturbance observer-based control, Int. J. Control Autom. Syst., 22 (2024), 1430–1441. https://doi.org/10.1007/s12555-022-0917-7 doi: 10.1007/s12555-022-0917-7
|
| [7] | W. Qi, N. Zhang, J. Park, Z. Wu, H. Yan, Protocol-based synchronization of semi-Markovian jump neural networks with DoS attacks and application to quadruple-tank process, IEEE Trans. Autom. Sci. Eng., (2024), 1–13. https://doi.org/10.1109/TASE.2024.3365503 |
| [8] |
J. Cao, L. Li, Cluster synchronization in an array of hybrid coupled neural networks with delay, Neural Netw., 22 (2009), 335–342. https://doi.org/10.1016/j.neunet.2009.03.006 doi: 10.1016/j.neunet.2009.03.006
|
| [9] |
H. Lin, H. Zeng, X. Zhang, W. Wang, Stability analysis for delayed neural networks via a generalized reciprocally convex inequality, IEEE Trans. Neural Networks Learn. Syst., 34 (2023), 7419–7499. https://doi.org/10.1109/tnnls.2022.3144032 doi: 10.1109/tnnls.2022.3144032
|
| [10] |
Y. Yang, J. Cao, Exponential synchronization of the complex dynamical networks with a coupling delay and impulsive effects, Nonlinear Anal. Real World Appl., 11 (2010), 1650–1659. https://doi.org/10.1016/J.NONRWA.2009.03.020 doi: 10.1016/J.NONRWA.2009.03.020
|
| [11] |
X. Li, D. Bi, X. Xie, Y. Xie, Multi-synchronization of stochastic coupled multi-stable neural networks with time-varying delay by impulsive control, IEEE Access, 7 (2019), 15641–15653. https://doi.org/10.1109/ACCESS.2019.2893641 doi: 10.1109/ACCESS.2019.2893641
|
| [12] |
X. Yi, W. Lu, T. Chen, Pull-based distributed event-triggered consensus for multiagent systems with directed topologies, IEEE Trans. Neural Networks Learn. Syst., 28 (2017), 71–79. https://doi.org/10.1109/TNNLS.2015.2498303 doi: 10.1109/TNNLS.2015.2498303
|
| [13] |
Q. Ma, S. Xu, F. Lewis, Second-order consensus for directed multi-agent systems with sampled data, Int. J. Robust Nonlinear Control, 24 (2014), 2560–2573. https://doi.org/10.1002/rnc.3010 doi: 10.1002/rnc.3010
|
| [14] |
T. Chen, X. Liu, W. Lu, Pinning complex networks by a single controller, IEEE Trans. Circuits Syst. I Regul. Pap., 54 (2007), 1317–1326. https://doi.org/10.1109/TCSI.2007.895383 doi: 10.1109/TCSI.2007.895383
|
| [15] |
G. Ling, X. Liu, M. Ge, Y. Wu, Delay-dependent cluster synchronization of time-varying complex dynamical networks with noise via delayed pinning impulsive control, J. Franklin Inst., 358 (2021), 3193–3214. https://doi.org/10.1016/j.jfranklin.2021.02.004 doi: 10.1016/j.jfranklin.2021.02.004
|
| [16] |
J. Cheng, J. Xu, J. Park, H. Yan, D. Zhang, Protocol-based SMC for singularly perturbed switching systems with sojourn probabilities, Automatica, 161 (2024), 111470. https://doi.org/10.1016/j.automatica.2023.111470 doi: 10.1016/j.automatica.2023.111470
|
| [17] |
J. Cai, J. Feng, J. Wang, Y. Zhao, Tracking consensus of multi-agent systems under switching topologies via novel SMC: An event-triggered approach, IEEE Trans. Network Sci. Eng., 9 (2022), 2150–2163. https://doi.org/10.1109/TNSE.2022.3155405 doi: 10.1109/TNSE.2022.3155405
|
| [18] | J. Cai, C. Yi, Y. Wu, D. Liu, G. Zhong, Leader-following consensus of nonlinear singular switched multi-agent systems via sliding mode control, Asian J. Control, (2024), 1–14. https://doi.org/10.1002/ASJC.3320 |
| [19] |
Q. Liu, Z. Wang, X. He, D. Zhou, Event-based distributed filtering over Markovian switching topologies, IEEE Trans. Network Sci. Eng., 64 (2019), 1595–1602. https://doi.org/10.1109/TAC.2018.2853570 doi: 10.1109/TAC.2018.2853570
|
| [20] |
W. Yang, Y. Wang, I. Morǎrescu, X. Liu, Y. Huang, Fixed-time synchronization of competitive neural networks with multiple time scales, IEEE Trans. Neural Networks Learn. Syst., 33 (2022), 4133–4138. https://doi.org/10.1109/TNNLS.2021.3052868 doi: 10.1109/TNNLS.2021.3052868
|
| [21] |
A. Kazemy, J. Lam, X. Zhang, Event-triggered output feedback synchronization of master-slave neural networks under deception attacks, IEEE Trans. Neural Networks Learn. Syst., 33 (2022), 952–961. https://doi.org/10.1109/TNNLS.2020.3030638 doi: 10.1109/TNNLS.2020.3030638
|
| [22] | D. Dimarogonas, K. Johansson, Event-triggered control for multi-agent systems, in Proceedings of the 48h IEEE Conference on Decision and Control (CDC) held jointly with 2009 28th Chinese Control Conference, IEEE, (2009), 7131–7136. https://doi.org/10.1109/CDC.2009.5399776 |
| [23] |
J. Cheng, L. Xie, D. Zhang, H. Yan, Novel event-triggered protocol to sliding mode control for singular semi-Markov jump systems, Automatica, 151 (2023), 110906. https://doi.org/10.1016/j.automatica.2023.110906 doi: 10.1016/j.automatica.2023.110906
|
| [24] |
X. Zhang, Q. Han, B. Zhang, X. Ge, D. Zhang, Accumulated-state-error-based event-triggered sampling scheme and its application to $H_{\infty}$ control of sampled-data systems, Sci. China Inf. Sci., 67 (2024), 162206. https://doi.org/10.1007/s11432-023-4038-3 doi: 10.1007/s11432-023-4038-3
|
| [25] |
Q. Li, B. Shen, Z. Wang, T. Huang, J. Luo, Synchronization control for a class of discrete time-delay complex dynamical networks: A dynamic event-triggered approach, IEEE Trans. Cybern., 49 (2019), 1979–1986. https://doi.org/10.1109/TCYB.2018.2818941 doi: 10.1109/TCYB.2018.2818941
|
| [26] |
W. He, B. Xu, Q. Han, F. Qian, Adaptive consensus control of linear multiagent systems with dynamic event-triggered strategies, IEEE Trans. Cybern., 50 (2020), 2996–3008. https://doi.org/10.1109/TCYB.2019.2920093 doi: 10.1109/TCYB.2019.2920093
|
| [27] |
J. Cheng, J. Park, H. Yan, Z. Wu, An event-triggered round-robin protocol to dynamic output feedback control for nonhomogeneous Markov switching systems, Automatica, 145 (2022), 110525. https://doi.org/10.1016/j.automatica.2022.110525 doi: 10.1016/j.automatica.2022.110525
|
| [28] |
J. Lu, Z. Wang, J. Cao, D. Ho, J. Kurths, Pinning impulsive stabilization of nonlinear dynamical networks with time-varying delay, Int. J. Bifurcation Chaos, 22 (2012), 1250176. https://doi.org/10.1142/S0218127412501763 doi: 10.1142/S0218127412501763
|
| [29] |
W. Chen, X. Lu, W. X. Zheng, Impulsive stabilization and impulsive synchronization of discrete-time delayed neural networks, IEEE Trans. Neural Networks Learn. Syst., 26 (2015), 734–748. https://doi.org/10.1109/TNNLS.2014.2322499 doi: 10.1109/TNNLS.2014.2322499
|
| [30] |
B. Liu, W. Lu, T. Chen, Pinning consensus in networks of multiagents via a single impulsive controller, IEEE Trans. Neural Networks Learn. Syst., 24 (2013), 1141–1149. https://doi.org/10.1109/TNNLS.2013.2247059 doi: 10.1109/TNNLS.2013.2247059
|
| [31] |
X. Yang, Z. Yang, X. Nie, Exponential synchronization of discontinuous chaotic systems via delayed impulsive control and its application to secure communication, Commun. Nonlinear Sci. Numer. Simul., 19 (2014), 1529–1543. https://doi.org/10.1016/J.CNSNS.2013.09.012 doi: 10.1016/J.CNSNS.2013.09.012
|
| [32] |
Y. Zhou, Z. Zeng, Event-triggered impulsive control on quasi-synchronization of memristive neural networks with time-varying delays, Neural Netw., 110 (2019), 55–65. https://doi.org/10.1016/j.neunet.2018.09.014 doi: 10.1016/j.neunet.2018.09.014
|
| [33] |
X. Lu, H. Li, Consensus of singular linear multiagent systems via hybrid control, IEEE Trans. Control Network Syst., 9 (2022), 647–656. https://doi.org/10.1109/TCNS.2022.3161193 doi: 10.1109/TCNS.2022.3161193
|
| [34] |
J. Chen, B. Chen, Z. Zeng, Synchronization in multiple neural networks with delay and disconnected switching topology via event-triggered impulsive control strategy, IEEE Trans. Ind. Electron., 68 (2021), 2491–2500. https://doi.org/10.1109/TIE.2020.2975498 doi: 10.1109/TIE.2020.2975498
|
| [35] |
M. Wang, S. Wu, X. Li, Event-triggered delayed impulsive control for nonlinear systems with applications, J. Franklin Inst., 358 (2021), 4277–4291. https://doi.org/10.1016/j.jfranklin.2021.03.021 doi: 10.1016/j.jfranklin.2021.03.021
|
| [36] |
W. Sun, Z. Yuan, Z. Lu, J. Hu, S. Chen, Quasi-synchronization of heterogeneous neural networks with time-varying delays via event-triggered impulsive controls, IEEE Trans. Cybern., 52 (2022), 3855–3866. https://doi.org/10.1109/TCYB.2020.3012707 doi: 10.1109/TCYB.2020.3012707
|
| [37] |
C. Yi, C. Xu, J. Feng, J. Wang, Y. Zhao, Leading-following consensus for multi-agent systems with event-triggered delayed impulsive control, IEEE Access, 7 (2019), 136419–136427. https://doi.org/10.1109/ACCESS.2019.2942603 doi: 10.1109/ACCESS.2019.2942603
|
| [38] |
X. Li, M. Bohner, C. Wang, Impulsive differential equations: Periodic solutions and applications, Automatica, 52 (2015), 173–178. https://doi.org/10.1016/j.automatica.2014.11.009 doi: 10.1016/j.automatica.2014.11.009
|
| [39] |
C. Yi, J. Feng, J. Wang, C. Xu, Y. Zhao, Synchronization of delayed neural networks with hybrid coupling via partial mixed pinning impulsive control, Appl. Math. Comput., 312 (2017), 78–90. https://doi.org/10.1016/j.amc.2017.04.030 doi: 10.1016/j.amc.2017.04.030
|
| [40] |
W. Zhu, Z. Jiang, G. Feng, Event-based consensus of multi-agent systems with general linear models, Automatica, 50 (2014), 552–558. https://doi.org/10.1016/j.automatica.2013.11.023 doi: 10.1016/j.automatica.2013.11.023
|
| [41] |
V. Dimarogonas, E. Frazzoli, K. Johansson, Distributed event-triggered control for multi-agent systems, IEEE Trans. Autom. Control, 57 (2012), 1291–1297. https://doi.org/10.1109/TAC.2011.2174666 doi: 10.1109/TAC.2011.2174666
|
| [42] |
G. Ren, Y. Yu, Mean square consensus of stochastic multi-agent systems with nonlinear dynamics by distributed event-triggered strategy, Int. J. Control, 92 (2019), 745–754. https://doi.org/10.1080/00207179.2017.1369572 doi: 10.1080/00207179.2017.1369572
|
| [43] |
X. Lv, J. Cao, X. Li, M. Abdel-Aty, U. A. Al-Juboori, Synchronization analysis for complex dynamical networks with coupling delay via event-triggered delayed impulsive control, IEEE Trans. Cybern., 51 (2020), 5269–5278. https://doi.org/10.1109/TCYB.2020.2974315 doi: 10.1109/TCYB.2020.2974315
|
| [44] | M. Vidyasagar, S. H. Johnson, Nonlinear systems analysis, J. Dyn. Syst. Meas. Control, 100 (1978), 161. https://doi.org/10.1115/1.3426360 |
Figures(3)
Chengbo Yi, Jiayi Cai, Rui Guo. Synchronization of a class of nonlinear multiple neural networks with delays via a dynamic event-triggered impulsive control strategy[J]. Electronic Research Archive, 2024, 32(7): 4581-4603. doi: 10.3934/era.2024208


 DownLoad: