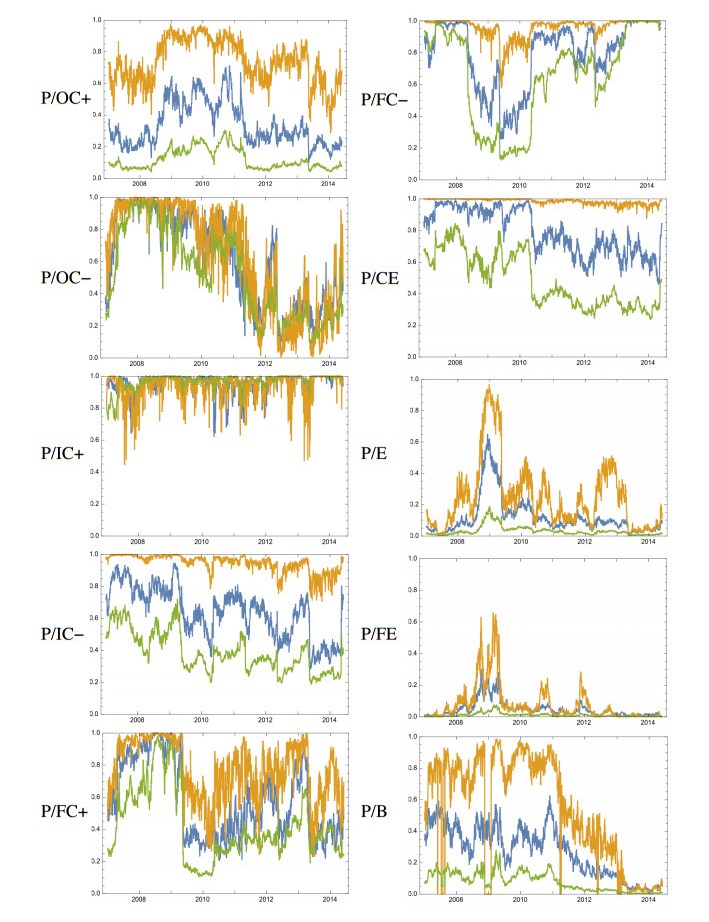
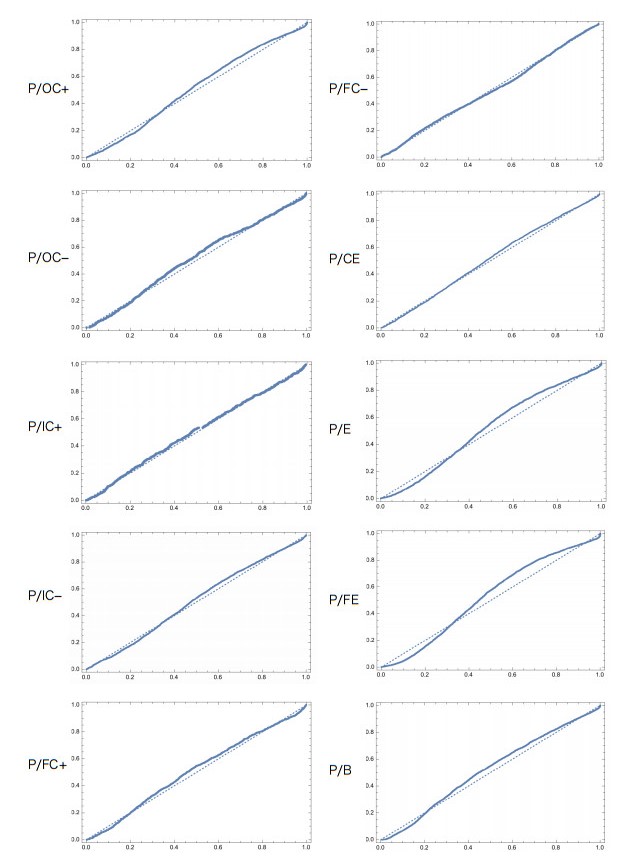
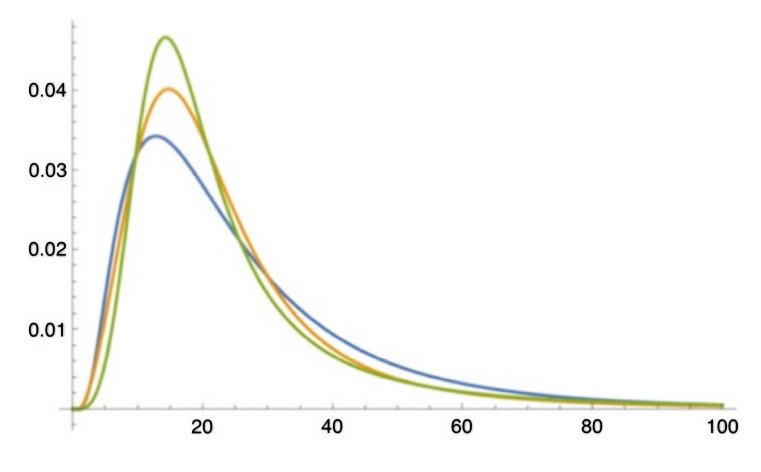
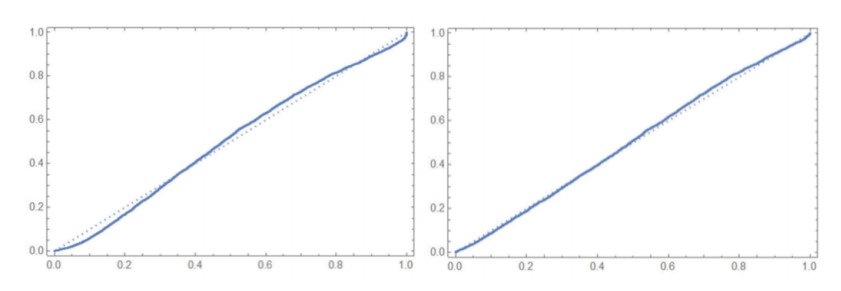
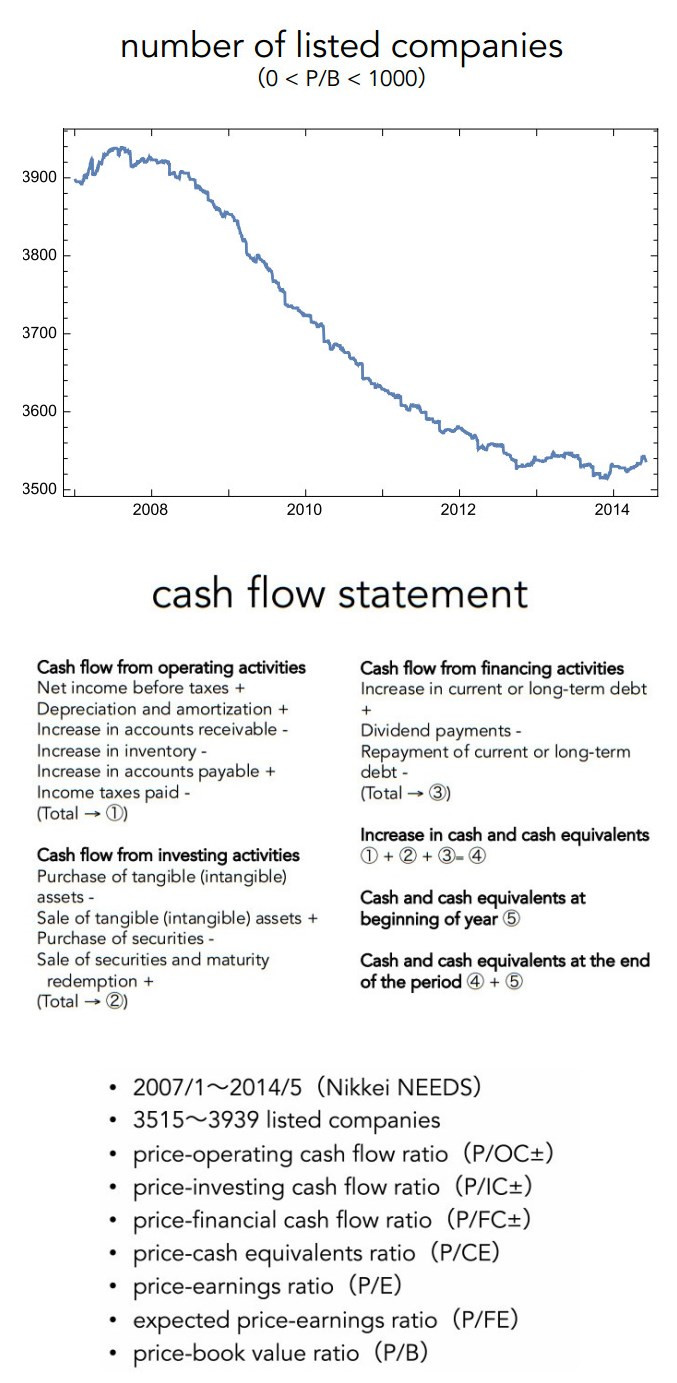
Trade is one of the essential features of human intelligence. The securities market is the ultimate expression of it. The fundamental indicators of stocks include information about the effects of noise and bias on stock prices; however, distinguishing between them is generally hard. In this article, I present the fundamentals hypothesis based on rational expectations and detect the global bias components from the actual fundamental indicators using a log-normal distribution model based on the fundamentals hypothesis. The analysis results show that biases generally exhibit the same characteristics, strongly supporting our theory. Notably, the positive price-to-cash flows from the investing activities ratio are proxies for the fundamentals. The answer is simple: "Cash is a fact, and profit is an opinion." Namely, opinions of management and accounting added noise to fundamentals. As a result, we obtain the Kesten process and the Pareto distribution. This result means the market knows this noise and shows a stable global bias in the stock market.
Citation: Kazuo Sano. Intelligence and global bias in the stock market[J]. Data Science in Finance and Economics, 2023, 3(2): 184-195. doi: 10.3934/DSFE.2023011
Trade is one of the essential features of human intelligence. The securities market is the ultimate expression of it. The fundamental indicators of stocks include information about the effects of noise and bias on stock prices; however, distinguishing between them is generally hard. In this article, I present the fundamentals hypothesis based on rational expectations and detect the global bias components from the actual fundamental indicators using a log-normal distribution model based on the fundamentals hypothesis. The analysis results show that biases generally exhibit the same characteristics, strongly supporting our theory. Notably, the positive price-to-cash flows from the investing activities ratio are proxies for the fundamentals. The answer is simple: "Cash is a fact, and profit is an opinion." Namely, opinions of management and accounting added noise to fundamentals. As a result, we obtain the Kesten process and the Pareto distribution. This result means the market knows this noise and shows a stable global bias in the stock market.

| [1] |
Aoki S and Nirei M (2017) Zipf's law, pareto's law, and the evolution of top incomes in the united states. Am Econ J-Macroecon 9: 36–71. https://doi.org/10.1257/mac.20150051 doi: 10.1257/mac.20150051

|
| [2] |
Bewley T (1977) The permanent income hypothesis: A theoretical formulation. J Econ Theory 16: 252–292. https://doi.org/10.1016/0022-0531(77)90009-6 doi: 10.1016/0022-0531(77)90009-6
|
| [3] |
Black F (1986) Noise. J Financ 41: 528–543. https://doi.org/10.1111/j.1540-6261.1986.tb04513.x doi: 10.1111/j.1540-6261.1986.tb04513.x
|
| [4] |
Bodenhorn D (1964) A cash-flow concept of profit. J Financ 19: 16–31. https://doi.org/10.2307/2977477 doi: 10.2307/2977477
|
| [5] |
Brosnan SF, Grady MF, Lambeth SP, et al. (2008) Chimpanzee autarky. PLOS ONE 3: 1–5. https://doi.org/10.1371/journal.pone.0001518 doi: 10.1371/journal.pone.0001518
|
| [6] |
De Long JB, Shleifer A, Summers LH, et al. (1990) Noise trader risk in financial markets. J Polit Econ 98: 703–738. https://doi.org/10.1086/261703 doi: 10.1086/261703
|
| [7] |
Fama EF (1965) The behavior of stock-market prices. J Bus 38: 34–105. https://doi.org/10.1086/294743 doi: 10.1086/294743
|
| [8] |
Gabaix X (1999) Zipf's Law for Cities: An Explanation. Q J Econ 114: 739–767. https://doi.org/10.1162/003355399556133 doi: 10.1162/003355399556133
|
| [9] |
Hartley JE (1996) Retrospectives: The origins of the representative agent. J Econ Perspect 10: 169–177. https://doi.org/10.1257/jep.10.2.169 doi: 10.1257/jep.10.2.169
|
| [10] |
Kesten H (1973) Random difference equations and Renewal theory for products of random matrices. Acta Math 131: 207–248. https://doi.org/10.1007/BF02392040 doi: 10.1007/BF02392040
|
| [11] |
Kirman AP (1992) Whom or what does the representative individual represent? J Econ Perspect 6: 117–136. https://doi.org/10.1257/jep.6.2.117 doi: 10.1257/jep.6.2.117
|
| [12] |
Kirman A (1993) Ants, rationality, and recruitment. Q J Econ 108: 137–156. https://doi.org/10.2307/2118498 doi: 10.2307/2118498
|
| [13] |
Kobayashi N, Kuninaka H, Wakita J, et al. (2011) Statistical features of complex systems: toward establishing sociological physics. J Phys Soc Japan 80: 072001. https://doi.org/10.1143/JPSJ.80.072001 doi: 10.1143/JPSJ.80.072001
|
| [14] |
Lucas RE (1976) Econometric policy evaluation: A critique. Carnegie-Rochester Conference Series on Public Policy 1: 19–46. https://doi.org/10.1016/S0167-2231(76)80003-6 doi: 10.1016/S0167-2231(76)80003-6
|
| [15] | Malone TW and Bernstein MS (2015) Handbook of collective intelligence, MIT press. |
| [16] |
Muth JF (1961) Rational expectations and the theory of price movements. Econometrica 29: 315–335. https://doi.org/10.2307/1909635 doi: 10.2307/1909635
|
| [17] |
Nirei M and Aoki S (2016) Pareto distribution of income in neoclassical growth models. Rev Econ Dyn 20: 25–42. https://doi.org/10.1016/j.red.2015.11.002 doi: 10.1016/j.red.2015.11.002
|
| [18] |
Samuels JM (1965) Size and the growth of firms. Rev Econ Stud 32: 105–112. https://doi.org/10.2307/2296055 doi: 10.2307/2296055
|
| [19] |
Sano K (2022) A binary decision model and fat tails in financial market. Appl Sci 12: 7019. https://doi.org/10.3390/app12147019 doi: 10.3390/app12147019
|
| [20] |
Tversky A and Kahneman D (1974) Judgment under uncertainty: Heuristics and biases. Science 185: 1124–1131. https://doi.org/10.1126/science.185.4157.112 doi: 10.1126/science.185.4157.112
|
Figures(5) / Tables(1)
Kazuo Sano. Intelligence and global bias in the stock market[J]. Data Science in Finance and Economics, 2023, 3(2): 184-195. doi: 10.3934/DSFE.2023011


 DownLoad: