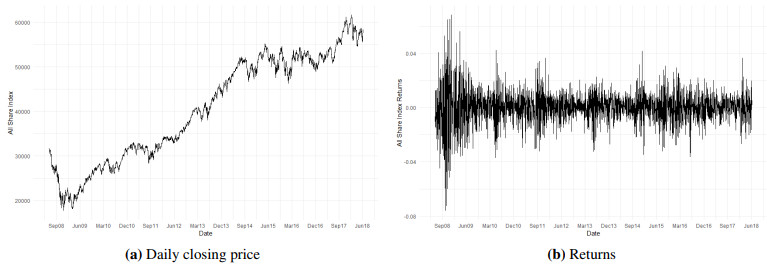
The South African financial market is developing with periods of high and low volatility. Employing an adequate volatility model is essential to manage market risk. This research study was designed to investigate the effectiveness of the fractionally integrated asymmetric power autoregressive conditional heteroskedasticity contrasted with long-memory GARCH-type models, such as the fractionally integrated generalized autoregressive conditional heteroskedasticity and the hyperbolic generalized autoregressive conditional heteroskedasticity for producing the measure of market risk known as the value at risk. These long-memory GARCH-type models assume that the distributions of the index returns follow normal, student-$ t $, skewed student-$ t $ and generalized error distributions. The historical closing price time series of the Johannesburg Stock Exchange all share, the mining and the banking indices are considered. The value at risk and its backtesting for short and long trading positions on the different confident levels are computed and they correspond to the right and left quantiles of the return distributions, respectively. The results reveal that FIAPARCH with a standard student-$ t $ distribution is an appropriate model for producing a robust value at risk in the context of mining and banking indices. Alternatively, FIGARCH with the assumed skewed student-$ t $ distribution model is a good fit to produce a value at risk for the Johannesburg Stock Exchange All Share Index.
Citation: Moses Khumalo, Hopolang Mashele, Modisane Seitshiro. Quantification of the stock market value at risk by using FIAPARCH, HYGARCH and FIGARCH models[J]. Data Science in Finance and Economics, 2023, 3(4): 380-400. doi: 10.3934/DSFE.2023022
The South African financial market is developing with periods of high and low volatility. Employing an adequate volatility model is essential to manage market risk. This research study was designed to investigate the effectiveness of the fractionally integrated asymmetric power autoregressive conditional heteroskedasticity contrasted with long-memory GARCH-type models, such as the fractionally integrated generalized autoregressive conditional heteroskedasticity and the hyperbolic generalized autoregressive conditional heteroskedasticity for producing the measure of market risk known as the value at risk. These long-memory GARCH-type models assume that the distributions of the index returns follow normal, student-$ t $, skewed student-$ t $ and generalized error distributions. The historical closing price time series of the Johannesburg Stock Exchange all share, the mining and the banking indices are considered. The value at risk and its backtesting for short and long trading positions on the different confident levels are computed and they correspond to the right and left quantiles of the return distributions, respectively. The results reveal that FIAPARCH with a standard student-$ t $ distribution is an appropriate model for producing a robust value at risk in the context of mining and banking indices. Alternatively, FIGARCH with the assumed skewed student-$ t $ distribution model is a good fit to produce a value at risk for the Johannesburg Stock Exchange All Share Index.

| [1] |
Abuzayed B, Al-Fayoumi N, Charfeddine L (2018) Long range dependence in an emerging stock market's sectors: volatility modelling and var forecasting. Appl Econ 50: 2569-2599. https://doi.org/10.1080/00036846.2017.1403559 doi: 10.1080/00036846.2017.1403559

|
| [2] |
Arouri MEH, Hammoudeh S, Lahiani A, et al. (2012) Long memory and structural breaks in modeling the return and volatility dynamics of precious metals. Q Rev Econ Financ 52: 207-218. https://doi.org/10.1016/j.qref.2012.04.004 doi: 10.1016/j.qref.2012.04.004
|
| [3] |
Baillie RT (1996) Long memory processes and fractional integration in econometrics. J Econometrics 73: 5-59. https://doi.org/10.1016/0304-4076(95)01732-1 doi: 10.1016/0304-4076(95)01732-1
|
| [4] |
Barkoulas JT, Baum CF, Travlos N (2000) Long memory in the greek stock market. Appl Financ Econ 10: 177-184. https://doi.org/10.1080/096031000331815 doi: 10.1080/096031000331815
|
| [5] | Basel Committee on Banking Supervision (2013) Fundamental review of the trading book: A revised market risk framework. Available from: https://www.bis.org/publ/bcbs265.pdf. |
| [6] |
Bentes SR (2015) Forecasting volatility in gold returns under the garch, igarch and figarch frameworks: New evidence. Physica A 438: 355-364. https://doi.org/10.1016/j.physa.2015.07.011 doi: 10.1016/j.physa.2015.07.011
|
| [7] | Beran J (2017) Statistics for long-memory processes, Routledge. https://doi.org/10.1201/9780203738481 |
| [8] |
Bollerslev T (1986) Generalized autoregressive conditional heteroskedasticity. J Econometrics 31: 307-327. https://doi.org/10.1016/0304-4076(86)90063-1 doi: 10.1016/0304-4076(86)90063-1
|
| [9] |
Cavanaugh JE, Neath AA (2019) The akaike information criterion: Background, derivation, properties, application, interpretation, and refinements. Wires Computat Stat 11: e1460. https://doi.org/10.1002/wics.1460 doi: 10.1002/wics.1460
|
| [10] |
Cerqueti R, Giacalone M, Panarello D (2019) A generalized error distribution copula-based method for portfolios risk assessment. Physica A 524: 687-695. https://doi.org/10.1016/j.physa.2019.04.077 doi: 10.1016/j.physa.2019.04.077
|
| [11] |
Cheung YW (1993) Long memory in foreign-exchange rates. J Bus Econ Stat 11: 93-101. https://doi.org/10.1080/07350015.1993.10509935 doi: 10.1080/07350015.1993.10509935
|
| [12] |
Chinhamu K, Chifurira R, Ranganai E (2022) Value-at-risk estimation of precious metal returns using long memory garch models with heavy-tailed distribution. J Stat Appl Probab 11: 89-107. http://dx.doi.org/10.18576/jsap/110107 doi: 10.18576/jsap/110107
|
| [13] |
Chkili W, Hammoudeh S, Nguyen DK (2014) Volatility forecasting and risk management for commodity markets in the presence of asymmetry and long memory. Energ Econ 41: 1-18. https://doi.org/10.1016/j.eneco.2013.10.011 doi: 10.1016/j.eneco.2013.10.011
|
| [14] |
Conrad C (2010) Non-negativity conditions for the hyperbolic garch model. J Econometrics 157: 441-457. https://doi.org/10.1016/j.jeconom.2010.03.045 doi: 10.1016/j.jeconom.2010.03.045
|
| [15] |
Conrad C, Haag BR (2006) Inequality constraints in the fractionally integrated garch model. J Financ Econometrics 4: 413-449. https://doi.org/10.1093/jjfinec/nbj015 doi: 10.1093/jjfinec/nbj015
|
| [16] |
Cont R (2001) Empirical properties of asset returns: stylized facts and statistical issues. Quant Financ 1: 223. https://dx.doi.org/10.1088/1469-7688/1/2/304 doi: 10.1088/1469-7688/1/2/304
|
| [17] |
Davidson J (2004) Moment and memory properties of linear conditional heteroscedasticity models, and a new model. J Bus Econ Stat 22: 16-29. https://doi.org/10.1198/073500103288619359 doi: 10.1198/073500103288619359
|
| [18] |
Ding Z, Granger CW, Engle RF (1993) A long memory property of stock market returns and a new model. J Empir Financ 1: 83-106. https://doi.org/10.1016/0927-5398(93)90006-D doi: 10.1016/0927-5398(93)90006-D
|
| [19] | Enow ST (2023) Exploring volatility clustering financial markets and its implication. J Econ Soc Dev Resilient Society 10. |
| [20] | Fama EF (1965) The behavior of stock-market prices. J Bus 38: 34-105. https://www.jstor.org/stable/2350752 |
| [21] |
Gaye Gencer H, Demiralay S (2016) Volatility modeling and value-at-risk (var) forecasting of emerging stock markets in the presence of long memory, asymmetry, and skewed heavy tails. Emerg Mark Financ Tr 52: 639-657. https://doi.org/10.1080/1540496X.2014.998557 doi: 10.1080/1540496X.2014.998557
|
| [22] |
Geweke J, Porter-Hudak S (1983) The estimation and application of long memory time series models. J Time Ser Anal 4: 221-238. https://doi.org/10.1111/j.1467-9892.1983.tb00371.x doi: 10.1111/j.1467-9892.1983.tb00371.x
|
| [23] |
Haque ME, Farzana N (2021) Modeling asymmetric effects and long memory in conditional volatility of dhaka stock exchange: New evidence from family of figarch models. Account Financ 9: 1103-15. https://dx.doi.org/10.13189/ujaf.2021.090520 doi: 10.13189/ujaf.2021.090520
|
| [24] | Härdle WK, Mungo J (2008) Value-at-risk and expected shortfall when there is long range dependence. |
| [25] |
Hurst HE (1951) Long-term storage capacity of reservoirs. T Am Soc Civil Eng 116: 770-799. https://doi.org/10.1061/TACEAT.0006518 doi: 10.1061/TACEAT.0006518
|
| [26] | Jorion P (2007) Value at risk: the new benchmark for managing financial risk, The McGraw-Hill Companies, Inc. Available from: https://thuvienso.hoasen.edu.vn/handle/123456789/10569. |
| [27] | Kasman A (2009) Estimating value-at-risk for the turkish stock index futures in the presence of long memory volatility. Cent Bank Rev 9: 1. Available from: https://core.ac.uk/reader/6462820. |
| [28] |
Kaya Soylu P, Okur M, Çatıkkaş Ö, et al. (2020) Long memory in the volatility of selected cryptocurrencies: Bitcoin, ethereum and ripple. J Risk Financ Manag 13: 107. https://doi.org/10.3390/jrfm13060107 doi: 10.3390/jrfm13060107
|
| [29] |
Klar B, Lindner F, Meintanis SG (2012) Specification tests for the error distribution in garch models. Computat Stat Data Anal 56: 3587-3598. https://doi.org/10.1016/j.csda.2010.05.029 doi: 10.1016/j.csda.2010.05.029
|
| [30] |
Kupiec PH (1995) Techniques for verifying the accuracy of risk measurement models. J Deriv 3: 73-84. https://doi.org/10.3905/jod.1995.407942 doi: 10.3905/jod.1995.407942
|
| [31] |
Li M, Li WK, Li G (2015) A new hyperbolic garch model. J Econometrics 189: 428-436. https://doi.org/10.1016/j.jeconom.2015.03.034 doi: 10.1016/j.jeconom.2015.03.034
|
| [32] | Ma J (2019) Test and application of persistence point of long memory time series, in '1st International Conference on Business, Economics, Management Science (BEMS 2019), Atlantis Press, 1-8. https://doi.org/10.2991/bems-19.2019.1 |
| [33] |
Mabrouk S, Saadi S (2012) Parametric value-at-risk analysis: Evidence from stock indices. Q Rev Econ Financ 52: 305-321. https://doi.org/10.1016/j.qref.2012.04.006 doi: 10.1016/j.qref.2012.04.006
|
| [34] |
McMillan D, Thupayagale P (2010) Evaluating stock index return value-at-risk estimates in south africa: Comparative evidence for symmetric, asymmetric and long memory garch models. J Emerg Mark Financ 9: 325-345. https://doi.org/10.1177/097265271000900304 doi: 10.1177/097265271000900304
|
| [35] |
Mighri Z, Jaziri R (2023) Long-memory, asymmetry and fat-tailed garch models in value-at-risk estimation: Empirical evidence from the global real estate markets. J Q Econ 21: 41-97. https://doi.org/10.1007/s40953-022-00331-w doi: 10.1007/s40953-022-00331-w
|
| [36] |
Patra B, Padhi P (2015) Backtesting of value at risk methodology: Analysis of banking shares in india. J Appl Econ Res 9: 254-277. https://doi.org/10.1177/0973801015583739 doi: 10.1177/0973801015583739
|
| [37] | Peters JP (2001) Estimating and forecasting volatility of stock indices using asymmetric garch models and (skewed) student-t densities. Preprint, University of Liege, Belgium 3: 2. |
| [38] |
Purczyński J, Bednarz-Okrzyńska K (2014) Estimation of the shape parameter of ged distribution for a small sample size. Folia Oecon Stetinensia 14: 35-46. https://doi.org/10.2478/foli-2014-0103 doi: 10.2478/foli-2014-0103
|
| [39] |
Sethapramote Y, Prukumpai S, Kanyamee T (2014) Evaluation of value-at-risk estimation using long memory volatility models: Evidence from stock exchange of thailand. Available at SSRN 2396531. https://dx.doi.org/10.2139/ssrn.2396531 doi: 10.2139/ssrn.2396531
|
| [40] |
So MK (2000) Long-term memory in stock market volatility. Appl Financ Econ 10: 519-524. https://doi.org/10.1080/096031000416398 doi: 10.1080/096031000416398
|
| [41] | Szczygielski JJ, Chipeta C (2023) Properties of returns and variance and the implications for time series modelling: Evidence from south africa. Mod Financ 1: 35-55. Available from: https://mf-journal.com/index.php/mf/article/download/8/61. |
| [42] |
Tang TL, Shieh SJ (2006) Long memory in stock index futures markets: A value-at-risk approach. Physica A 366: 437-448. https://doi.org/10.1016/j.physa.2005.10.017 doi: 10.1016/j.physa.2005.10.017
|
| [43] |
Tayefi M, Ramanathan T (2012) An overview of figarch and related time series models. Austrian J Stat 41: 175-196. https://doi.org/10.17713/ajs.v41i3.172 doi: 10.17713/ajs.v41i3.172
|
| [44] |
Thupayagale P (2011) Long memory in the volatility of an emerging fixed-income market: Evidence from south africa. S Afr J Econ 79: 290-300. https://doi.org/10.1111/j.1813-6982.2011.01274.x doi: 10.1111/j.1813-6982.2011.01274.x
|
| [45] |
Tripathy N (2022) Long memory and volatility persistence across brics stock markets. Res Int Bus Financ 63: 101782. https://doi.org/10.1016/j.ribaf.2022.101782 doi: 10.1016/j.ribaf.2022.101782
|
| [46] | Tse YK (1998) The conditional heteroscedasticity of the yen-dollar exchange rate. J Appl Econometrics 13: 49-55. |
| [47] |
Wu PT, Shieh SJ (2007) Value-at-risk analysis for long-term interest rate futures: Fat-tail and long memory in return innovations. J Empir Financ 14: 248-259. https://doi.org/10.1016/j.jempfin.2006.02.001 doi: 10.1016/j.jempfin.2006.02.001
|
| [48] | Yaya OS (2013) Nigerian stock index: a search for optimal garch model using high frequency data', CBN J Appl Stat 4: 69-85. http://hdl.handle.net/10419/142079 |


Figures(3) / Tables(11)
Moses Khumalo, Hopolang Mashele, Modisane Seitshiro. Quantification of the stock market value at risk by using FIAPARCH, HYGARCH and FIGARCH models[J]. Data Science in Finance and Economics, 2023, 3(4): 380-400. doi: 10.3934/DSFE.2023022


 DownLoad: