Traditional laboratory microscopy for identifying bovine milk somatic cells is subjective, time-consuming, and labor-intensive. The accuracy of the recognition directly through a single classifier is low. In this paper, a novel algorithm that combined the feature extraction algorithm and fusion classification model was proposed to identify the somatic cells. First, 392 cell images from four types of bovine milk somatic cells dataset were trained and tested. Secondly, filtering and the K-means method were used to preprocess and segment the images. Thirdly, the color, morphological, and texture features of the four types of cells were extracted, totaling 100 features. Finally, the gradient boosting decision tree (GBDT)-AdaBoost fusion model was proposed. For the GBDT classifier, the light gradient boosting machine (LightGBM) was used as the weak classifier. The decision tree (DT) was used as the weak classifier of the AdaBoost classifier. The results showed that the average recognition accuracy of the GBDT-AdaBoost reached 98.0%. At the same time, that of random forest (RF), extremely randomized tree (ET), DT, and LightGBM was 79.9, 71.1, 67.3 and 77.2%, respectively. The recall rate of the GBDT-AdaBoost model was the best performance on all types of cells. The F1-Score of the GBDT-AdaBoost model was also better than the results of any single classifiers. The proposed algorithm can effectively recognize the image of bovine milk somatic cells. Moreover, it may provide a reference for recognizing bovine milk somatic cells with similar shape size characteristics and is difficult to distinguish.
Citation: Jie Bai, Heru Xue, Xinhua Jiang, Yanqing Zhou. Recognition of bovine milk somatic cells based on multi-feature extraction and a GBDT-AdaBoost fusion model[J]. Mathematical Biosciences and Engineering, 2022, 19(6): 5850-5866. doi: 10.3934/mbe.2022274
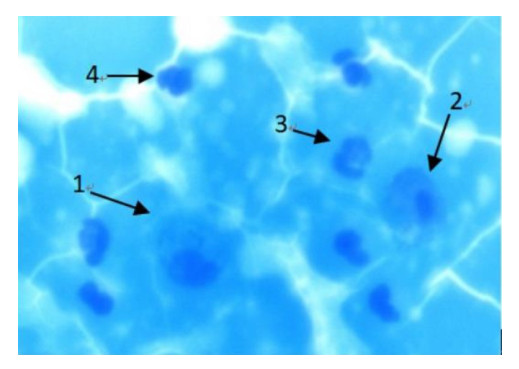
Traditional laboratory microscopy for identifying bovine milk somatic cells is subjective, time-consuming, and labor-intensive. The accuracy of the recognition directly through a single classifier is low. In this paper, a novel algorithm that combined the feature extraction algorithm and fusion classification model was proposed to identify the somatic cells. First, 392 cell images from four types of bovine milk somatic cells dataset were trained and tested. Secondly, filtering and the K-means method were used to preprocess and segment the images. Thirdly, the color, morphological, and texture features of the four types of cells were extracted, totaling 100 features. Finally, the gradient boosting decision tree (GBDT)-AdaBoost fusion model was proposed. For the GBDT classifier, the light gradient boosting machine (LightGBM) was used as the weak classifier. The decision tree (DT) was used as the weak classifier of the AdaBoost classifier. The results showed that the average recognition accuracy of the GBDT-AdaBoost reached 98.0%. At the same time, that of random forest (RF), extremely randomized tree (ET), DT, and LightGBM was 79.9, 71.1, 67.3 and 77.2%, respectively. The recall rate of the GBDT-AdaBoost model was the best performance on all types of cells. The F1-Score of the GBDT-AdaBoost model was also better than the results of any single classifiers. The proposed algorithm can effectively recognize the image of bovine milk somatic cells. Moreover, it may provide a reference for recognizing bovine milk somatic cells with similar shape size characteristics and is difficult to distinguish.

| [1] |
J. Y. Yang, C. Y. Niu, Y. Y. Liu, B. Q. Fu, J. Wang, Study on the necessity of somatic cell detection and measurement calibration of fresh milk, Biotechnol. Bull., 334 (2020), 21–26. https://doi.org/10.13560/j.cnki.biotech.bull.1985.2019-1121 doi: 10.13560/j.cnki.biotech.bull.1985.2019-1121

|
| [2] |
Y. C. Su, N. Zheng, S. L. Li, X. Y. Qu, X. W. Zhou, Research progress on the effect of somatic cell count in raw milk on milk quality and safety, Food Sci., 39 (2018), 299–305. https://doi.org/10.7506/spkx1002-6630-201823043 doi: 10.7506/spkx1002-6630-201823043
|
| [3] | J. X. Gao, Classification and recognition of polymorphic milk somatic cells based on feature fusion, J. Inn. Mong. Agric. Univ., 2018. |
| [4] | J. J. Yan, Y. Gao, F. Gao, Research progress of milk somatic cell count detection, Comput. Meas. Control., 2 (2016), 5–10. https://doi.org/0.16526/j.cnki.11-4762/tp.2016.02.002 |
| [5] |
J. C. Zhao, X. C. He, H. W. Gao, Research progress of milk somatic cell count detection methods, China Cattle, 13 (2014), 39–43. https://doi.org/10.3969/j.issn.1004-4264.2014.13.012 doi: 10.3969/j.issn.1004-4264.2014.13.012
|
| [6] | R. Nayar, D. Wilbur, D. Solomon, The bethesda system for reporting cervical cytology, in Acta Cytologica, (2008), 77–90. https://doi.org/10.1016/B978-141604208-2.10006-5 |
| [7] |
M. Wei, Y. Du, X. Wu, Q. Su, J. Zhu, L. Zheng, et al., A benign and malignant breast tumor classification method via efficiently combining texture and morphological features on ultrasound images, Comput. Math. Methods Med., 2020 (2020), 5894010. https://doi.org/10.1155/2020/5894010 doi: 10.1155/2020/5894010
|
| [8] | M. Habibzadeh, A. Krzyzak, T. Fevens, Comparative study of feature selection for white blood cell differential counts in low resolution images, Artif. Neural Networks Pattern Recognit., 2014. |
| [9] | A. Behura, The cluster analysis and feature selection: perspective of machine learning and image processing, Wiley, 2021. https://doi.org/10.1002/9781119785620.ch10 |
| [10] |
A. Bodzas, P. Kodytek, J. Zidek, Automated detection of acute lymphoblastic leukemia from microscopic images based on human visual perception, Front. Bioeng. Biotechnol., 8 (2020), 1005. https://doi.org/10.3389/fbioe.2020.01005 doi: 10.3389/fbioe.2020.01005
|
| [11] |
X. Gao, H. Xue, X. Pan, X. Jiang, Y. Zhou, X. Luo, Somatic cells recognition by application of gabor feature-based (2D)2PCA, Int. J. Pattern Recog. Artif. Intel., 31 (2017), 1757009. https://doi.org/10.1142/S0218001417570099 doi: 10.1142/S0218001417570099
|
| [12] |
X. Gao, H. Xue, X. Pan, X. Luo, Polymorphous bovine somatic cell recognition based on feature fusion, Int. J. Pattern Recog. Artif. Intel., 34 (2020), 2050032. https://doi.org/10.1142/S0218001420500329 doi: 10.1142/S0218001420500329
|
| [13] |
X. Gao, H. Xue, X. Jiang, Y. Zhou, Recognition of somatic cells in bovine milk using fusion feature, Int. J. Pattern Recog. Artif. Intel., 32 (2018), 1850021. https://doi.org/10.1142/S0218001418500210 doi: 10.1142/S0218001418500210
|
| [14] | X. Zhang, H. Xue, X. Gao, Y. Zhou, Milk somatic cells recognition based on multi-feature fusion and random forest, J. Inn. Mong. Agric. Univ., Nat. Sci. Ed., 2018. |
| [15] |
S. U. Khan, N. Islam, Z. Jan, K. Haseeb, S. Shah, M. Hanif, A machine learning-based approach for the segmentation and classification of malignant cells in breast cytology images using gray level co-occurrence matrix (GLCM) and support vector machine (SVM), Neural Comput. Appl., 2021 (2021), 1–8. https://doi.org/10.1007/s00521-021-05697-1 doi: 10.1007/s00521-021-05697-1
|
| [16] |
H. Gai, Y. Wang, L. Chan, B. Chiu, Identification of retinal ganglion cells from β-III stained fluorescent microscopic images, J. Digit. Imaging, 2 (2020), 1–12. https://doi.org/10.1007/s10278-020-00365-7 doi: 10.1007/s10278-020-00365-7
|
| [17] | J. Rawat, A. Singh, H. S. Bhadauria, J. Virmani, J. S. Devgun, Computer assisted classification framework for prediction of acute lymphoblastic and acute myeloblastic leukemia, Biocybern. Biomed. Eng., 37 (2017), 637–654. |
| [18] | V. Acharya, P. Kumar, Detection of acute lymphoblastic leukemia using image segmentation and data mining algorithms, Med. Biol. Eng. Comput., 57 (2019). https://doi.org/10.1007/s11517-019-01984-1 |
| [19] |
H. B. Kmen, A. Guvenis, H. Uysal, Predicting the polybromo-1 (PBRM1) mutation of a clear cell renal cell carcinoma using computed tomography images and KNN classification with random subspace, JVE J., 26 (2019), 30–34. https://doi.org/10.21595/vp.2019.20931 doi: 10.21595/vp.2019.20931
|
| [20] |
P. Mirmohammadi, M. Ameri, A. Shalbaf, Recognition of acute lymphoblastic leukemia and lymphocytes cell subtypes in microscopic images using random forest classifier, Phys. Eng. Sci. Med., 44 (2021), 433–441. https://doi.org/10.1007/s13246-021-00993-5 doi: 10.1007/s13246-021-00993-5
|
| [21] |
S. Mishra, B. Majhi, P. K. Sa, L. Sharma, Gray level co-occurrence matrix and random forest-based acute lymphoblastic leukemia detection, Biomed. Signal Process Control, 33 (2017), 272–280. https://doi.org/10.1016/j.bspc.2016.11.021 doi: 10.1016/j.bspc.2016.11.021
|
| [22] | N. Theera-Umpon, White blood cell segmentation and classification in microscopic bone marrow images, in Fuzzy Systems and Knowledge Discovery (eds. L. Wang, Y. Jin), Springer, (2005), 787–796. https://doi.org/10.1007/11540007_98 |
| [23] |
W. D. Lopes, D. Monte, C. Leon, J. Moura, C. Oliveira, Logistic regression model reveals major factors associated with total bacteria and somatic cell counts in goat bulk milk, Small Rumin. Res., 198 (2021), 106360. https://doi.org/10.1016/j.smallrumres.2021.106360 doi: 10.1016/j.smallrumres.2021.106360
|
| [24] |
L. W. Chen, X. P. Wu, C. Pan, Q. C. Hou, Application of extreme learning machine integration in bone marrow cell classification, Comput. Eng. Appl., 51 (2015), 136–139. https://doi.org/10.3778/j.issn.1002-8331.1303-0219 doi: 10.3778/j.issn.1002-8331.1303-0219
|
| [25] | A. X. He, B. Y. Wei, B. H. Zhang, B. T. Zhang, B. F. Yuan, B. Z. Huang, Grading of clear cell renal cell carcinomas by using machine learning based on artificial neural networks and radiomic signatures extracted from multidetector computed tomography images, Acad. Radiol., 27 (2020), 157–168. |
| [26] |
B. S. Divya, S. Kamalraj, H. R. Nanjundaswamy, Human epithelial type-2 cell image classification using an artificial neural network with hybrid descriptors, IETE J. Res., 2018 (2018), 1–12. https://doi.org/10.1080/03772063.2018.1474810 doi: 10.1080/03772063.2018.1474810
|
| [27] |
F. Lavitt, D. J. Rijlaarsdam, D. Linden, E. Weglarz-Tomczak, J. M. Tomczak, Deep learning and transfer learning for automatic cell counting in microscope images of human cancer cell lines, Appl. Sci., 11 (2021), 4912. https://doi.org/10.3390/app11114912 doi: 10.3390/app11114912
|
| [28] |
A. Kan, Machine learning applications in cell image analysis, Immunol. Cell Biol., 95 (2017), 525–530. https://doi.org/10.1038/icb.2017.16 doi: 10.1038/icb.2017.16
|
| [29] |
D. Kusumoto, S. Yuasa, The application of convolutional neural network to stem cell biology, Inflammat. Regen., 39 (2019), 14. https://doi.org/10.1186/s41232-019-0103-3 doi: 10.1186/s41232-019-0103-3
|
| [30] |
X. Dong, Z. Yu, W. Cao, A survey on ensemble learning, Front. Comput. Sci., 14 (2020), 241–258. https://doi.org/10.1007/s11704-019-8208-z doi: 10.1007/s11704-019-8208-z
|
| [31] | A. Andiojaya, H. Demirhan, A bagging algorithm for the imputation of missing values in time series, Expert Syst. Appl., 129 (2019), 10–26. |
| [32] |
Y. Hui, X. Mei, G. Jiang, T. Tao, Z. Ma, Milling tool wear state recognition by vibration signal using a stacked generalization ensemble model, Shock, 2019 (2019), 1–16. https://doi.org/10.1155/2019/7386523 doi: 10.1155/2019/7386523
|
| [33] | B. Wang, J. Pineau, Online bagging and boosting for imbalanced data streams, IEEE Trans. Knowl. Data Eng., 28 (2016), 3353–3366. |
| [34] |
W. Zhan, D. He, S. Shi, Recognition of kiwifruit in field based on Adaboost algorithm, Trans. Chin. Soc. Agric. Eng., 29 (2013), 140–146. https://doi.org/10.3969/j.issn.1002-6819.2013.23.019 doi: 10.3969/j.issn.1002-6819.2013.23.019
|
| [35] |
J. Cao, L. Chen, M. Wang, H. Shi, Y. Tian, A parallel adaboost-backpropagation neural network for massive image dataset classification, Sci. Rep., 6 (2016), 38201. https://doi.org/10.1038/srep38201 doi: 10.1038/srep38201
|
| [36] |
X. Wu, X. Lu, H. Leung, A video-based fire smoke detection using robust adaBoost, Sensors, 18 (2018), 3780. https://doi.org/10.3390/s18113780 doi: 10.3390/s18113780
|
| [37] |
Y. Wang, B. Zheng, M. Xu, S. Cai, J. Younseo, C. Zhang, et al., Prediction and analysis of hub genes in renal cell carcinoma based on CFS gene selection method combined with adaboost algorithm, Med. Chem., 16 (2020), 654–663. https://doi.org/10.2174/1573406415666191004100744 doi: 10.2174/1573406415666191004100744
|
| [38] |
J. Wang, Q. Zhou, A. Yin, Self-adaptive segmentation method of cotton in natural scene by combining improved Otsu with ELM algorithm, Trans. Chin. Soc. Agric. Eng., 341 (2018), 181–188. https://doi.org/10.11975/j.issn.1002-6819.2018.14.022 doi: 10.11975/j.issn.1002-6819.2018.14.022
|
| [39] |
S. H. Shirazi, A. I. Umar, S. Naz, M. I. Razzak, Efficient leukocyte segmentation and recognition in peripheral blood image, Technol. Health Care, 24 (2016), 335–347. https://doi.org/10.3233/THC-161133 doi: 10.3233/THC-161133
|
| [40] | X. F. Wang, D. S. Huang, J. X. Du, H. Xu., L. Heutte, Classification of plant leaf images with complicated background, Appl. Math. Comput., 205 (2008), 916–926. |
| [41] | Y. K. Zhuang, P. Zhou, Automatic classification of blood leukocytes based on multiple evidence, J. Zhejiang Sci. Tech. Univ., 30 (2013), 367–371. |
| [42] |
Q. Wu, Y. Gan, B. Lin, Q. Zhang, H. Chang, An active contour model based on fused texture features for image segmentation, Neurocomputing, 151 (2015), 133–1141. https://doi.org/10.1016/j.neucom.2014.04.085 doi: 10.1016/j.neucom.2014.04.085
|
| [43] |
T. Ojala, M. Pietikainen, D. Harwood, A comparative study of texture measures with classification based on feature distributions, Pattern Recognit., 29 (1996), 51–59. https://doi.org/10.1016/0031-3203(95)00067-4 doi: 10.1016/0031-3203(95)00067-4
|
| [44] |
H. Yang, J. Yin, M. Jiang, Perceptual image hashing using latent low-rank representation and uniform LBP, Appl. Sci., 8 (2018), 317. https://doi.org/10.3390/app8020317 doi: 10.3390/app8020317
|
| [45] | S. Lv, G. Liu, X. Bai, Multifeature pool importance fusion based GBDT (MPIF-GBDT) for short-term electricity load prediction, IOP Conf. Series EES, 702 (2021). |
| [46] | Y. X. Wang, Research on big data risk control model based on GBDT algorithm, J. Zhengzhou Inst. Aeronaut. Ind. Manag., 167 (2020), 110–114. |
| [47] | J. Techo, C. Nattee, T. Theeramunkong, Boosting-based ensemble learning with penalty profiles for automatic Thai unknown word recognition, Comput. Math. Appl., 63 (2012), 1117–1134. |
| [48] | D. Q. Han, T. X. Zhang, W. Shen, Lithology identification based on gradient lifting decision tree (GBDT) algorithm, Bull. Mineral. Petrol. Geochem., 37 (2018), 1173–1180. |
| [49] |
X. He, J. Pan, O. Jin, T. Xu, B. Liu, T. Xu, et al., Practical lessons from predicting clicks on ads at facebook, ACM, 2014 (2014). https://doi.org/10.1145/2648584.2648589 doi: 10.1145/2648584.2648589
|
| [50] | W. Xie, Q. Chai, Y. Gan, S. Chen, X. Zhang, W. Wang, Strains classification of anoectochilus roxburghii using multi-feature extraction and stacking ensemble learning, Trans. Chin. Soc. Agric. Eng., 36 (2020), 203–210. |


Figures(6) / Tables(5)

Jie Bai, Heru Xue, Xinhua Jiang, Yanqing Zhou. Recognition of bovine milk somatic cells based on multi-feature extraction and a GBDT-AdaBoost fusion model[J]. Mathematical Biosciences and Engineering, 2022, 19(6): 5850-5866. doi: 10.3934/mbe.2022274


 DownLoad: