With the continuous improvement of educational informatization, incorporating the performance evaluation of educational informatization into the overall framework of higher vocational education reform and innovation promotes the objective and practical direction of performance evaluation. This facilitates the transition of higher vocational education from scale-oriented development to intensive development and provides strategic support for method improvement and conceptual renewal in educational informatization.
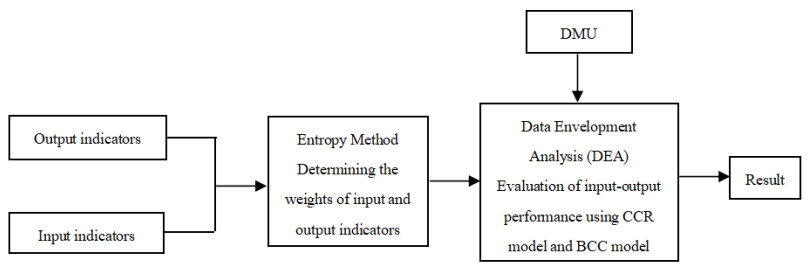
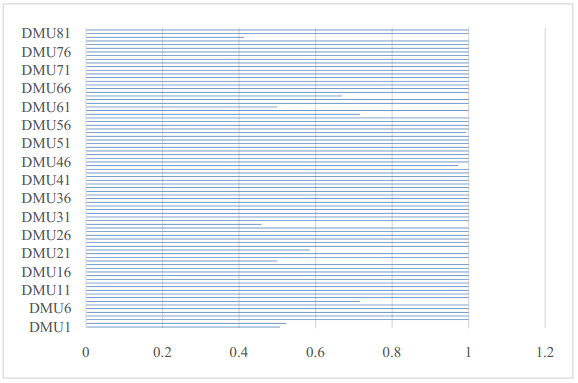
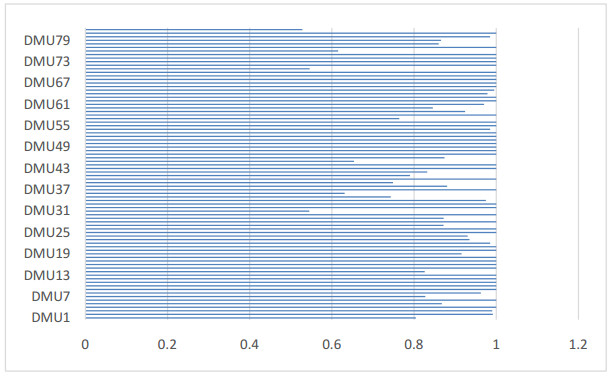
Based on this, we refer to the evaluation index system of information development level in colleges in Henan Province, Zhejiang Province and other regions. We use the entropy method to select performance evaluation indicators with a significant impact on higher vocational colleges. Combining the CCR and BCC models of the DEA method, the article evaluates the educational informatization performance of 82 higher vocational colleges in Henan Province. The informatization evaluation becomes more objective, improves the input-output ratio of informatization and provides directional guidance to avoid redundant construction.
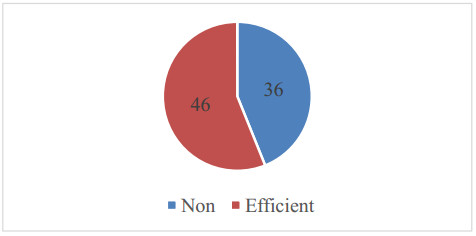
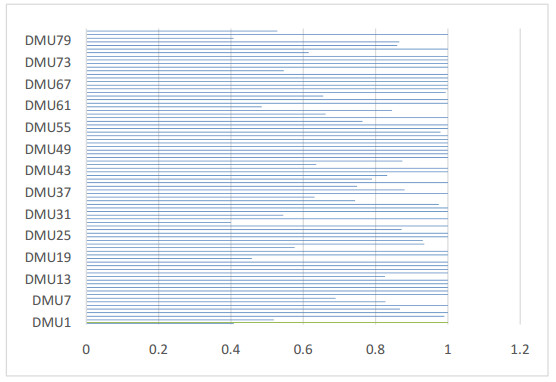
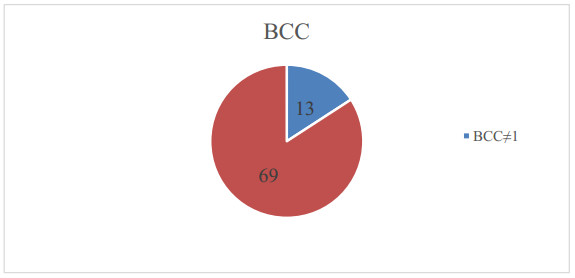
There are 46 DEA-effective decision-making units and 36 non-DEA-effective decision-making units among higher vocational colleges in Henan Province. The input-output ratio of the 36 non-DEA-effective higher vocational colleges has yet to reach an appropriate proportion, and further adjustments of input-output resources are needed based on projection values.
Citation: Qiuhui Ren, Thitinant Wareewanich. Research on performance evaluation of higher vocational education informatization based on data envelopment analysis[J]. STEM Education, 2023, 3(3): 230-250. doi: 10.3934/steme.2023014
With the continuous improvement of educational informatization, incorporating the performance evaluation of educational informatization into the overall framework of higher vocational education reform and innovation promotes the objective and practical direction of performance evaluation. This facilitates the transition of higher vocational education from scale-oriented development to intensive development and provides strategic support for method improvement and conceptual renewal in educational informatization.
Based on this, we refer to the evaluation index system of information development level in colleges in Henan Province, Zhejiang Province and other regions. We use the entropy method to select performance evaluation indicators with a significant impact on higher vocational colleges. Combining the CCR and BCC models of the DEA method, the article evaluates the educational informatization performance of 82 higher vocational colleges in Henan Province. The informatization evaluation becomes more objective, improves the input-output ratio of informatization and provides directional guidance to avoid redundant construction.
There are 46 DEA-effective decision-making units and 36 non-DEA-effective decision-making units among higher vocational colleges in Henan Province. The input-output ratio of the 36 non-DEA-effective higher vocational colleges has yet to reach an appropriate proportion, and further adjustments of input-output resources are needed based on projection values.

| [1] | China, General Office of the State Council of the People's Republic, China Education Modernization 2035, 2019. Available from: https://www.gov.cn/zhengce/2019-02/23/content_5367987.htm |
| [2] | China, Decision of the State Council on Accelerating the Development of Modern Vocational Education, 2014. Available from: https://www.gov.cn/zhengce/content/2014-06/22/content_8901.htm |
| [3] | China, Ministry of Education of the People's Republic, Guiding Opinions of the Ministry of Education on Further Promoting the Informationization Development of Vocational Education, 2017. Available from: http://www.moe.gov.cn/srcsite/A07/zcs_zhgg/201709/t20170911_314171.html |
| [4] |
Xuesong, Z., Yumeng Z., Ziwei Z., Huijun W. and Wenzhi C., Research on the Evaluation of Informatization Governance in Higher Education: Definition, Practice, and Retrospection. Open Education Research, 2021, 27(5): 24-33. https://doi.org/10.13966/j.cnki.kfjyyj.2021.05.003 doi: 10.13966/j.cnki.kfjyyj.2021.05.003

|
| [5] | Haowei, M., Study on Financial Expenditure Performance Evaluation of Higher Education in Henan Province, LIAONING UNIVERSITY, 2021. |
| [6] | Ulicna, D., Luomi-Messerer, K. and Auzinger, M., Study on Higher Vocational Education and Training in the EU, Publications Office of the European Union, 2016. |
| [7] |
Baartman, L., Gulikers J. Dijkstra, A., Factors Influencing Assessment Quality in Higher Vocational Education. Assessment & Evaluation in Higher Education, 2013, 38(8): 978-997. https://doi.org/10.1080/02602938.2013.771133 doi: 10.1080/02602938.2013.771133
|
| [8] |
Mengqin, L. and Xing, X., The Reconstruction of Talent Training Program in Higher Vocational Education under the Background of"Double-High Plan". Modern Education Management, 2020, 1: 107. https://doi.org/10.16697/j.1674-5485.2020.01.016 doi: 10.16697/j.1674-5485.2020.01.016
|
| [9] |
Brown, R., Evidence-Based Policy or Policy-Based Evidence Higher Education Policies and Policymaking 1987–2012. Perspectives: Policy and Practice in Higher Education, 2013, 17(4): 118-123. https://doi.org/10.1080/13603108.2013.830158 doi: 10.1080/13603108.2013.830158
|
| [10] |
Mann, K. and MacLeod, A., Constructivism: Learning Theories and Approaches to Research. Researching medical education, 2015, 49-66. https://doi.org/10.1002/9781118838983.ch6 doi: 10.1002/9781118838983.ch6
|
| [11] |
Sayaf, A.M., Adoption of E-Learning Systems: An Integration of ISSM and Constructivism Theories in Higher Education. Heliyon, 2023, 9(2). https://doi.org/10.1016/j.heliyon.2023.e13014 doi: 10.1016/j.heliyon.2023.e13014
|
| [12] | Kekang, H., The Objectives and Significance of Integrating Information Technology and Curriculum. EDUCATIONAL RESEARCH, 2002. |
| [13] | Kekang, H., Achieve "Deep Integration" of Information Technology and Education. Curriculum Textbooks Teaching Methods, 2014, 2. |
| [14] | Qian, Z., Sha, H., Liu, B. and Shurong K., New Features and Initiatives in Foreign Education Informatization. Foreign Primary and Secondary Education, 1999, 5: 5-8. |
| [15] |
Mushui, L., The Role of Information Technology in Vocational Education Teaching. Modern Business Trade Industry, 2017, 38(1): 140-41. https://doi.org/10.19311/j.cnki.1672-3198.2017.01.069 doi: 10.19311/j.cnki.1672-3198.2017.01.069
|
| [16] | Baode, H., Optimizing Policy Environment to Promote the Development of Vocational Education. China Adult Education, 2007, 15: 85-86. |
| [17] | Wenping, L., Exploration of Ideological Transformation and Teaching Methods in Vocational Education in the Information Age. Vocational Education Communication, 2016, 9: 36-40. |
| [18] | Wang, K., Research on the Performance Evaluation of Higher Education Based on Dea Model, 2018. |
| [19] | Lijun, S., Research on Performance Evaluation of Compulsory Education in D County Based on Dea Model, Guangxi University of Finance and Economics, 2022. |
| [20] | Sihua, Y., Optimization Strategies for Performance Evaluation of Special Funds in Local Higher Education Institutions: A Case Study of M College. Chinese Township Enterprise Accounting, 2023, 3: 94-96. |
| [21] |
Yazu, Y. and Yi L., Evaluating Educational Performance. Research on Digital Education, 2002, 9: 20-24. https://doi.org/10.13811/j.cnki.eer.2002.09.005 doi: 10.13811/j.cnki.eer.2002.09.005
|
| [22] | Xiyan, Z., Yueguang, J. and Song, G., People-Oriented: Value Orientation of Performance Evaluation for Informationization in Rural Basic Education. China Digital Education, 2014, 12: 55-58. |
| [23] | Xi, W., Research on Scientific Performance of Higher Vocational Colleges in Jiangsu Province, 2016. |
| [24] | Zhenqiong, H., Research on Performance Evaluation of Information Technology Teaching Resources. China Education Informatization: Higher Education and Vocational Education, 2010, 3: 27-30. |
| [25] |
Shuixing, H. and Jianping, Z., Cost-Benefit Analysis and Evaluation of Education Informatization in Colleges and Universities. Modern Distance Education Research, 2012, 3: 63-69. https://doi.org/10.3969/j.issn.1009-5195.2012.03.008 doi: 10.3969/j.issn.1009-5195.2012.03.008
|
| [26] |
Ghani, U., Xuesong, Z. and Ahmad, R., Mathematics Skills and Stem Multidisciplinary Literacy: Role of Learning Capacity. STEM Education, 2021, 1(2): 104-113. https://doi.org/10.3934/steme.2021008 doi: 10.3934/steme.2021008
|
| [27] |
Changyan, D., Qingguo, Z., Jun, S., Li, L., Rui, Z. and Jiayin, L., Innovation Event Model for Stem Education: A Constructivism Perspective. STEM Education, 2021, 1(1): 60-74. https://doi.org/10.3934/steme.2021005 doi: 10.3934/steme.2021005
|
| [28] |
Di, W., Xiaorong, W., Chun, L., and Yinghui, S., Research on the Indicator System of the Development of Education Informatization. Open Education Research, 2014, 20(1): 92-99. https://doi.org/10.13966/j.cnki.kfjyyj.2014.01.006 doi: 10.13966/j.cnki.kfjyyj.2014.01.006
|
| [29] | Nailong, W., The Maximum Entropy Method, Springer Science & Business Media, 2012. |
| [30] |
Fahim, A., Tan, Q., Zaz, B., Ain, Q.U. and Bazai, S.U., Sustainable Higher Education Reform Quality Assessment Using Swot Analysis with Integration of Ahp and Entropy Models: A Case Study of Morocco. Sustainability, 2021, 13(8): 4312. https://doi.org/10.3390/su13084312 doi: 10.3390/su13084312
|
| [31] | Dan, M., Appraisal on the Efficiency of Higher Education Resource Allocation by Entropy Method. MEITAN HIGHER EDUCATION, 2008, 6(5): 37-40. |
| [32] |
Wang, X., Zheng, Z. and Li, X., Optimization and Empirical Analysis of Performance Evaluation System for University Scientific Research: A Case Study of 19 Universities in Fujian Province. CHINESE UNIVERSITY SCIENCE & TECHNOLOGY, 2017, 11: 68-71. https://doi.org/10.16209/j.cnki.cust.2017.11.022 doi: 10.16209/j.cnki.cust.2017.11.022
|
| [33] | Weiming, L., The Evaluation Model and Its Application of Advanced Education Input -Output Based on Entropy Method. Science and Education Journal, 2011, 23: 143-144. |
| [34] | Yingxing, C., DI, F. and Yue, Z., Undergraduate Education Quality Evaluation Based on Extreme Value-Entropy Method: A Case Study of Jiangsu Province. Curriculum Education Research, 2020, 24: 119-121. |
| [35] |
Bougnol, M.L. and Dulá, J.H., Validating Dea as a Ranking Tool: An Application of Dea to Assess Performance in Higher Education. Annals of Operations Research, 2006,145: 339-365. https://doi.org/10.1007/s10479-006-0039-2 doi: 10.1007/s10479-006-0039-2
|
| [36] |
Wu, J. and Liang, L., A Dea Model for Identifying Critical Input-Output Performance Measures. Journal of Systems Science and Complexity, 2012, 25(2): 275-286. https://doi.org/10.1007/s11424-012-9221-6 doi: 10.1007/s11424-012-9221-6
|
| [37] | Congcong, S., Research on Efficiency Evaluation of University Informatization Governance Based on Entropy Weight Method and Data Envelopment Analysis, Anhui Jianzhu University, 2022. |
| [38] |
Hui, L., Sukpasjaroen, K., Zhai, X. and Campus, Z., Investigating the Effect of University Enterprise Collaboration on Individual Innovation in Underdeveloped Regions. STEM Education, 2023, 3(3): 148-170. https://doi.org/10.3934/steme.2023010 doi: 10.3934/steme.2023010
|
| [39] |
Cai, R. and Chiang, F.K., A Laser-Cutting-Centered Stem Course for Improving Engineering Problem-Solving Skills of High College Students in China. STEM Education, 2021, 1(3): 199-224. https://doi.org/10.3934/steme.2021015 doi: 10.3934/steme.2021015
|
Figures(7) / Tables(3)
Qiuhui Ren, Thitinant Wareewanich. Research on performance evaluation of higher vocational education informatization based on data envelopment analysis[J]. STEM Education, 2023, 3(3): 230-250. doi: 10.3934/steme.2023014


 DownLoad: