This study presents an analysis of M. tuberculosis growth data obtained using the BACTEC MGIT 960 system and respective mathematical models. The system is based on the detection of a decrease in oxygen level in the broth due to the bacterial respiration. It is shown that recordings sampled with a 1 hour rate provide an opportunity to distinguish between the oxygen consumption of growing cells and active cells division when the density of micro-organisms is sufficient to enter into the synchronized division mode. More specifically, the growth of culture is continuous only with large initial dilutions; otherwise, there are jumps between different growth stages with a time interval of 13–15 h. The combination of the oxygen-quenching kinetics for an analytic reagent and the population growth kinetics resulted in a mathematical model, which consists of mixing Verhulst's and Gompertz's models. The parameters of such mixing and switching between the models' prevalences are discussed with respect to oxygen uptake reactions reflected in the changes in the experimentally registered fluorescence level.
Citation: Anastasia I. Lavrova, Marine Z. Dogonadze, Alexander V. Sychev, Olga A. Manicheva, Eugene B. Postnikov. Ensemble density-dependent synchronization of mycobacterial growth: BACTEC MGIT 960 fluorescence-based analysis and mathematical modelling of coupled biophysical and chemical processes[J]. AIMS Microbiology, 2022, 8(2): 208-225. doi: 10.3934/microbiol.2022017
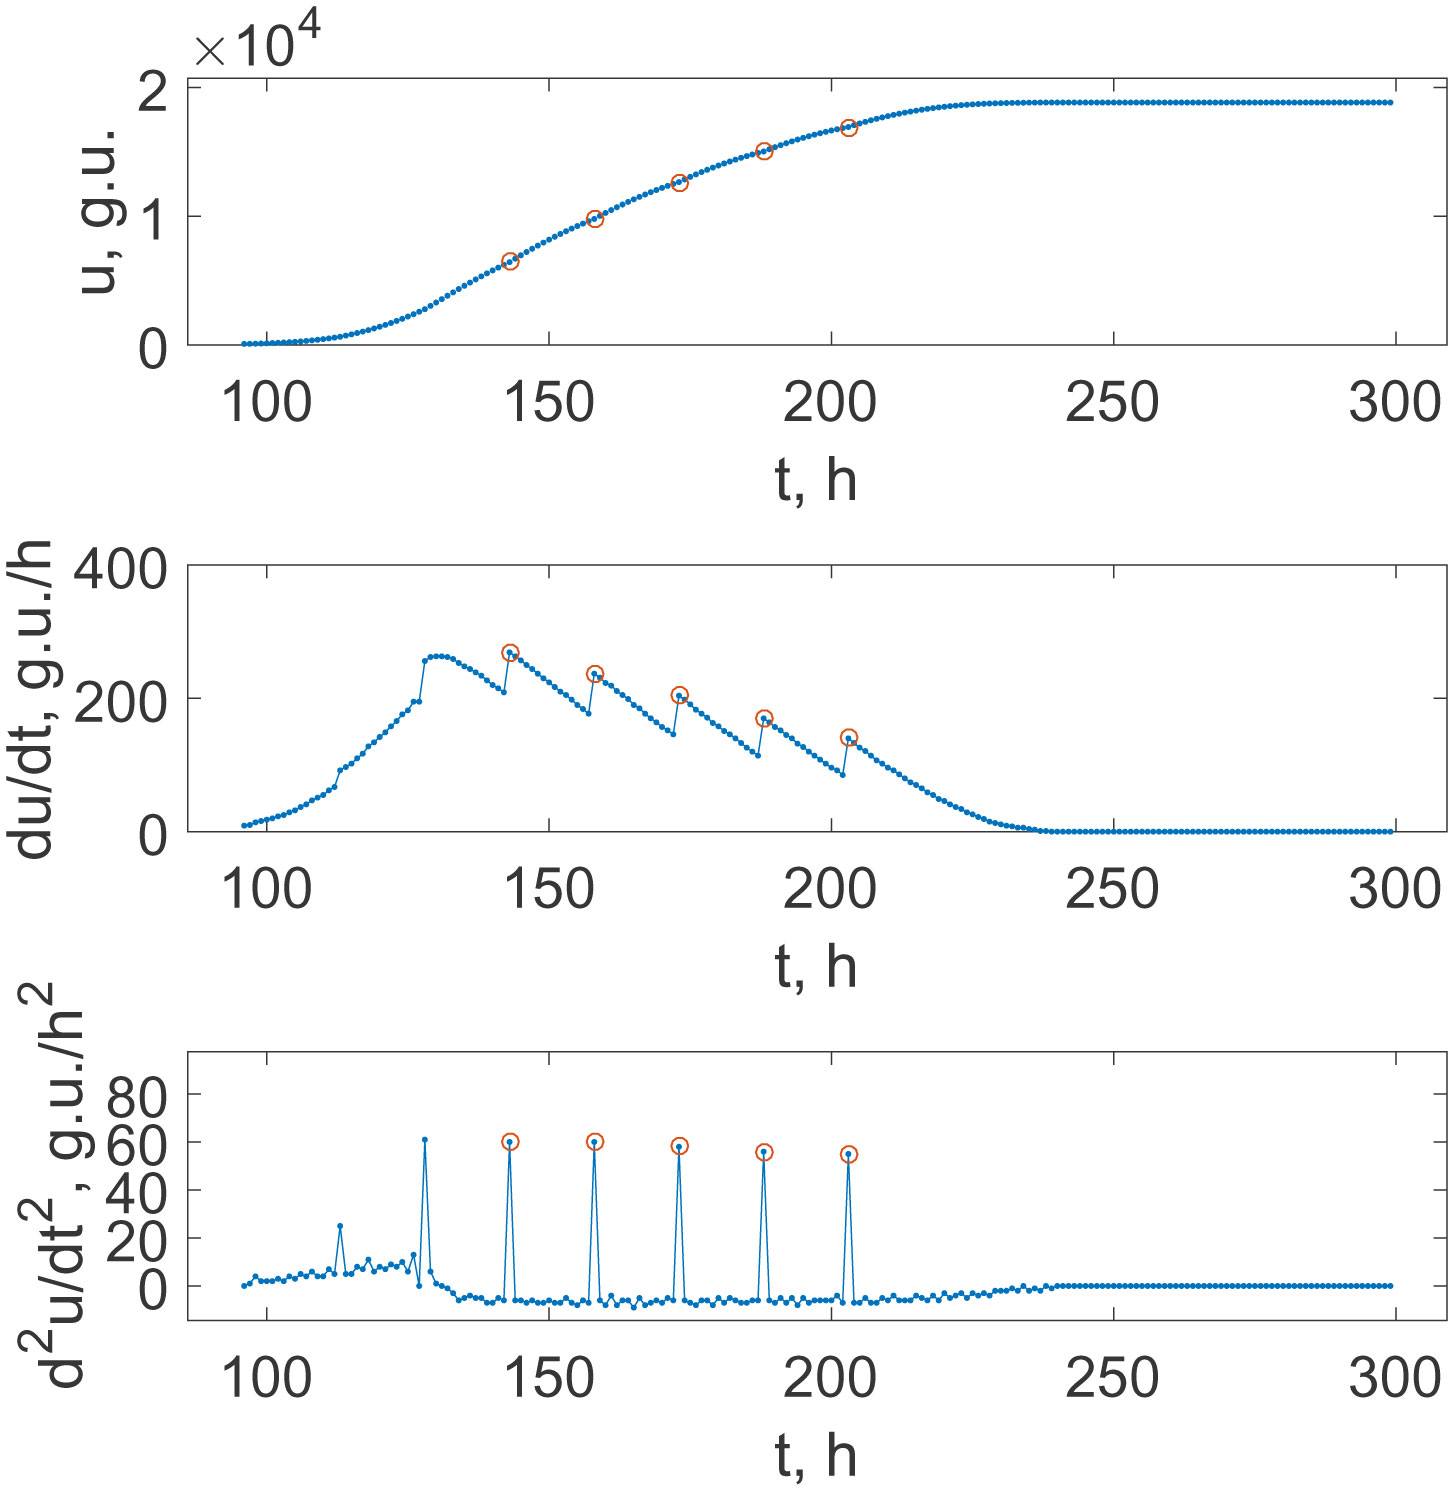
This study presents an analysis of M. tuberculosis growth data obtained using the BACTEC MGIT 960 system and respective mathematical models. The system is based on the detection of a decrease in oxygen level in the broth due to the bacterial respiration. It is shown that recordings sampled with a 1 hour rate provide an opportunity to distinguish between the oxygen consumption of growing cells and active cells division when the density of micro-organisms is sufficient to enter into the synchronized division mode. More specifically, the growth of culture is continuous only with large initial dilutions; otherwise, there are jumps between different growth stages with a time interval of 13–15 h. The combination of the oxygen-quenching kinetics for an analytic reagent and the population growth kinetics resulted in a mathematical model, which consists of mixing Verhulst's and Gompertz's models. The parameters of such mixing and switching between the models' prevalences are discussed with respect to oxygen uptake reactions reflected in the changes in the experimentally registered fluorescence level.

| [1] |
Shin DJ, Andini N, Hsieh K, et al. (2019) Emerging analytical techniques for rapid pathogen identification and susceptibility testing. Annu Rev Anal Chem 12: 41-67. https://doi.org/10.1146/annurev-anchem-061318-115529 
|
| [2] |
van Belkum A, Burnham CAD, Rossen JWA, et al. (2020) Innovative and rapid antimicrobial susceptibility testing systems. Nat Rev Microbiol 18: 299-311. https://doi.org/10.1038/s41579-020-0327-x
|
| [3] |
Deepa N, Ganesh AB (2017) Minimally invasive fluorescence sensing system for real-time monitoring of bacterial cell cultivation. Instrum Sci Technol 45: 85-100. https://doi.org/10.1080/10739149.2016.1198372
|
| [4] |
Gruber P, Marques MPC, Szita N, et al. (2017) Integration and application of optical chemical sensors in microbioreactors. Lab on a Chip 17: 2693-2712. https://doi.org/10.1039/C7LC00538E
|
| [5] |
Ayyash S, Wu WI, Selvaganapathy PR (2016) Fast and inexpensive detection of bacterial viability and drug effectiveness through metabolic monitoring. Sensors 16: 1879. https://doi.org/10.3390/s16111879
|
| [6] |
Greig ME, Hoogerheide JC (1941) The correlation of bacterial growth with oxygen consumption. J Bacteriol 41: 549-556. https://doi.org/10.1128/jb.41.5.549-556.1941
|
| [7] |
Zhang ZT, Wang DB, Li CY, et al. (2018) Microbial sensor for drug susceptibility testing of Mycobacterium tuberculosis. J Appl Microbiol 124: 286-293. https://doi.org/10.1111/jam.13617
|
| [8] |
Neijssel OM, de Mattos MJT (1994) The energetics of bacterial growth: a reassessment. Mole Microbiol 13: 179-182. https://doi.org/10.1111/j.1365-2958.1994.tb00413.x
|
| [9] | Kowles CJ (2018) Diversity of Bacterial Respiratory Systems: Volume 1. CRC Press. https://doi.org/10.1201/9781351071505 |
| [10] |
Quaranta M, Borisov SM, Klimant I (2012) Indicators for optical oxygen sensors. Bioanal Rev 4: 115-157. https://doi.org/10.1007/s12566-012-0032-y
|
| [11] |
Papkovsky DB, Dmitriev RI (2013) Biological detection by optical oxygen sensing. Chemi Soci Rev 42: 8700-8732. https://doi.org/10.1039/c3cs60131e
|
| [12] |
Demas JN, DeGraff BA, Coleman PB (1999) Oxygen Sensors Based on Luminescence Quenching. Anal Chem 71: 793A-800A. https://doi.org/10.1021/ac9908546
|
| [13] |
Kanchana MV, Cheke D, Natyshak I, et al. (2000) Evaluation of the BACTEC MGIT 960 system for the recovery of mycobacteria. Diagn Microbiol Infect Dis 37: 31-36. https://doi.org/10.1016/S0732-8893(99)00151-0
|
| [14] |
Ardito F, Posteraro B, Sanguinetti M, et al. (2001) Evaluation of BACTEC mycobacteria growth indicator tube (MGIT 960) automated system for drug susceptibility testing ofMycobacterium tuberculosis. J Clin Microbiol 39: 4440-4444. https://doi.org/10.1128/JCM.39.12.4440-4444.2001
|
| [15] |
Cruciani M, Scarparo C, Malena M, et al. (2004) Meta-analysis of BACTEC MGIT 960 and BACTEC 460 TB, with or without solid media, for detection of mycobacteria. J Clin Microbiol 42: 2321-2325. https://doi.org/10.1128/JCM.42.5.2321-2325.2004
|
| [16] |
Shin SJ, Han JH, Manning EJB, et al. (2007) Rapid and reliable method for quantification of Mycobacterium paratuberculosis by use of the BACTEC MGIT 960 system. J Clin Microbiol 45: 1941-1948. https://doi.org/10.1128/JCM.02616-06
|
| [17] | Zelmer A, Tanner R, Stylianou E, et al. (2015) Ex vivo mycobacterial growth inhibition assay (MGIA) for tuberculosis vaccine testing-a protocol for mouse splenocytes. BioRxiv 020560. |
| [18] |
Campbell A (1957) Synchronization of cell division. Bacteriol Rev 21: 263-272. https://doi.org/10.1128/br.21.4.263-272.1957
|
| [19] |
Wayne LG (1977) Synchronized replication of mycobacterium tuberculosis. Infect Immun 17: 528-530. https://doi.org/10.1128/iai.17.3.528-530.1977
|
| [20] |
Aldridge BB, Fernandez-Suarez M, Heller D, et al. (2012) Asymmetry and aging of mycobacterial cells lead to variable growth and antibiotic susceptibility. Science 335: 100-104. https://doi.org/10.1126/science.1216166
|
| [21] |
James BW, Williams A, Marsh PD (2000) The physiology and pathogenicity of Mycobacterium tuberculosis grown under controlled conditions in a defined medium. J Appl Microbiol 88: 669-677. https://doi.org/10.1046/j.1365-2672.2000.01020.x
|
| [22] |
Hartmann P, Leiner MJP, Lippitsch ME (1995) Luminescence quenching behavior of an oxygen sensor based on a Ru (II) complex dissolved in polystyrene. Anal Chem 67: 88-93. https://doi.org/10.1021/ac00097a015
|
| [23] |
Wang Xd, Wolfbeis OS (2014) Optical methods for sensing and imaging oxygen: materials, spectroscopies and applications. Chem Soc Rev 43: 3666-3761. https://doi.org/10.1039/C4CS00039K
|
| [24] | Siddiqi S, Rusch-Gerdes S (2006) MGIT procedure manual for BACTEC MGIT 960 TB system (also applicable for manual MGIT). Franklin Lakes, NJ: Becton, Dickinson. |
| [25] | Stinson KW, Kayes S, Matsumoto M, et al. (2014) Mycobacteriology Laboratory Manual. Otsuka. |
| [26] |
Collins LA, Franzblau SG (1997) Microplate alamar blue assay versus BACTEC 460 system for high-throughput screening of compounds against Mycobacterium tuberculosis and Mycobacterium avium. Antimicrob Agents Chemother 41: 1004-1009. https://doi.org/10.1128/AAC.41.5.1004
|
| [27] |
von Groll A, Martin A, Portaels F, et al. (2010) Growth kinetics of Mycobacterium tuberculosis measured by quantitative resazurin reduction assay: a tool for fitness studies. Braz J Microbiol 41: 300-303. https://doi.org/10.1590/S1517-83822010000200006
|
| [28] | Sychev AV, Belenkov RN, Ukolov DN, et al. (2022) Revealing kinetics of chemical transitions in colorimetric indicators of microorganisms growth based on photometric data from a portable microbiological analyser. Proc SPIE 12194: 121940Z. https://doi.org/10.1117/12.2625794 |
| [29] |
Grebenkov DS, Metzler R, Oshanin G (2018) Strong defocusing of molecular reaction times results from an interplay of geometry and reaction control. Commun Chem 1: 1-12. https://doi.org/10.1038/s42004-018-0096-x
|
| [30] |
Nair N, Dziedzic R, Greendyke R, et al. (2009) Synchronous replication initiation in novel Mycobacterium tuberculosis dnaA cold-sensitive mutants. Mol Microbiol 71: 291-304. https://doi.org/10.1111/j.1365-2958.2008.06523.x
|
| [31] |
Zwietering MH, Jongenburger I, Rombouts FM, et al. (1990) Modeling of the bacterial growth curve. Appl Environ Microbiol 56: 1875-1881. https://doi.org/10.1128/aem.56.6.1875-1881.1990
|
| [32] |
Anguelov R, Borisov M, Iliev A, et al. (2018) On the chemical meaning of some growth models possessing Gompertzian-type property. Math Methods Appl Sci 41: 8365-8376. https://doi.org/10.1002/mma.4539
|
| [33] |
Peleg M, Corradini MG (2011) Microbial growth curves: what the models tell us and what they cannot. Crit Rev Food Sci Nutr 51: 917-945. https://doi.org/10.1080/10408398.2011.570463
|
| [34] |
Rubinow SI (1968) A maturity-time representation for cell populations. Biophys J 8: 1055-1073. https://doi.org/10.1016/S0006-3495(68)86539-7
|
| [35] |
Frenzen CL, Murray JD (1986) A cell kinetics justification for Gompertz' equation. SIAM J Appl Math 46: 614-629. https://doi.org/10.1137/0146042
|
| [36] |
Yamano T (2009) Statistical ensemble theory of Gompertz growth model. Entropy 11: 807-819. https://doi.org/10.3390/e11040807
|
| [37] |
De Lauro E, De Martino S, De Siena S, et al. (2014) Stochastic roots of growth phenomena. Physica A 401: 207-213. https://doi.org/10.1016/j.physa.2013.12.051
|
| [38] |
Khalin AA, Postnikov EB, Ryabov AB (2018) Stochastic effects in mean-field population growth: The quasi-Gaussian approximation to the case of a Taylor's law-distributed substrate. Physica A 511: 166-173. https://doi.org/10.1016/j.physa.2018.07.052
|


Figures(7) / Tables(1)

Anastasia I. Lavrova, Marine Z. Dogonadze, Alexander V. Sychev, Olga A. Manicheva, Eugene B. Postnikov. Ensemble density-dependent synchronization of mycobacterial growth: BACTEC MGIT 960 fluorescence-based analysis and mathematical modelling of coupled biophysical and chemical processes[J]. AIMS Microbiology, 2022, 8(2): 208-225. doi: 10.3934/microbiol.2022017


 DownLoad: