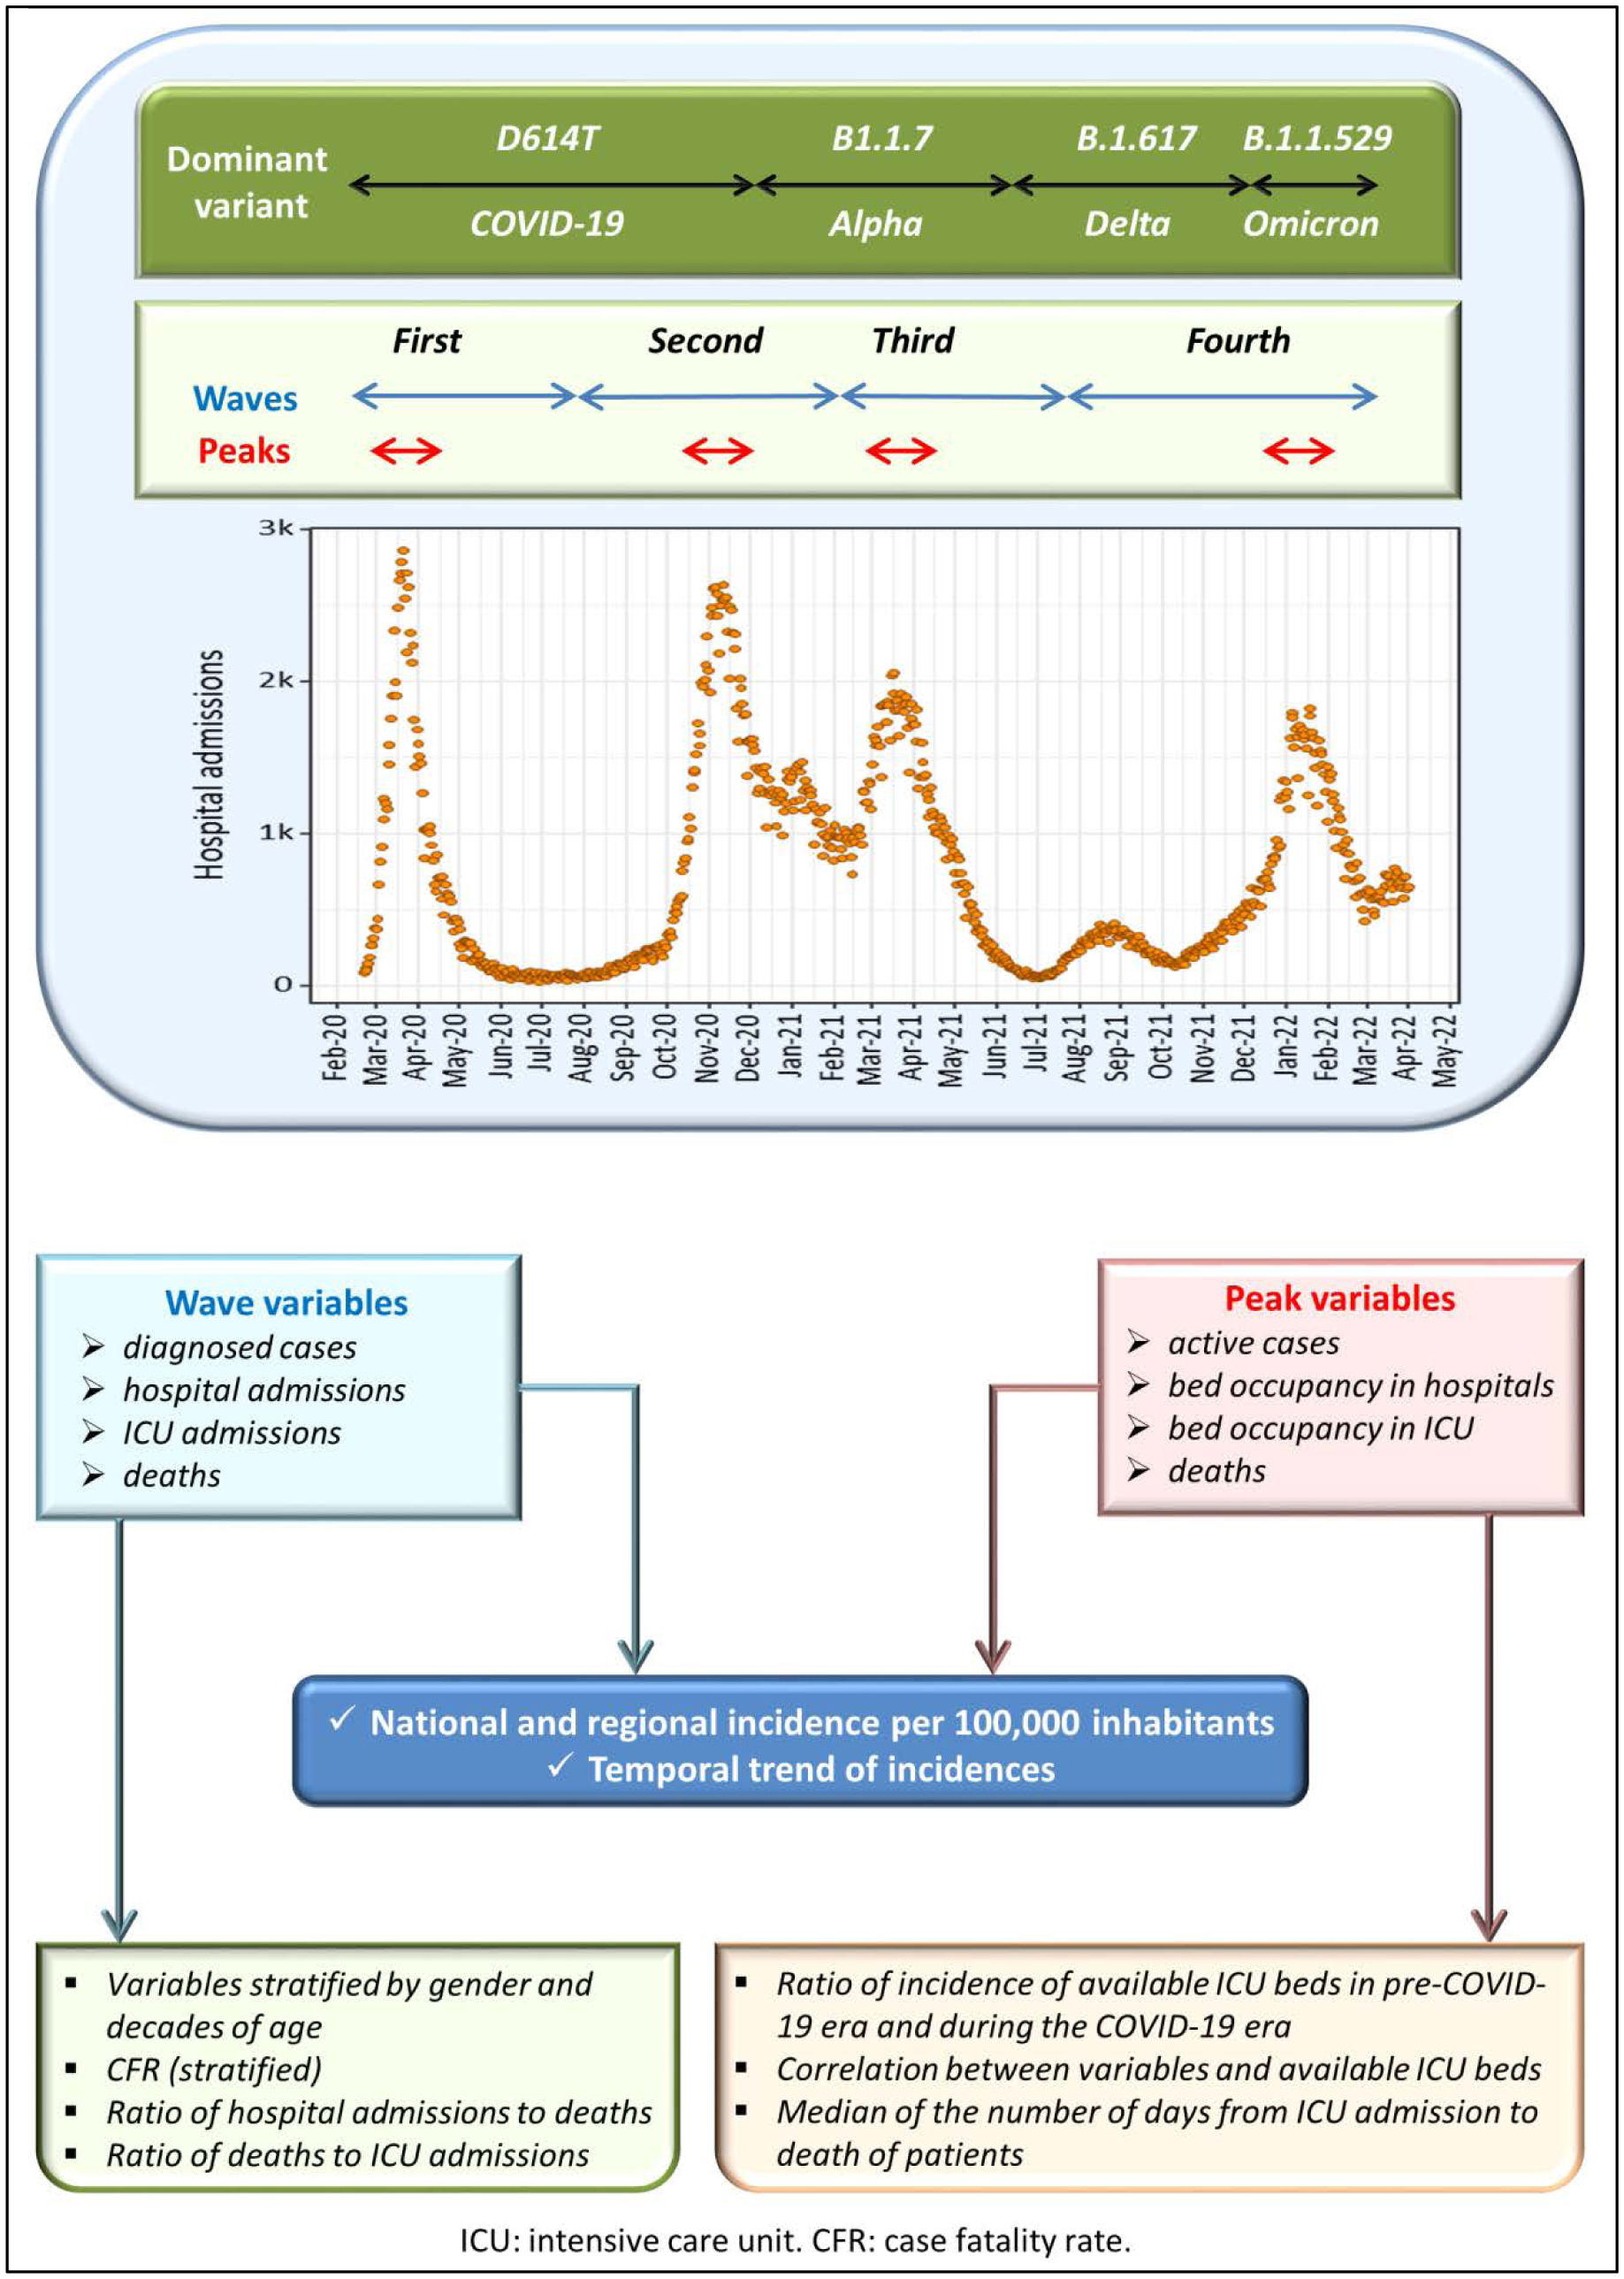
The COVID-19 pandemic initially hit Italy at the end of February 2020. In the following two years, there were about 13 million diagnosed cases and more than 150000 deaths. For this period, we have performed a study that evaluates and compares the impacts on public health of the SARS-CoV-2 waves at the national and regional levels. Based on contagion trends, we considered four pandemic waves. For each wave, we also analyzed a restricted time interval of one month around the peak. We found an underestimation of diagnosed cases and a saturation of available intensive care unit (ICU) beds during the first wave. The second wave had a more significant impact on public health, highlighting that the system of physical distancing measures was less effective than the lockdown implemented during the first wave. Instead, during the first three peaks, the incidence of ICU bed occupancy was superimposable. In general, odds ratios of case fatality rate showed a more significant risk for males than females from the age of thirty onwards. We verified that regional responses to the health emergency were not homogeneous. In particular, in contrast with the national temporal trend, some regions showed a significant increase in the incidence of deaths. Furthermore, we found positive correlations between availability and occupancy of hospital beds from the second wave onward. In contrast, a significant correlation was verified for ICU bed occupancy and deaths only during the second peak. In light of what happened, it would be desirable to plan an increase in public health funds for new emergencies and issue a rigorous plan to face pandemics.
Citation: Rosario Megna. Evolution of the COVID-19 pandemic in Italy at the national and regional levels from February 2020 to March 2022[J]. AIMS Medical Science, 2023, 10(3): 237-258. doi: 10.3934/medsci.2023019
The COVID-19 pandemic initially hit Italy at the end of February 2020. In the following two years, there were about 13 million diagnosed cases and more than 150000 deaths. For this period, we have performed a study that evaluates and compares the impacts on public health of the SARS-CoV-2 waves at the national and regional levels. Based on contagion trends, we considered four pandemic waves. For each wave, we also analyzed a restricted time interval of one month around the peak. We found an underestimation of diagnosed cases and a saturation of available intensive care unit (ICU) beds during the first wave. The second wave had a more significant impact on public health, highlighting that the system of physical distancing measures was less effective than the lockdown implemented during the first wave. Instead, during the first three peaks, the incidence of ICU bed occupancy was superimposable. In general, odds ratios of case fatality rate showed a more significant risk for males than females from the age of thirty onwards. We verified that regional responses to the health emergency were not homogeneous. In particular, in contrast with the national temporal trend, some regions showed a significant increase in the incidence of deaths. Furthermore, we found positive correlations between availability and occupancy of hospital beds from the second wave onward. In contrast, a significant correlation was verified for ICU bed occupancy and deaths only during the second peak. In light of what happened, it would be desirable to plan an increase in public health funds for new emergencies and issue a rigorous plan to face pandemics.

| [1] |
Remuzzi A, Remuzzi G (2020) COVID-19 and Italy: what next?. Lancet 395: 1225-1228. https://doi.org/10.1016/S0140-6736(20)30627-9 
|
| [2] |
Boccia S, Ricciardi W, Ioannidis JPA (2020) What other countries can learn from Italy during the COVID-19 pandemic. JAMA Intern Med 180: 927-928. https://doi.org/10.1001/jamainternmed.2020.1447
|
| [3] |
Graffigna G, Palamenghi L, Savarese M, et al. (2021) Effects of the COVID-19 emergency and national lockdown on Italian citizens' economic concerns, government trust, and health engagement: evidence from a two-wave panel study. Milbank Q 99: 369-392. https://doi.org/10.1111/1468-0009.12506
|
| [4] |
Inama M, Casaril A, Alberti L, et al. (2021) Reduction of the emergency activity, during the Covid 19 Italian lockdown, what's the lesson to learn?. Health Policy 125: 1173-1178. https://doi.org/10.1016/j.healthpol.2021.07.013
|
| [5] |
Megna R (2020) First month of the epidemic caused by COVID-19 in Italy: current status and real-time outbreak development forecast. Glob Health Res Policy 5: 43. https://doi.org/10.1186/s41256-020-00170-3
|
| [6] |
Gianicolo EAL, Russo A, Büchler B, et al. (2021) Gender specific excess mortality in Italy during the COVID-19 pandemic accounting for age. Eur J Epidemiol 36: 213-218. https://doi.org/10.1007/s10654-021-00717-9
|
| [7] |
Megna R (2021) Inferring a cause-effect relationship between lockdown restrictions and COVID-19 pandemic trend during the first wave. Health Policy 125: 1441-1447. https://doi.org/10.1016/j.healthpol.2021.09.008
|
| [8] |
Manica M, Guzzetta G, Riccardo F, et al. (2021) Impact of tiered restrictions on human activities and the epidemiology of the second wave of COVID-19 in Italy. Nat Commun 12: 4570. https://doi.org/10.1038/s41467-021-24832-z
|
| [9] |
Pelagatti M, Maranzano P (2021) Assessing the effectiveness of the Italian risk-zones policy during the second wave of COVID-19. Health Policy 125: 1188-1199. https://doi.org/10.1016/j.healthpol.2021.07.011
|
| [10] |
Korber B, Fischer WM, Gnanakaran S, et al. (2020) Tracking changes in SARS-CoV-2 spike: evidence that D614G increases infectivity of the COVID-19 virus. Cell 182: 812-827.e19. https://doi.org/10.1016/j.cell.2020.06.043
|
| [11] |
Cochin M, Luciani L, Touret F, et al. (2022) The SARS-CoV-2 Alpha variant exhibits comparable fitness to the D614G strain in a Syrian hamster model. Commun Biol 5: 225. https://doi.org/10.1038/s42003-022-03171-9
|
| [12] | Ministry of Health. Law decree of the President of the Council of Ministers of 2 March 2021. Italy Ministry of Health (2022) . Available from: https://www.salute.gov.it/portale/nuovocoronavirus/dettaglioContenutiNuovoCoronavirus.jsp?lingua=english&id=5367&area=nuovoCoronavirus&menu=vuoto (Accessed 27 February 2023) (In Italian) |
| [13] | National Institute of Health. COVID 19 Epidemic, Risk Monitoring, February 18, 2022. Italy National Institute of Health (2022) . Available from: https://www.iss.it/en/grafici-settimanali (Last access on 28 February 2023) (In Italian) |
| [14] | Word Health Organization. Update on Omicron. Word Health Organization (2021) . Available from: https://www.who.int/news/item/28-11-2021-update-on-omicron (Last access on 2 March 2023) |
| [15] |
Suzuki R, Yamasoba D, Kimura I, et al. (2022) Attenuated fusogenicity and pathogenicity of SARS-CoV-2 Omicron variant. Nature 603: 700-705. https://doi.org/10.1038/s41586-022-04462-1
|
| [16] | National Institute of Health. Covid-19 vaccination plan. Italy National Institute of Health (2021) . Available from: https://www.epicentro.iss.it/en/vaccines/covid-19-vaccination-plan (Last access on 6 March 2023) (In Italian) |
| [17] |
Polack FP, Thomas SJ, Kitchin N, et al. (2020) Safety and efficacy of the BNT162b2 mRNA Covid-19 vaccine. N Engl J Med 383: 2603-2615. https://doi.org/10.1056/NEJMoa2034577
|
| [18] |
Baden LR, El Sahly HM, Essink B, et al. (2021) Efficacy and safety of the mRNA-1273 SARS-CoV-2 vaccine. N Engl J Med 384: 403-416. https://doi.org/10.1056/NEJMoa2035389
|
| [19] |
Ramasamy MN, Minassian AM, Ewer KJ, et al. (2021) Safety and immunogenicity of ChAdOx1 nCoV-19 vaccine administered in a prime-boost regimen in young and old adults (COV002): A single-blind, randomised, controlled, phase 2/3 trial. Lancet 396: 1979-1993. https://doi.org/10.1016/S0140-6736(20)32466-1
|
| [20] |
Sadoff J, Le Gars M, Shukarev G, et al. (2021) Interim results of a phase 1–2a trial of Ad26.COV2.S Covid-19 vaccine. N Engl J Med 384: 1824-1835. https://doi.org/10.1056/NEJMoa2034201
|
| [21] | Italian Ministry of Health. Extension of the indication for using the Comirnaty (BioNTech/Pfizer) vaccine for the 5–11 year age group. Italy Ministry of Health (2021) . Available from: https://www.trovanorme.salute.gov.it/norme/renderNormsanPdf?anno=2021&codLeg=84353&parte=1%20&serie=null (Last access on 15 March 2023) (In Italian) |
| [22] | Italian Ministry of Health. Updated recommendations on the vaccination of people previously infected with SARS-CoV-2. Italy Ministry of Health (2021) . Available from: https://www.trovanorme.salute.gov.it/norme/renderNormsanPdf?anno=2021&codLeg=81774&parte=1%20&serie=null (Assessed 15 March 2023) (In Italian) |
| [23] |
Stefanizzi P, Bianchi FP, Brescia N, et al. (2022) Vaccination strategies between compulsion and incentives. The Italian green pass experience. Expert Rev Vaccines 21: 423-425. https://doi.org/10.1080/14760584.2022.2023012
|
| [24] |
Thomas SJ, Moreira ED, Kitchin N, et al. (2021) Safety and efficacy of the BNT162b2 mRNA Covid-19 vaccine through 6 months. N Engl J Med 385: 1761-1773. https://doi.org/10.1056/NEJMoa2110345
|
| [25] |
Khoury J, Najjar-Debbiny R, Hanna A, et al. (2021) COVID-19 vaccine—Long term immune decline and breakthrough infections. Vaccine 39: 6984-6989. https://doi.org/10.1016/j.vaccine.2021.10.038
|
| [26] |
Fiolet T, Kherabi Y, MacDonald CJ, et al. (2022) Comparing COVID-19 vaccines for their characteristics, efficacy and effectiveness against SARS-CoV-2 and variants of concern: A narrative review. Clin Microbiol Infect 28: 202-221. https://doi.org/10.1016/j.cmi.2021.10.005
|
| [27] | National Institute of Health. COVID STAT INFN. Italy National Institute of Health . Available from: https://covid19.infn.it/ (Last access on 2 March 2023) (In Italian) |
| [28] | Civil Protection Department. COVID-19 Italy data. Italy Civil Protection Department . Available from: https://github.com/pcm-dpc/COVID-19 (Accessed 2 March 2023) (In Italian) |
| [29] | National Agency for Regional Health Services. COVID-19 portal. Italy National Agency for Regional Health Services . Available from: https://www.agenas.gov.it/ (Last access on 3 March 2023) (In Italian) |
| [30] | National Institute of Statistics. I.Stat. Italy National Institute of Statistics . Available from: http://dati.istat.it/Index.aspx (Last access on 8 March 2023) (In Italian) |
| [31] | Italian Parliament. Title V Reform of the Italian Constitution. Constitutional law n. 3. Italy Italian Parliament (2001) . Available from: https://www.parlamento.it/parlam/leggi/01003lc.htm (Last access on 2 March 2023) (In Italian) |
| [32] | The R Foundation. The R Foundation for Statistical Computing. Austria The R Foundation . Available from: https://www.R-project.org (Last access on 14 March 2023) |
| [33] |
Shapiro SS, Wilk MB (1965) An analysis of variance test for normality (complete samples). Biometrika 52: 591-611. https://doi.org/10.1093/biomet/52.3-4.591
|
| [34] | Jerrold HZ (2009) Biostatistical Analysis, 5 Eds. New Jersey: Pearson. |
| [35] |
Lachin JM (2010) Biostatistical Methods. The Assessment of Relative Risks, 2 Eds. New York: John Wiley and Sons.
|
| [36] |
Nagelkerke NJD (1991) A note on a general definition of the coefficient of determination. Biometrika 78: 691-692. https://doi.org/10.1093/biomet/78.3.691
|
| [37] |
Spearman C (2010) The proof and measurement of association between two things. Int J Epidemiol 39: 1137-1150. https://doi.org/10.1093/ije/dyq191
|
| [38] |
Lopez Bernal J, Andrews N, Gower C, et al. (2021) Effectiveness of Covid-19 vaccines against the B.1.617.2 (Delta) variant. N Engl J Med 385: 585-594. https://doi.org/10.1056/NEJMoa2108891
|
| [39] |
Andrews N, Stowe J, Kirsebom F, et al. (2022) Covid-19 vaccine effectiveness against the Omicron (B.1.1.529) variant. N Engl J Med 386: 1532-1546. https://doi.org/10.1056/NEJMoa2119451
|
| [40] |
De Vito A, Fiore V, Princic E, et al. (2021) Predictors of infection, symptoms development, and mortality in people with SARS-CoV-2 living in retirement nursing homes. PLoS One 16: e0248009. https://doi.org/10.1371/journal.pone.0248009
|
| [41] |
Chaturvedi R, Lui B, Aaronson JA, et al. (2022) COVID-19 complications in males and females: recent developments. J Comp Eff Res 11: 689-698. https://doi.org/10.2217/cer-2022-0027
|
| [42] |
Lichtenstein BJ, Smith T, Smith B, et al. (2022) The impact of key secular trends during the first three waves the COVID-19 pandemic. Ann Epidemiol 76: 158-164. https://doi.org/10.1016/j.annepidem.2022.06.036
|
| [43] |
Moreno-Torres V, de Mendoza C, Martínez-Urbistondo M, et al. (2023) Predictors of in-hospital mortality in HIV-infected patients with COVID-19. QJM 116: 57-62. https://doi.org/10.1093/qjmed/hcac215
|
| [44] |
Barandalla I, Alvarez C, Barreiro P, et al. (2021) Impact of scaling up SARS-CoV-2 vaccination on COVID-19 hospitalizations in Spain. Int J Infect Dis 112: 81-88. https://doi.org/10.1016/j.ijid.2021.09.022
|
| [45] |
Martinelli D, Fortunato F, Mazzilli S, et al. (2022) Estimating the proportion of asymptomatic COVID-19 cases in an Italian region with intermediate incidence during the first pandemic wave: An observational retrospective study. Biomed Res Int 2022: 3401566. https://doi.org/10.1155/2022/3401566
|
| [46] |
Castagnoli R, Marseglia GL (2022) Tracing and vaccinating: how to REACT to COVID-19 pandemic. Lancet Respir Med 10: 317-318. https://doi.org/10.1016/S2213-2600(22)00016-9
|
| [47] |
Bosa I, Castelli A, Castelli M, et al. (2022) Response to COVID-19: was Italy (un)prepared?. Health Econ Policy Law 17: 1-13. https://doi.org/10.1017/S1744133121000141
|
| [48] | Nacoti M, Ciocca A, Giupponi A, et al. (2020) At the epicenter of the Covid-19 pandemic and humanitarian crises in Italy: changing perspectives on preparation and mitigation. NEJM Catalyst . https://doi.org/10.1056/CAT.20.0080 |
| [49] |
Mauro M, Giancotti M (2021) Italian responses to the COVID-19 emergency: overthrowing 30 years of health reforms?. Health Policy 125: 548-552. https://doi.org/10.1016/j.healthpol.2020.12.015
|
| [50] |
Garattini L, Zanetti M, Freemantle N (2020) The Italian NHS: what lessons to draw from COVID-19?. Appl Health Econ Health Policy 18: 463-466. https://doi.org/10.1007/s40258-020-00594-5
|
| [51] |
Plagg B, Piccoliori G, Oschmann J, et al. (2021) Primary health care and hospital management during COVID-19: lessons from Lombardy. Risk Manag Healthc Policy 14: 3987-3992. https://doi.org/10.2147/RMHP.S315880
|
| [52] |
Bosa I, Castelli A, Castelli M, et al. (2021) Corona-regionalism? Differences in regional responses to COVID-19 in Italy. Health Policy 125: 1179-1187. https://doi.org/10.1016/j.healthpol.2021.07.012
|
| [53] |
Garattini L, Badinella Martini M, Nobili A (2021) The Italian NHS in Lombardy and Veneto: near but far. Intern Emerg Med 16: 2335-2337. https://doi.org/10.1007/s11739-021-02754-4
|
 medsci-10-03-019-s001.pdf medsci-10-03-019-s001.pdf |
 |
Figures(5) / Tables(4)

Rosario Megna. Evolution of the COVID-19 pandemic in Italy at the national and regional levels from February 2020 to March 2022[J]. AIMS Medical Science, 2023, 10(3): 237-258. doi: 10.3934/medsci.2023019


 DownLoad: