Single cell dispensing techniques mainly include limiting dilution, fluorescent-activated cell sorting (FACS) and microfluidic approaches. Limiting dilution process is complicated by statistical analysis of clonally derived cell lines. Flow cytometry and conventional microfluidic chip methods utilize excitation fluorescence signals for detection, potentially causing a non-negligible effect on cell activity. In this paper, we implement a nearly non-destructive single-cell dispensing method based on object detection algorithm. To realize single cell detection, we have built automated image acquisition system and then employed PP-YOLO neural network model as detection framework. Through architecture comparison and parameter optimization, we select ResNet-18vd as backbone for feature extraction. We train and evaluate the flow cell detection model on train and test set consisting of 4076 and 453 annotated images respectively. Experiments show that the model inference an image of 320 × 320 pixels at least 0.9 ms with the precision of 98.6% on a NVidia A100 GPU, achieving a good balance of detection speed and accuracy.
Citation: Junjing Cai, Qiwei Wang, Ce Wang, Yu Deng. Research on cell detection method for microfluidic single cell dispensing[J]. Mathematical Biosciences and Engineering, 2023, 20(2): 3970-3982. doi: 10.3934/mbe.2023185
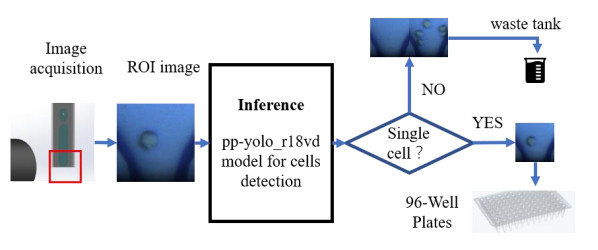
Single cell dispensing techniques mainly include limiting dilution, fluorescent-activated cell sorting (FACS) and microfluidic approaches. Limiting dilution process is complicated by statistical analysis of clonally derived cell lines. Flow cytometry and conventional microfluidic chip methods utilize excitation fluorescence signals for detection, potentially causing a non-negligible effect on cell activity. In this paper, we implement a nearly non-destructive single-cell dispensing method based on object detection algorithm. To realize single cell detection, we have built automated image acquisition system and then employed PP-YOLO neural network model as detection framework. Through architecture comparison and parameter optimization, we select ResNet-18vd as backbone for feature extraction. We train and evaluate the flow cell detection model on train and test set consisting of 4076 and 453 annotated images respectively. Experiments show that the model inference an image of 320 × 320 pixels at least 0.9 ms with the precision of 98.6% on a NVidia A100 GPU, achieving a good balance of detection speed and accuracy.

| [1] |
X. Zhang, X. Wei, Y. J. Wei, M. L. Chen, J. H. Wang, The up-to-date strategies for the isolation and manipulation of single cells, Talanta, 218 (2020), 121147. https://doi.org/10.1016/j.talanta.2020.121147 doi: 10.1016/j.talanta.2020.121147

|
| [2] |
P. Hu, W. H. Zhang, H. B. Xin, G. Deng, Single cell isolation and analysis, Front. Cell Dev. Biol., 4 (2016), 116. https://doi.org/10.3389/fcell.2016.00116 doi: 10.3389/fcell.2016.00116
|
| [3] |
M. H. Spitzer, G. P. Nolan, Mass cytometry: Singlecells, many features, Cell, 165 (2016), 780–791. https://doi.org/10.1016/j.cell.2016.04.019 doi: 10.1016/j.cell.2016.04.019
|
| [4] |
X. Wei, Y. Lu, X. Zhang, M. L. Chen, J. H. Wang, Recent advances in single-cell ultra-trace analysis, Trends Anal. Chem., 127 (2020), 115886. https://doi.org/10.1016/j.trac.2020.115886 doi: 10.1016/j.trac.2020.115886
|
| [5] |
A. L. Grilo, A. Mantalaris, The increasingly human and profitable monoclonal antibody market, Trends Biotechnol., 37 (2019), 9–16. https://doi.org/10.1016/j.tibtech.2018.05.014 doi: 10.1016/j.tibtech.2018.05.014
|
| [6] |
D. Shaw, M. Yim, J. Tsukuda, J. C. Joly, A. Lin, B. Snedecor, et al., Development and characterization of an automated imaging workflow to generate clonally-derived cell lines for therapeutic proteins, Biotechnol. Prog., 34 (2018), 584–592. https://doi.org/10.1002/btpr.2561 doi: 10.1002/btpr.2561
|
| [7] |
J. Fieder, P. Schulz, I. Gorr, H. Bradl, T. Wenger, A single-step FACS sorting strategy in conjunction with fluorescent vital dye imaging efficiently assures clonality of biopharmaceutical production cell lines, Biotechnol. J., 12 (2017). https://doi.org/10.1002/biot.201700002 doi: 10.1002/biot.201700002
|
| [8] |
M. Yim, D. Shaw, Achieving greater efficiency and higher confidence in single-cell cloning by combining cell printing and plate imaging technologies, Biotechnol. Prog., 34 (2018), 1454–1459. https://doi.org/10.1002/btpr.2698 doi: 10.1002/btpr.2698
|
| [9] |
N. Nitta, T. Sugimura, A. Isozaki, H. Mikami, K. Hiraki, S. Sakuma, et al., Intelligent image-activated cell sorting, Cell, 175 (2018), 266–276. https://doi.org/10.1016/j.cell.2018.08.028 doi: 10.1016/j.cell.2018.08.028
|
| [10] |
A. Isozaki, H. Mikami, H Tezuka, H. Matsumura, K. Huang, M. Akamine, et al., Intelligent image-activated cell sorting 2.0, Lab Chip, 20 (2020), 2263–2273. https://doi.org/10.1039/d0lc00080a doi: 10.1039/d0lc00080a
|
| [11] |
J. Riba, J. Schoendube, S. Zimmermann, P. Koltay, R. Zengerle, Single-cell dispensing and "real-time" cell classification using convolutional neural networks for higher efficiency in single-cell cloning, Sci. Rep., 10 (2020), 1193. https://doi.org/10.1038/s41598-020-57900-3 doi: 10.1038/s41598-020-57900-3
|
| [12] |
Y. Wang, D. F. Wang, H. F. Wang, J. W. Wang, J. Z. Pan, X. G. Guo, et al., A microfluidic robot for rare cell sorting based on machine vision identification and multi-step sorting strategy, Talanta, 226 (2021), 122136. https://doi.org/10.1016/j.talanta.2021.122136 doi: 10.1016/j.talanta.2021.122136
|
| [13] | X. Long, K. P. Deng, G. Z. Wang, Y. Zhang, Q. Q. Dang, Y. Gao, et al., PP-YOLO: An effective and efficient implementation of object detector, preprint, arXiv: 2007.12099. |
| [14] | J. Redmon, A. Farhadi, YOLOv3: An incremental improvement, preprint, arXiv: 1804.02767. |
| [15] | A. Bochkovskiy, C. Y. Wang, H. Liao, YOLOv4: Optimal speed and accuracy of object detection, preprint, arXiv: 2004.10934. |
| [16] | T. He, Z. Zhang, H. Zhang, Z. Y. Zhang, J. Y. Xie, M. Li, Bag of tricks for image classification with convolutional neural networks, in 2019 IEEE/CVF Conference on Computer Vision and Pattern Recognition (CVPR), 2019. https://doi.org/10.1109/CVPR.2019.00065 |
| [17] | K. He, X. Zhang, S. Ren, J. Sun, Deep residual learning for image recognition, in 2016 IEEE Conference on Computer Vision and Pattern Recognition (CVPR), 2016. https://doi.org/10.1109/CVPR.2016.90 |
| [18] | X. L. Wang, R. F. Zhang, T. Kong, L. Li, C. H. Shen, SOLOv2: Dynamic and fast instance segmentation, in Advances in Neural Information Processing Systems 33, NeurIPS, (2020), 17721–17732. |
| [19] | S. L. Xu, X. X. Wang, W. Y. Lv, Q. Y. Chang, C. Cui, K. P. Deng, PP-YOLOE: An evolved version of YOLO, preprint, arXiv: 2203.16250. |
| [20] | G. H. Yu, Q. Y. Chang, W. Y. Lv, C. Xu, C. Cui, W. Ji, et al., PP-PicoDet: A better real-time object detector on mobile devices, preprint, arXiv: 2111.00902. |


Figures(10) / Tables(4)

Junjing Cai, Qiwei Wang, Ce Wang, Yu Deng. Research on cell detection method for microfluidic single cell dispensing[J]. Mathematical Biosciences and Engineering, 2023, 20(2): 3970-3982. doi: 10.3934/mbe.2023185


 DownLoad: