We adopted the method of knowledge mapping to conduct in-depth visualization to propose the construction method of knowledge mapping-based inference of a healthy operation index in higher education (HOI-HE). For the first part, an improved named entity identification and relationship extraction method is developed, incorporating a vision sensing pre-training algorithm named BERT. For the second part, a multi-decision model-based knowledge graph is used to infer the HOI-HE score by using a multi-classifier ensemble learning approach. The combination of two parts constitutes a vision sensing-enhanced knowledge graph method. The functional modules of knowledge extraction, relational reasoning and triadic quality evaluation are integrated to provide the digital evaluation platform for the HOI-HE value. The vision sensing-enhanced knowledge inference method for the HOI-HE is able to exceed the benefit of pure data-driven methods. The experimental results in some simulated scenes show that the proposed knowledge inference method can work well in the evaluation of a HOI-HE, as well as to discover some latent risk.
Citation: Yu Nie, Xingpeng Luo, Yanghang Yu. A vision sensing-enhanced knowledge graph inference method for a healthy operation index in higher education[J]. Mathematical Biosciences and Engineering, 2023, 20(2): 3731-3748. doi: 10.3934/mbe.2023175
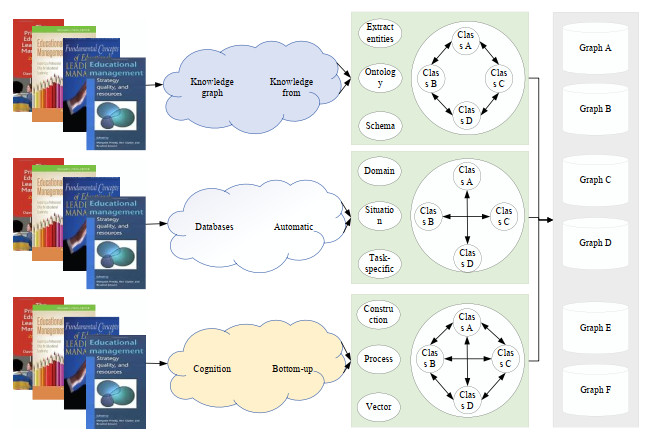
We adopted the method of knowledge mapping to conduct in-depth visualization to propose the construction method of knowledge mapping-based inference of a healthy operation index in higher education (HOI-HE). For the first part, an improved named entity identification and relationship extraction method is developed, incorporating a vision sensing pre-training algorithm named BERT. For the second part, a multi-decision model-based knowledge graph is used to infer the HOI-HE score by using a multi-classifier ensemble learning approach. The combination of two parts constitutes a vision sensing-enhanced knowledge graph method. The functional modules of knowledge extraction, relational reasoning and triadic quality evaluation are integrated to provide the digital evaluation platform for the HOI-HE value. The vision sensing-enhanced knowledge inference method for the HOI-HE is able to exceed the benefit of pure data-driven methods. The experimental results in some simulated scenes show that the proposed knowledge inference method can work well in the evaluation of a HOI-HE, as well as to discover some latent risk.

| [1] |
Z. Guo, K. Yu, Z. Lv, K. K. R. Choo, P. Shi, J. J. P. C. Rodrigues, Deep federated learning enhanced secure POI microservices for cyber-physical systems, IEEE Wireless Commun., 29 (2022), 22−29. https://doi.org/10.1109/MWC.002.2100272 doi: 10.1109/MWC.002.2100272

|
| [2] |
Y. He, S. Yang, C. Y. Chan, L. Chen, C. Wu, Visualization analysis of intelligent vehicles research field based on mapping knowledge domain, IEEE Trans. Intell. Transp. Syst., 22 (2020), 5721−5736. https://doi.org/10.1109/TITS.2020.2991642 doi: 10.1109/TITS.2020.2991642
|
| [3] |
L. Zhao, Z. Yin, K. Yu, X. Tang, L. Xu, Z. Guo, et al., A fuzzy logic based intelligent multi-attribute routing scheme for two-layered SDVNs, IEEE Trans. Netw. Serv. Manage., 2022 (2022). https://doi.org/10.1109/TNSM.2022.3202741 doi: 10.1109/TNSM.2022.3202741
|
| [4] |
Y. Li, H. Ma, L. Wang, S. Mao, G. Wang, Optimized content caching and user association for edge computing in densely deployed heterogeneous networks, IEEE Trans. Mob. Comput., 21 (2022), 2130−2142. https://doi.org/10.1109/TMC.2020.3033563 doi: 10.1109/TMC.2020.3033563
|
| [5] |
C. Chen, Z. Liao, Y. Ju, C. He, K. Yu, S. Wan, Hierarchical domain-based multi-controller deployment strategy in SDN-enabled space-air-ground integrated network, IEEE Trans. Aerosp. Electron. Syst., 58 (2022), 4864−4879. https://doi.org/10.1109/TAES.2022.3199191 doi: 10.1109/TAES.2022.3199191
|
| [6] |
Z. Zhou, X. Dong, Z. Li, K. Yu, C. Ding, Y. Yang, Spatio-temporal feature encoding for traffic accident detection in VANET environment, IEEE Trans. Intell. Transp. Syst., 2022 (2022), 19772−19781. https://doi.org/10.1109/TITS.2022.3147826 doi: 10.1109/TITS.2022.3147826
|
| [7] |
Z. Guo, C. Tang, W. Niu, Y. Fu, T. Wu, H. Xia, et al., Fine-grained recommendation mechanism to curb astroturfing in crowdsourcing systems, IEEE Access, 5 (2017), 15529−15541. https://doi.org/10.1109/ACCESS.2017.2731360 doi: 10.1109/ACCESS.2017.2731360
|
| [8] |
S. Xia, Z. Yao, Y. Li, S. Mao, Online distributed offloading and computing resource management with energy harvesting for heterogeneous MEC-enabled IoT, IEEE Trans. Wireless Commun., 20 (2021), 6743−6757. https://doi.org/10.1109/TWC.2021.3076201 doi: 10.1109/TWC.2021.3076201
|
| [9] |
Q. Zhang, K. Yu, Z. Guo, S. Garg, J. J. P. C. Rodrigues, M. M. Hassan, et al., Graph neural networks-driven traffic forecasting for connected internet of vehicles, IEEE Trans. Network Sci. Eng., 9 (2022), 3015−3027. https://doi.org/10.1109/TNSE.2021.3126830 doi: 10.1109/TNSE.2021.3126830
|
| [10] |
S. Ji, S. Pan, E. Cambria, P. Marttinen, P. S. Yu, A survey on knowledge graphs: representation, acquisition, and applications, IEEE Trans. Neural Networks Learn. Syst., 33 (2021), 494−514. https://doi.org/10.1109/TNNLS.2021.3070843 doi: 10.1109/TNNLS.2021.3070843
|
| [11] |
Y. Yang, Y. Zhuang, Y. Pan, Multiple knowledge representation for big data artificial intelligence: framework, applications, and case studies, Front. Inf. Technol. Electron. Eng., 22 (2021), 1551−1558. https://doi.org/10.1631/FITEE.2100463 doi: 10.1631/FITEE.2100463
|
| [12] |
W. Wang, C. Lu, Visualization analysis of big data research based on Citespace, Soft Comput., 24 (2020), 8173−8186. https://doi.org/10.1007/s00500-019-04384-7 doi: 10.1007/s00500-019-04384-7
|
| [13] |
M. Decuypere, P. Landri, Governing by visual shapes: university rankings, digital education platforms and cosmologies of higher education, Crit. Stud. Educ., 62 (2021), 17−33. https://doi.org/10.1080/17508487.2020.1720760 doi: 10.1080/17508487.2020.1720760
|
| [14] |
F. Lecue, On the role of knowledge graphs in explainable AI, Semantic Web, 11 (2020), 41−51. https://doi.org/10.3233/SW-190374 doi: 10.3233/SW-190374
|
| [15] |
R. Cerezo, A. Bogarín, M. Esteban, C. Romero, Process mining for self-regulated learning assessment in e-learning, J. Comput. High Educ., 32 (2020), 74−88. https://doi.org/10.1007/s12528-019-09225-y doi: 10.1007/s12528-019-09225-y
|
| [16] |
L. Chang, G. Zhou, O. Soufan, J. Xia, miRNet 2.0: network-based visual analytics for miRNA functional analysis and systems biology, Nucleic Acids Res., 48 (2020), W244−W251. https://doi.org/10.1093/nar/gkaa467 doi: 10.1093/nar/gkaa467
|
| [17] | H. Luan, C. C. Tsai, A review of using machine learning approaches for precision education, Educ. Technol. Soc., 24 (2021), 250−266. Available from: https://www.jstor.org/stable/26977871. |
| [18] |
D. Ifenthaler, J. Y. K. Yau, Utilising learning analytics to support study success in higher education: a systematic review, Educ. Technol. Res. Dev., 68 (2020), 1961−1990. https://doi.org/10.1007/s11423-020-09788-z doi: 10.1007/s11423-020-09788-z
|
| [19] |
J. Yuan, C. Chen, W. Yang, M. Liu, J. Xia, S. Liu, A survey of visual analytics techniques for machine learning, Comput. Visual Media, 7 (2021), 3−36. https://doi.org/10.1007/s41095-020-0191-7 doi: 10.1007/s41095-020-0191-7
|
| [20] |
N. Pellas, S. Mystakidis, I. Kazanidis, Immersive virtual reality in K-12 and higher education: a systematic review of the last decade scientific literature, Virtual Reality, 25 (2021), 835−861. https://doi.org/10.1007/s10055-020-00489-9 doi: 10.1007/s10055-020-00489-9
|
| [21] |
P. Jääskelä, V. Heilala, T. Kärkkäinen, P. Häkkinen, Student agency analytics: learning analytics as a tool for analysing student agency in higher education, Behav. Inf. Technol., 40 (2021), 790−808. https://doi.org/10.1080/0144929X.2020.1725130 doi: 10.1080/0144929X.2020.1725130
|
| [22] |
L. Tarkhova, S. Tarkhov, M. Nafikov, I. Akhmetyanov, D. Gusev, R. Akhmarov, Infographics and their application in the educational process, Int. J. Emerging Technol. Learn. (IJET), 15 (2020), 63−80. https://doi.org/10.3991/ijet.v15i13.14647 doi: 10.3991/ijet.v15i13.14647
|
| [23] |
H. Gao, Y. Duan, L. Shao, X. Sun, Transformation-based processing of typed resources for multimedia sources in the IoT environment, Wireless Netw., 27 (2021), 3377−3393. https://doi.org/10.1007/s11276-019-02200-6 doi: 10.1007/s11276-019-02200-6
|
| [24] |
M. Koho, E. Ikkala, P. Leskinen, T. Tamper, J. Tuominen, E. Hyvönen, Warsampo knowledge graph: Finland in the second world war as linked open data, Semantic Web, 12 (2021), 265−278. https://doi.org/10.3233/SW-200392 doi: 10.3233/SW-200392
|
| [25] |
I. Krak, O. Barmak, E. Manziuk, Using visual analytics to develop human and machine‐centric models: a review of approaches and proposed information technology, Comput. Intell., 38 (2022), 921−946. https://doi.org/10.1111/coin.12289 doi: 10.1111/coin.12289
|


Figures(8)

Yu Nie, Xingpeng Luo, Yanghang Yu. A vision sensing-enhanced knowledge graph inference method for a healthy operation index in higher education[J]. Mathematical Biosciences and Engineering, 2023, 20(2): 3731-3748. doi: 10.3934/mbe.2023175


 DownLoad: