The use of conventional bio-signals such as an electrocardiogram (ECG) for biometric authentication is vulnerable to a lack of verification of continuity of signals; this is because the system does not consider the change in signals caused by a change in the situation of a person, that is, conventional biological signals. Prediction technology based on tracking and analyzing new signals can overcome this shortcoming. However, since the biological signal data sets are massive, their utilization is crucial for higher accuracy. In this study, we defined a 10 $ \times $ 10 matrix for 100 points based on the R-peak point and an array for the dimension of the signals. Furthermore, we defined the future predicted signals by analyzing the continuous points in each array of the matrices at the same point. As a result, the accuracy of user authentication was 91%.
Citation: Hoon Ko, Kwangcheol Rim, Jong Youl Hong. Bio-metric authentication with electrocardiogram (ECG) by considering variable signals[J]. Mathematical Biosciences and Engineering, 2023, 20(2): 1716-1729. doi: 10.3934/mbe.2023078
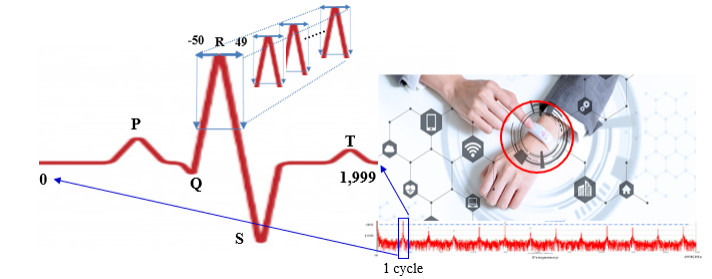
The use of conventional bio-signals such as an electrocardiogram (ECG) for biometric authentication is vulnerable to a lack of verification of continuity of signals; this is because the system does not consider the change in signals caused by a change in the situation of a person, that is, conventional biological signals. Prediction technology based on tracking and analyzing new signals can overcome this shortcoming. However, since the biological signal data sets are massive, their utilization is crucial for higher accuracy. In this study, we defined a 10 $ \times $ 10 matrix for 100 points based on the R-peak point and an array for the dimension of the signals. Furthermore, we defined the future predicted signals by analyzing the continuous points in each array of the matrices at the same point. As a result, the accuracy of user authentication was 91%.

| [1] | S. Tripathi, J. Murgi, K. R. S. Soni, R. Singh, A literature survey on multi model bio-metric system, J. Comput. Technol., 10 (2021), 1–5. |
| [2] |
W. Wu, S. Pirbhulal, G. Li, Adaptive computing-based biometric security for intelligent medical applications, Neural Comput. Appl., 32 (2020), 11055–11064. https://doi.org/10.1007/s00521-018-3855-9 doi: 10.1007/s00521-018-3855-9

|
| [3] |
C. Che, P. Zhang, M. Zhu, Y. Qu, B. Jin, Constrained transformer network for ECG signal processing and arrhythmia classification, BMC Med. Inf. Decis. Making, 21 (2021), 184. https://doi.org/10.1186/s12911-021-01546-2 doi: 10.1186/s12911-021-01546-2
|
| [4] |
Z. Chen, P. Zhao, F. Li, T. T. Marquez-Lago, A. Leier, J. Revote, iLearn: an integrated platform and meta-learner for feature engineering, machine-learning analysis and modeling of DNA, RNA and protein sequence data, Briefings Bioinf., 21 (2020), 1047–1057. https://doi.org/10.1093/bib/bbz041 doi: 10.1093/bib/bbz041
|
| [5] |
J. M. Ackerson, R. Dave, N. Seliya, Applications of recurrent neural network for biometric authentication & anomaly detection, Information, 12 (2021), 272. https://doi.org/10.3390/info12070272 doi: 10.3390/info12070272
|
| [6] | M. R. Ogiela, L. Ogiela, U. Ogiela, Biometric methods for advanced strategic data sharing protocols, in IMIS 2015-The Ninth International Conference on Innovative Mobile and Internet Services in Ubiquitous Computing (IMIS-2015), (2015), 179–183. https://doi.org/10.1109/IMIS.2015.29 |
| [7] |
S. K. Cherupally, S. Yin, D. Kadetotad, C. Bae, S. J. Kim, J. S. Seo, A smart hardware security engine combining entropy sources of ECG, HRV, and SRAM PUF for authentication and secret key generation, IEEE J. Solid State Circuits, 55 (2020), 2680–2690. https://doi.org/10.1109/JSSC.2020.3010705 doi: 10.1109/JSSC.2020.3010705
|
| [8] |
H. Ko, S. B. Pan, L. Měsíček, Personal identification study for touchable devices with ECG, Concurr. Comput. Pract. Exp., 32 (2020), e5169. https://doi.org/10.1002/cpe.5169 doi: 10.1002/cpe.5169
|
| [9] |
H. Ko, M. R. Ogiela, L. Ogiela, L. Mesicek, M. Lee, J. Choi, et al., ECG-based advanced personal identification study with adjusted (Qi * Si), IEEE Access, 7 (2019), 40078–40084. https://doi.org/10.1109/ACCESS.2019.2903575 doi: 10.1109/ACCESS.2019.2903575
|
| [10] | A. Lee, Y. Kim, Photoplethysmography as a form of biometric authentication, in 2015 IEEE Sensors, (2015). https://doi.org/10.1109/ICSENS.2015.7370629 |
| [11] |
Y. Li, Y. Pang, K. Wang, X. Li, Toward improving ECG biometric identification using cascaded convolutional neural networks, Neurocomputing, 391 (2020), 83–95. https://doi.org/10.1016/j.neucom.2020.01.019 doi: 10.1016/j.neucom.2020.01.019
|
| [12] |
S. Khan, S. Parkinson, L. Grant, N. Liu, S. McGuire, Biometric systems utilising health data from wearable devices: applications and future challenges in computer security, ACM Comput. Surv., 53 (2020), 1–29. https://doi.org/10.1145/3400030 doi: 10.1145/3400030
|
| [13] |
J. A. Jahanshahi, H. Danyali, M. S. Helfroush, Compressive sensing based the multi-channel ECG reconstruction in wireless body sensor networks, Biomed. Signal Process. Control, 61 (2020), 102047. https://doi.org/10.1016/j.bspc.2020.102047 doi: 10.1016/j.bspc.2020.102047
|
| [14] |
G. Choi, H. Ko, W. Pedrycz, A. K. Singh, S. B. Pan, Recognition system using fusion normalization based on morphological features of post-exercise ECG for intelligent biometrics, Sensors, 20 (2020), 7130. https://doi.org/10.3390/s20247130 doi: 10.3390/s20247130
|
| [15] |
H. Choi, B. Lee, S. Yoon, Biometric authentication using noisy electrocardiograms acquired by mobile sensors, IEEE Access, 4 (2016), 1266–1273. https://doi.org/10.1109/ACCESS.2016.2548519 doi: 10.1109/ACCESS.2016.2548519
|
| [16] | R. E. Wright, Logistic regression, Am. Psychol. Assoc., 7 (1995), 217–244. |
| [17] |
J. Pérez, J. Díaz, J. Garcia-Martin, B. Tabuenca, Systematic literature reviews in software engineering—Enhancement of the study selection process using Cohen's kappa statistic, J. Syst. Software, 168 (2020), 110657. https://doi.org/10.1016/j.jss.2020.110657 doi: 10.1016/j.jss.2020.110657
|
| [18] |
F. Thabtah, N. Abdelhamid, D. Peebles, A machine learning autism classification based on logistic regression analysis, Health Inf. Sci. Syst., 7 (2019), 12. https://doi.org/10.1007/s13755-019-0073-5 doi: 10.1007/s13755-019-0073-5
|
| [19] |
A. Cano, B. Krawczyk, Kappa updated ensemble for drifting data stream mining, Mach. Learn., 109 (2020), 175–218. https://doi.org/10.1007/s10994-019-05840-z doi: 10.1007/s10994-019-05840-z
|
| [20] |
A. D. Raadt, M. J. Alexandra, R. J. Bosker, H. A. K. Kiers, Kappa coefficients for missing data, Edu. Psychol. Meas., 79 (2019), 558–576. https://doi.org/10.1177/0013164418823249 doi: 10.1177/0013164418823249
|
| [21] |
M. J. Warrens, Kappa coefficients for dichotomous-nominal classifications, Adv. Data Anal. Classif., 15 (2021), 193–208. https://doi.org/10.1007/s11634-020-00394-8 doi: 10.1007/s11634-020-00394-8
|
| [22] |
K. Itano, K. Ueki, T. Iizuka, T. Kuwatani, Geochemical discrimination of monazite source rock based on machine learning techniques and multinomial logistic regression analysis, Geosciences, 10 (2020), 63. https://doi.org/10.3390/geosciences10020063 doi: 10.3390/geosciences10020063
|
| [23] |
N. Senaviratna, T. Cooray, Diagnosing multicollinearity of logistic regression model, Asian J. Prob. Stat., 5 (2019), 1–9. https://doi.org/10.9734/ajpas/2019/v5i230132 doi: 10.9734/ajpas/2019/v5i230132
|
| [24] |
M. D. Cock, R. Dowsley, A. C. A. Nascimento, D. Railsback, J. Shen, A. Todoki, High performance logistic regression for privacy-preserving genome analysis, BMC Med. Genomics, 14 (2021), 23. https://doi.org/10.1186/s12920-020-00869-9 doi: 10.1186/s12920-020-00869-9
|
| [25] |
K. Shah, H. Patel, D. Sanghvi, M. Shah, A comparative analysis of logistic regression, random forest and KNN models for the text classification, Augmented Human Res., 32 (2020), 11055–11064. https://doi.org/10.1007/s41133-020-00032-0 doi: 10.1007/s41133-020-00032-0
|
| [26] | L. Ogiela, M. R. Ogiela, U. Ogiela, Efficiency of strategic data sharing and management protocols, in IMIS 2016-The 10th International Conference on Innovative Mobile and Internet Services in Ubiquitous Computing (IMIS-2016), (2016), 198–201. https://doi.org/10.1109/IMIS.2016.119 |
| [27] |
M. R. Ogiela, L. Ogiela, U. Ogiela, Biometric Methods for Advanced Strategic Data Sharing Protocols, IMIS 2015 - The Ninth International Conference on Innovative Mobile and Internet Services in Ubiquitous Computing (IMIS-2015), (2015), 179–183. https://doi.org/10.1109/IMIS.2015.29 doi: 10.1109/IMIS.2015.29
|


Figures(4) / Tables(5)

Hoon Ko, Kwangcheol Rim, Jong Youl Hong. Bio-metric authentication with electrocardiogram (ECG) by considering variable signals[J]. Mathematical Biosciences and Engineering, 2023, 20(2): 1716-1729. doi: 10.3934/mbe.2023078


 DownLoad: