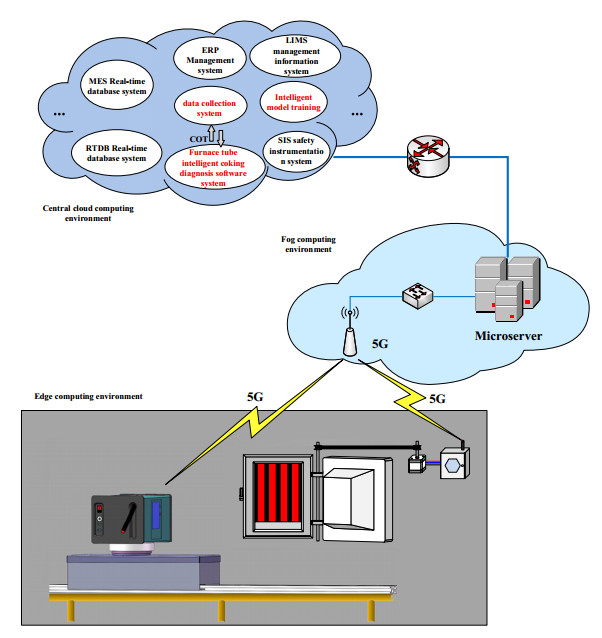
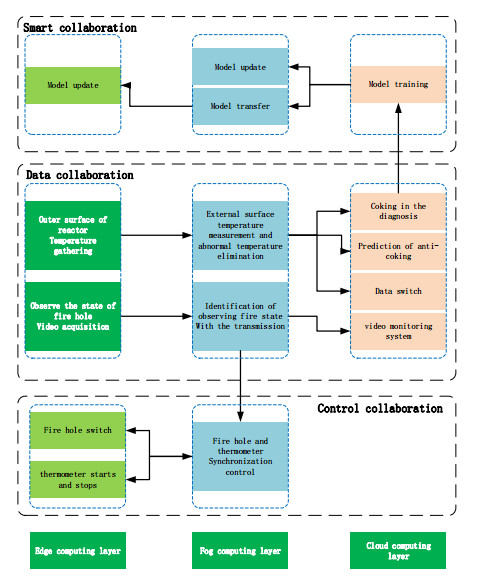
This study aimed to develop a 5G + "mixed computing" + deep learning-based next-generation intelligent health-monitoring platform for an ethylene cracking furnace tube based on 5G communication technology, with the goal of improving the health management level of the key component of ethylene production, that is, the cracking furnace tube, and focusing on the key common technical difficulties of ethylene production of tube outer-surface temperature sensing and tube slagging diagnosis. It also integrated the edge-fog-cloud "mixed computing" technology and deep learning technology in artificial intelligence, which had a higher degree in the research and development of automation and intelligence, and was more versatile in an industrial environment. The platform included a 5G-based tube intelligent temperature-measuring device, a 5G-based intelligent peep door gearing, a 5G-based edge-fog-cloud collaboration mechanism, and a mixed deep learning-related application. The platform enhanced the automation and intelligence of the enterprise, which could not only promote the quality and efficiency of the enterprise but also protect the safe operation of the cracking furnace device and lead the technological progress and transformation and upgrading of the industry through the application.
Citation: Delong Cui, Hong Huang, Zhiping Peng, Qirui Li, Jieguang He, Jinbo Qiu, Xinlong Luo, Jiangtao Ou, Chengyuan Fan. Next-generation 5G fusion-based intelligent health-monitoring platform for ethylene cracking furnace tube[J]. Mathematical Biosciences and Engineering, 2022, 19(9): 9168-9199. doi: 10.3934/mbe.2022426
This study aimed to develop a 5G + "mixed computing" + deep learning-based next-generation intelligent health-monitoring platform for an ethylene cracking furnace tube based on 5G communication technology, with the goal of improving the health management level of the key component of ethylene production, that is, the cracking furnace tube, and focusing on the key common technical difficulties of ethylene production of tube outer-surface temperature sensing and tube slagging diagnosis. It also integrated the edge-fog-cloud "mixed computing" technology and deep learning technology in artificial intelligence, which had a higher degree in the research and development of automation and intelligence, and was more versatile in an industrial environment. The platform included a 5G-based tube intelligent temperature-measuring device, a 5G-based intelligent peep door gearing, a 5G-based edge-fog-cloud collaboration mechanism, and a mixed deep learning-related application. The platform enhanced the automation and intelligence of the enterprise, which could not only promote the quality and efficiency of the enterprise but also protect the safe operation of the cracking furnace device and lead the technological progress and transformation and upgrading of the industry through the application.

| [1] |
F. Qian, W. Du, W. Zhong, Y. Tang, Problems and challenges of smart optimization manufacturing in petrochemical industries (in Chinese), Acta Autom. Sini., 43 (2017), 893–901. https://doi.org/10.16383/j.aas.2017.c170129 doi: 10.16383/j.aas.2017.c170129

|
| [2] | T. Chai, Q. Liu, J. Ding, Perspectives on industrial-internet-driven intelligent optimized manufacturing mode for process industries (in Chinese), Sci. Sin. Tech., 52 (2022), 14–25. https://doi.org/c10.1360/SST-2021-0405 |
| [3] |
N. Ma, X. Yao, K. Wang, Current status and prospect of future internet-oriented wisdom manufacturing (in Chinese), Sci. Sin. Tech., 52 (2022), 55–75. https://doi.org/10.1360/SST-2021-0232 doi: 10.1360/SST-2021-0232
|
| [4] |
Y. Shi, Q. Han, W. Shen, L, Wang, X. Wang, 5G Applications of intelligent manufacturing scenarios, China Mech. Eng., 31 (2020), 227–236. https://doi.org/10.16157/j.issn.0258-7998.211944 doi: 10.16157/j.issn.0258-7998.211944
|
| [5] |
Y. Shu, F. Zhu, An edge computing offloading mechanism for mobile peer sensing and network load weak balancing in 5G network, J. Ambient Intell. Hum. Comput., 11 (2020), 503–510. https://doi.org/10.1007/s12652-018-0970-5 doi: 10.1007/s12652-018-0970-5
|
| [6] |
S. Wang, Measures for realizing long period efficient operation of cracking furnace, Refin. Chem. Ind., 29 (2018), 30–32. https://doi.org/10.3969/j.issn.1671-4962.2018.01.010 doi: 10.3969/j.issn.1671-4962.2018.01.010
|
| [7] | H. Wang, Ethylene Plant Technology and Operation, China Petrochemical Press, 2009. |
| [8] |
X. Sun, L. Shen, Research progress of coking mechanism and prevention measures for ethylene cracking furnace tubes, Corros. Sci. Prot. Technol., 29 (2017), 575–580. https://doi.org/10.11903/1002.6495.2017.034 doi: 10.11903/1002.6495.2017.034
|
| [9] |
Y. Jin, J. Li, W. Du, Z. Wang, F. Qian, Outlet temperature correlation and prediction of transfer line exchanger in an industrial steam ethylene cracking process, Chin. J. Chem. Eng., 21 (2013), 388–394. https://doi.org/10.1016/S1004-9541(13)60472-8 doi: 10.1016/S1004-9541(13)60472-8
|
| [10] |
H. Shi, B. Peng, X. Jiang, C. Su, J. Cao, P Li, A hybrid control approach for the cracking outlet temperature system of ethylene cracking furnace, Soft Comput., 24 (2020), 12375–12390. https://doi.org/10.1007/s00500-020-04679-0 doi: 10.1007/s00500-020-04679-0
|
| [11] | S. Fedorov, A. Krasnov, M. Prakhova, Algorithm for diagnostics of technical condition of the tube furnace coils, in 2020 International Multi-Conference on Industrial Engineering and Modern Technologies (FarEastCon), (2020), 1–6. https://doi.org/10.1109/FarEastCon50210.2020.9271548 |
| [12] |
S. Vangaever, P. Reyniers, S. Symoens, N. Ristic, M. Djokic, G. Marin, Pyrometer-based control of a steam cracking furnace, Chem. Eng. Res. Des., 153 (2020), 380–390. https://doi.org/10.1016/j.cherd.2019.10.023 doi: 10.1016/j.cherd.2019.10.023
|
| [13] |
N. Gillani, T. Arslan, Intelligent sensing technologies for the diagnosis, monitoring and therapy of alzheimer's disease: a systematic review, Sensors, 21 (2021), 4249. https://doi.org/10.3390/s21124249 doi: 10.3390/s21124249
|
| [14] |
Y. Dai, H. Hu, M. Wang, J. Xu, S. Wang, Stretchable transistors and functional circuits for human-integrated electronics, Nat. Electron., 4 (2021), 17–29. https://doi.org/10.1038/s41928-020-00513-5 doi: 10.1038/s41928-020-00513-5
|
| [15] | G. Niu, S. Yu, Application of infrared on line temperature field detection system in ethylene pyrolyzer, Autom. Petro-Chem. Ind., 56 (2020), 72–74. |
| [16] |
D. Pinnock, P. Maropoulos, Review of industrial temperature measurement technologies and research priorities for the thermal characterisation of the factories of the future, Proc. Inst. Mech. Eng., Part B: J. Eng. Manuf., 230 (2016), 793–806. https://doi.org/10.1177/0954405414567929 doi: 10.1177/0954405414567929
|
| [17] | B. Rizkin, K. Popovich, R. Hartman, Artificial neural network control of thermoelectrically cooled microfluidics using computer vision based on IR thermography, Comput. Chem. Eng., 121 (2019), 584–593. https://doi.org/0.1016/j.compchemeng.2018.11.016 |
| [18] |
G. Mei, J. Zhang, S. Zhao, Z. Xie, Simple method for calculating the local effective emissivity of the blackbody cavity as a temperature sensor, Infrared Phys. Technol., 85 (2017), 372–377. https://doi.org/10.1016/j.infrared.2017.07.019 doi: 10.1016/j.infrared.2017.07.019
|
| [19] |
C. Abram, B. Fond, F. Beyrau, Temperature measurement techniques for gas and liquid flows using thermographic phosphor tracer particles, Prog. Energy Combust. Sci., 64 (2018), 93–156. https://doi.org/10.1016/j.pecs.2017.09.001 doi: 10.1016/j.pecs.2017.09.001
|
| [20] |
Q. Li, B. Zhang, D. Cui, The research of recognition of peep door open state of ethylene cracking furnace based on deep learning, Math. Biosci. Eng., 19 (2022), 3472–3486. https://doi.org/10.3934/mbe.2022160 doi: 10.3934/mbe.2022160
|
| [21] |
Z. Peng, J. He, Y. Tan, D. Cui, Q. Li, J. Qiu, Study of dual-phase drive synchronization method and temperature measurement algorithm for measuring external surface temperatures of ethylene cracking furnace tubes, Appl. Petrochem. Res., 8 (2018), 163–172. https://doi.org/10.1007/s13203-018-0205-x doi: 10.1007/s13203-018-0205-x
|
| [22] |
J. Zhao, Z. Peng, D. Cui, Q. Li, J. He, J. Qiu, A method for measuring tube metal temperature of ethylene cracking furnace tubes based on machine learning and neural network, IEEE Access, 7 (2019), 158643–158654. https://doi.org/10.1109/ACCESS.2019.2950419 doi: 10.1109/ACCESS.2019.2950419
|
| [23] |
J. Lee, K. Lee, A. Yoo, C. Moon, Design and implementation of edge-fog-cloud system through HD map generation from LiDAR data of autonomous vehicles, Electronics, 9 (2020), 2084. https://doi.org/10.3390/electronics9122084 doi: 10.3390/electronics9122084
|
| [24] | K. Geihs, H. Baraki, D. Oliva, Performance analysis of edge-fog-cloud architectures in the Internet of things, in 2020 IEEE/ACM 13Th International Conference On Utility And Cloud Computing (UCC 2020), (2020), 374–379. https://doi.org/10.1109/UCC48980.2020.00059 |
| [25] |
A. Alharbi, M. Aldossary, Energy-efficient edge-fog-cloud architecture for IoT-based smart agriculture environment, IEEE Access, 9 (2021), 110480–110492. https://doi.org/10.1109/ACCESS.2021.3101397 doi: 10.1109/ACCESS.2021.3101397
|
| [26] |
X. Wang, Y. Han, V. M. Leung, D. Niyato, X. Yan, X. Chen, Convergence of edge computing and deep learning: a comprehensive survey, IEEE Commun. Surv. Tutorials, 22 (2020), 869–904. https://doi.org/10.1109/COMST.2020.2970550 doi: 10.1109/COMST.2020.2970550
|
| [27] |
Y. Shi, J. Sun, D. Liu, L. Kou, B. Li, Q. Yang, et al., Cloud-based data offloading for multi-focus and multi-views image fusion in mobile applications, Mobile Networks Appl., 26 (2021), 830–841. https://doi.org/10.1007/s11036-019-01326-3 doi: 10.1007/s11036-019-01326-3
|
| [28] |
D. Cui, Z. Peng, J. Xiong, A reinforcement learning-based mixed job scheduler scheme for grid or IaaS cloud, IEEE Trans. Cloud Comput., 8 (2020), 1030–1039. https://doi.org/10.1109/TCC.2017.2773078 doi: 10.1109/TCC.2017.2773078
|
| [29] |
K. Li, Z. Peng, D. Cui, SLA-DQTS SLA constrained adaptive online task scheduling based on DDQN in cloud computing, Appl. Sci., 11 (2021), 9360–9360. https://doi.org/10.3390/app11209360 doi: 10.3390/app11209360
|
| [30] |
Z. Peng, J. Lin, D. Cui, A multi-objective trade-off framework for cloud resource scheduling based on the Deep Q-network algorithm, Cluster Comput., 23 (2020), 2753–2767. https://doi.org/10.1007/s10586-019-03042-9 doi: 10.1007/s10586-019-03042-9
|
Figures(25) / Tables(6)

Delong Cui, Hong Huang, Zhiping Peng, Qirui Li, Jieguang He, Jinbo Qiu, Xinlong Luo, Jiangtao Ou, Chengyuan Fan. Next-generation 5G fusion-based intelligent health-monitoring platform for ethylene cracking furnace tube[J]. Mathematical Biosciences and Engineering, 2022, 19(9): 9168-9199. doi: 10.3934/mbe.2022426


 DownLoad: