The increasing integration of large-scale wind power aggravates the difficulty of maintaining system frequency deviations in a certain range. The frequency regulation pressure of conventional generators increases, which requires wind farms to participate in system frequency regulation. In this paper, a multi-area interconnected power system frequency response model with wind power is established. Based on the frequency response model, the state space model of regional interconnected power system is presented. Then, the wind power variogram characteristics are introduced for estimating wind power variations in different time-scales. By predicting the wind power variations in AGC time-scale, a strategy of wind farm participating in AGC system is proposed and performed based on model predictive control (MPC). The control strategy makes the conventional units and wind farms to participate in AGC system coordinately. Simulation results are provided which verifies the feasibility and validity of the proposed strategy.
Citation: Qi Wang, Yufeng Guo, Dongrui Zhang, Yingwei Wang, Ying Xu, Jilai Yu. Research on wind farm participating in AGC based on wind power variogram characteristics[J]. Mathematical Biosciences and Engineering, 2022, 19(8): 8288-8303. doi: 10.3934/mbe.2022386
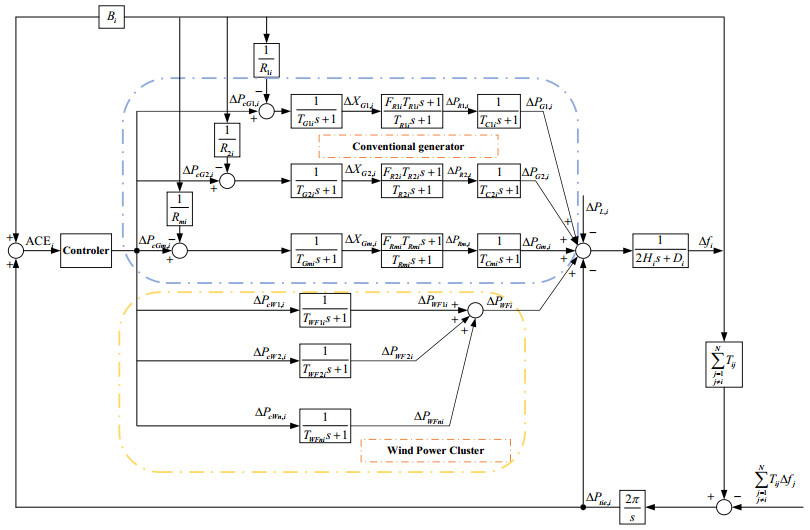
The increasing integration of large-scale wind power aggravates the difficulty of maintaining system frequency deviations in a certain range. The frequency regulation pressure of conventional generators increases, which requires wind farms to participate in system frequency regulation. In this paper, a multi-area interconnected power system frequency response model with wind power is established. Based on the frequency response model, the state space model of regional interconnected power system is presented. Then, the wind power variogram characteristics are introduced for estimating wind power variations in different time-scales. By predicting the wind power variations in AGC time-scale, a strategy of wind farm participating in AGC system is proposed and performed based on model predictive control (MPC). The control strategy makes the conventional units and wind farms to participate in AGC system coordinately. Simulation results are provided which verifies the feasibility and validity of the proposed strategy.

| [1] |
X. Chen, M. B. Mcelroy, Q. Wu, Y. Shu, Y. Xue, Transition towards higher penetration of renewables: an overview of interlinked technical, environmental and socio-economic challenges, J. Modern Power Syst. Clean Energy, 7 (2019), 1-8. https://doi.org/10.1007/s40565-018-0438-9 doi: 10.1007/s40565-018-0438-9

|
| [2] |
C. Rahmann, S. I. Chamas, R. Alvarez, H. Chavez, D. Ortiz-Villalba, Y. Shklyarskiy, Methodological approach for defining frequency related grid requirements in low-carbon power systems, IEEE Access, 8 (2020), 161929-161942. https://doi.org/10.1109/ACCESS.2020.3021307 doi: 10.1109/ACCESS.2020.3021307
|
| [3] |
Y. Fang, S. Zhao, E. Du, S. Li, Z. Li, Coordinated operation of concentrating solar power plant and wind farm for frequency regulation, J. Modern Power Syst. Clean Energy, 9 (2021), 751-759. https://doi.org/10.35833/MPCE.2021.000060 doi: 10.35833/MPCE.2021.000060
|
| [4] |
Z. Zheng, J. Li, H. Sang. A hybrid invasive weed optimization algorithm for the economic load dispatch problem in power systems, Math. Biosci. Eng., 16 (2019), 2775-2794. https://doi.org/10.3934/mbe.2019138 doi: 10.3934/mbe.2019138
|
| [5] |
N. Nguyen, J. Mitra, An analysis of the effects and dependency of wind power penetration on system frequency regulation, IEEE Trans. Sustain. Energ., 7 (2016), 354-363. https://doi.org/10.1109/TSTE.2015.2496970 doi: 10.1109/TSTE.2015.2496970
|
| [6] |
H. Ye, W. Pei, Z. Qi, Analytical modeling of inertial and droop responses from a wind farm for short-term frequency regulation in power systems, IEEE Trans. Power Syst., 31 (2016), 3414-3423. https://doi.org/10.1109/TPWRS.2015.2490342 doi: 10.1109/TPWRS.2015.2490342
|
| [7] |
Y. Wu, W. Yang, Y. Hu, P. Q. Dzung, Frequency regulation at a wind farm using time-varying inertia and droop controls, IEEE Trans. Ind. Appl., 55 (2019), 213-224. https://doi.org/10.1109/TIA.2018.2868644 doi: 10.1109/TIA.2018.2868644
|
| [8] |
H. Luo, Z. Hu, H. Zhang, H. Chen, Coordinated active power control strategy for deloaded wind turbines to improve regulation performance in AGC, IEEE Trans. Power Syst., 34 (2019), 98-108. https://doi.org/10.1109/TPWRS.2018.2867232 doi: 10.1109/TPWRS.2018.2867232
|
| [9] |
Z. Wang, W. Wu, Coordinated control method for DFIG-based wind farm to provide primary frequency regulation service, IEEE Trans. Power Syst., 33 (2018), 2644-2659. https://doi.org/10.1109/TPWRS.2017.2755685 doi: 10.1109/TPWRS.2017.2755685
|
| [10] |
M. A. Kamarposhti, I. Colak, K. Eguchi, Optimal energy management of distributed generation in micro-grids using artificial bee colony algorithm, Math. Biosci. Eng., 18 (2021), 7402-7418. https://doi.org/10.3934/mbe.2021366 doi: 10.3934/mbe.2021366
|
| [11] |
J. Liu, G. Ren, J. Wan, Y. Guo, D. Yu, Variogram time-series analysis of wind speed, Renewable Energy, 99 (2016), 483-491. https://doi.org/10.1016/j.renene.2016.07.013 doi: 10.1016/j.renene.2016.07.013
|
| [12] |
Y. Guo, Q. Wang, D. Zhang, J. Wan, D. Yu, J. Yu, Anticipatory AGC control strategy based on wind power variogram characteristic, IET Renewable Power Gen., 14 (2020), 1124-1133. https://doi.org/10.1049/iet-rpg.2019.0723 doi: 10.1049/iet-rpg.2019.0723
|
| [13] |
J. Kiviluoma, H. Holttinen, D. Weir, R. Scharff, L. Soder, N. Menemenlis, et al., Variability in large-scale wind power generation, Wind Energy, 19 (2016), 1649-1665. https://doi.org/10.1002/we.1942 doi: 10.1002/we.1942
|
| [14] |
C. Wang, J. Tang, B. Jiang, Z. Wu. Sliding-mode variable structure control for complex automatic systems: a survey, Math. Biosci. Eng., 19 (2022), 2616-2640. https://doi.org/10.3934/mbe.2022120 doi: 10.3934/mbe.2022120
|
| [15] |
H. Zhao, Q. Wu, Q. Guo, H. Sun, Y. Xue, Distributed model predictive control of a wind farm for optimal active power controlpart ii: implementation with clustering-based piece-wise affine wind turbine model, IEEE Trans. Sustain. Energ., 6 (2015), 840-849. https://doi.org/10.1109/TSTE.2015.2418281 doi: 10.1109/TSTE.2015.2418281
|
| [16] |
H. Jiang, J. Lin, Y. Song, D. J. Hill, MPC-based frequency control with demand-side participation: a case study in an isolated wind-aluminum power system, IEEE Trans. Power Syst., 30 (2015), 3327-3337. https://doi.org/10.1109/TPWRS.2014.2375918 doi: 10.1109/TPWRS.2014.2375918
|
| [17] |
X. Kong, X. Liu, L. Ma and K. Y. Lee, Hierarchical distributed model predictive control of standalone wind/solar/battery power system, IEEE Trans. Syst. Man Cybernetics Syst., 49 (2019), 1570-1581. https://doi.org/10.1109/TSMC.2019.2897646 doi: 10.1109/TSMC.2019.2897646
|
| [18] |
J. C. Sánchez, O. Marjanovic, M. Barnes, P. R. Green, Secondary model predictive control architecture for VSC-HVDC networks interfacing wind power, IEEE Trans. Power Del., 35 (2020), 2329-2341. https://doi.org/10.1109/TPWRD.2020.2966325 doi: 10.1109/TPWRD.2020.2966325
|
| [19] |
S. Desai, N. R. Sabar, R. Alhadad, A. Mahmood, Naveen Chilamkurti, Mitigating consumer privacy breach in smart grid using obfuscation-based generative adversarial network, Math. Biosci. Eng., 19 (2022), 3350-3368. https://doi.org/10.3934/mbe.2022155 doi: 10.3934/mbe.2022155
|
| [20] |
F. M. Butt, L. Hussain, A. Mahmood, K. Lone, Artificial intelligence based accurately load forecasting system to forecast short and medium-term load demands, Math. Biosci. Eng., 18 (2021), 400-425. https://doi.org/10.3934/mbe.2021022 doi: 10.3934/mbe.2021022
|


Figures(7)

Qi Wang, Yufeng Guo, Dongrui Zhang, Yingwei Wang, Ying Xu, Jilai Yu. Research on wind farm participating in AGC based on wind power variogram characteristics[J]. Mathematical Biosciences and Engineering, 2022, 19(8): 8288-8303. doi: 10.3934/mbe.2022386


 DownLoad: