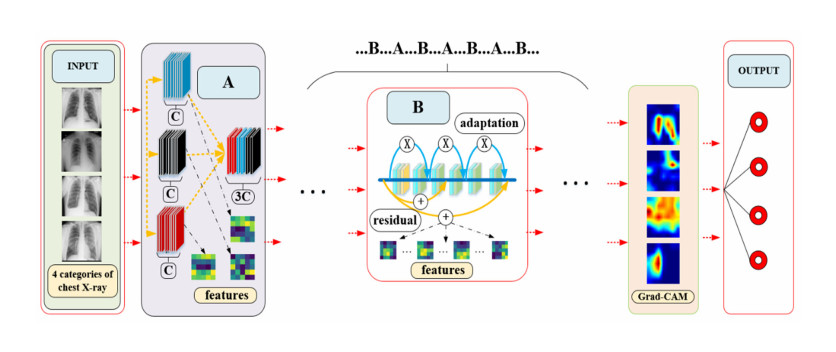
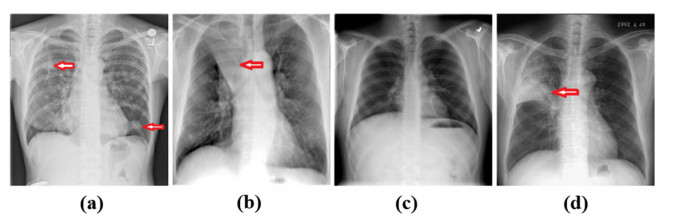
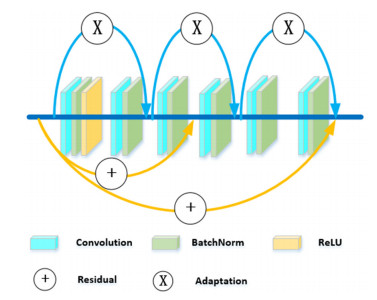
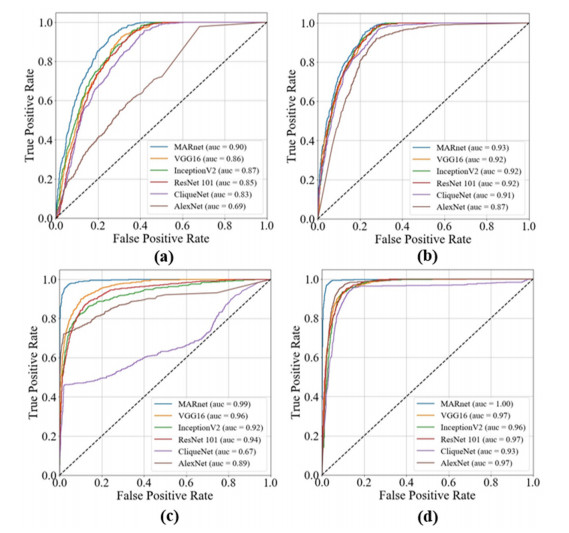
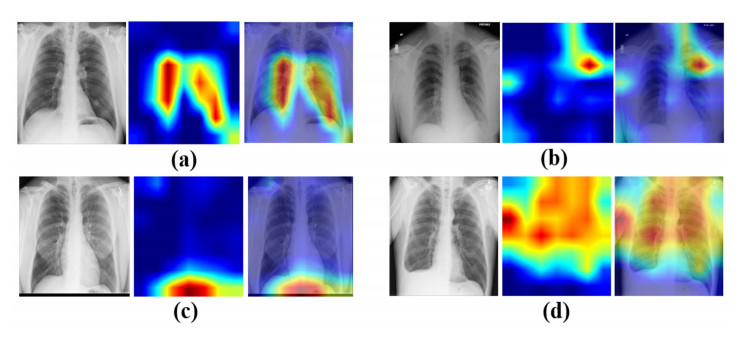
Chest X-ray image is an important clinical diagnostic reference to lung diseases that is a serious threat to human health. At present, with the rapid development of computer vision and deep learning technology, many scholars have carried out the fruitful research on how to build a valid model for chest X-ray images recognition of lung diseases. While some efforts are still expected to improve the performance of the recognition model and enhance the interpretability of the recognition results. In this paper, we construct a multi-scale adaptive residual neural network (MARnet) to identify chest X-ray images of lung diseases. To make the model better extract image features, we cross-transfer the information extracted by residual block and the information extracted by adaptive structure to different layer, avoiding the reduction effect of residual structure on adaptive function. We compare MARnet with some classical neural networks, and the results show that MARnet achieves accuracy (ACC) of 83.3% and the area under ROC curve (AUC) of 0.97 in the identification of 4 kinds of typical lung X-ray images including nodules, atelectasis, normal and infection, which are higher than those of other methods. Moreover, to avoid the randomness of the train-test-split method, 5-fold cross-validation method is used to verify the generalization ability of the MARnet model and the results are satisfactory. Finally, the technique called Gradient-weighted Class Activation Mapping (Grad-CAM), is adopted to display significantly the discriminative regions of the images in the form of the heat map, which provides an explainable and more direct clinical diagnostic reference to lung diseases.
Citation: Boyang Wang, Wenyu Zhang. MARnet: multi-scale adaptive residual neural network for chest X-ray images recognition of lung diseases[J]. Mathematical Biosciences and Engineering, 2022, 19(1): 331-350. doi: 10.3934/mbe.2022017
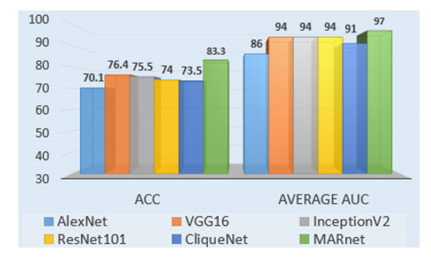
Chest X-ray image is an important clinical diagnostic reference to lung diseases that is a serious threat to human health. At present, with the rapid development of computer vision and deep learning technology, many scholars have carried out the fruitful research on how to build a valid model for chest X-ray images recognition of lung diseases. While some efforts are still expected to improve the performance of the recognition model and enhance the interpretability of the recognition results. In this paper, we construct a multi-scale adaptive residual neural network (MARnet) to identify chest X-ray images of lung diseases. To make the model better extract image features, we cross-transfer the information extracted by residual block and the information extracted by adaptive structure to different layer, avoiding the reduction effect of residual structure on adaptive function. We compare MARnet with some classical neural networks, and the results show that MARnet achieves accuracy (ACC) of 83.3% and the area under ROC curve (AUC) of 0.97 in the identification of 4 kinds of typical lung X-ray images including nodules, atelectasis, normal and infection, which are higher than those of other methods. Moreover, to avoid the randomness of the train-test-split method, 5-fold cross-validation method is used to verify the generalization ability of the MARnet model and the results are satisfactory. Finally, the technique called Gradient-weighted Class Activation Mapping (Grad-CAM), is adopted to display significantly the discriminative regions of the images in the form of the heat map, which provides an explainable and more direct clinical diagnostic reference to lung diseases.

| [1] |
A. Bhandary, G. A. Prabhu, V. Rajinikanth, K. P. Thanaraj, S. C. Satapathy, D. E. Robbins, et al., Deep-learning framework to detect lung abnormality a study with chest X-Ray and lung CT scan images, Pattern Recognit. Lett., 129 (2020), 271-278. doi: 10.1016/j.patrec.2019.11.013. doi: 10.1016/j.patrec.2019.11.013

|
| [2] |
T. Han, V. X. Nunes, L. F. De Freitas Souza, A. G. Marques, I. C. L. Silva, M. A. A. F. Junior, et al., Internet of medical things-based on deep learning techniques for segmentation of lung and stroke regions in CT scans, IEEE Access, 8 (2020), 71117-71135. doi: 10.1109/ACCESS.2020.2987932. doi: 10.1109/ACCESS.2020.2987932
|
| [3] | S. Kumar, P. Singh, M. Ranjan, A review on deep learning based pneumonia detection systems, in Proceedings-International Conference on Artificial Intelligence and Smart Systems, ICAIS, (2021), 289-296. doi: 10.1109/ICAIS50930.2021.9395868. |
| [4] | W. S. U. S. Krimsky, Induced Atelectasis and Pulmonary Consolidation Systems and Methods, 2019. Available from: https://patentimages.storage.googleapis.com/d1/1e/27/edb84321a9bb25/US10448886.pdf. |
| [5] |
C. A. de Pinho Pinheiro, N. Nedjah, L. de Macedo Mourelle, Detection and classification of pulmonary nodules using deep learning and swarm intelligence, Multimedia Tools Appl., 79 (2020), 15437-15465. doi: 10.1007/s11042-019-7473-z. doi: 10.1007/s11042-019-7473-z
|
| [6] |
D. Brenner, J. McLaughlin, R. Hung, Previous lung diseases and lung cancer risk: a systematic review and meta-analysis, PLoS One, 6 (2011). doi: 10.1371/journal.pone.0017479. doi: 10.1371/journal.pone.0017479
|
| [7] |
A. Krizhevsky, I. Sutskever, G. E. Hinton, ImageNet classification with deep convolutional neural networks, Commun. ACM, 60 (2017), 84-90. doi: 10.1145/3065386. doi: 10.1145/3065386
|
| [8] |
O. Russakovsky, J. Deng, H. Su, J. Krause, S. Satheesh, S. Ma, et al., ImageNet large scale visual recognition challenge, Int. J. Comput. Vision, 115 (2015), 211-252. doi: 10.1007/s11263-015-0816-y. doi: 10.1007/s11263-015-0816-y
|
| [9] |
L. Zhang, P. Yang, H. Feng, Q. Zhao, H. Liu, Using network distance analysis to predict lncRNA-miRNA interactions, Interdiscip Sci., 13 (2021), 535-545. doi: 10.1007/s12539-021-00458-z. doi: 10.1007/s12539-021-00458-z
|
| [10] |
P. P. Sun, Y. B. Chen, B. Liu, Y. X. Gao, Y. Han, F. He, et al., DeepMRMP: a new predictor for multiple types of RNA modification sites using deep learning, Math. Biosci. Eng., 16 (2019), 6231-6241. doi: 10.3934/mbe.2019310. doi: 10.3934/mbe.2019310
|
| [11] |
X. Y. Wang, H. Wang, S. Z. Niu, J. W. Zhang, Detection and localization of image forgeries using improved mask regional convolutional neural network, Math. Biosci. Eng., 16 (2019), 4581-4593. doi: 10.3934/mbe.2019229. doi: 10.3934/mbe.2019229
|
| [12] | K. He, X. Zhang, S. Ren, J. Sun, Deep residual learning for image recognition, in Proceedings of the IEEE Computer Society Conference on Computer Vision and Pattern Recognition, IEEE, (2016), 770-778. doi: 10.1109/CVPR.2016.90. |
| [13] |
P. Wang, E. Fan, P. Wang, Comparative analysis of image classification algorithms based on traditional machine learning and deep learning, Pattern Recognit. Lett., 141 (2021), 61-67. doi: 10.1016/j.patrec.2020.07.042. doi: 10.1016/j.patrec.2020.07.042
|
| [14] |
S. Zeng, Y. Cao, Q. Lin, Z. Man, T. Deng, R. Wang, Deep learning SPECT lung perfusion image classification method based on attention mechanism, J. Phys. Conf. Ser., 1748 (2021). doi: 10.1088/1742-6596/1748/4/042050. doi: 10.1088/1742-6596/1748/4/042050
|
| [15] | T. K. K. Ho, J. Gwak, O. Prakash, J. I. Song, C. M. Park, Utilizing pretrained deep learning models for automated pulmonary tuberculosis detection using chest radiography, in Intelligent Information and Database Systems, Springer, 11432 (2019), 395-403. doi: 10.1007/978-3-030-14802-7_34. |
| [16] | R. Zhang, M. Sun, S. Wang, K. Chen, Computed Tomography Pulmonary Nodule Detection Method Based on Deep Learning, 2021. Available from: https://patentimages.storage.googleapis.com/9c/00/cc/4c302cd759496a/US10937157.pdf. |
| [17] |
C. Tong, B. Liang, Q. Su, M. Yu, J. Hu, A. K. Bashir, et al., Pulmonary nodule classification based on heterogeneous features learning, IEEE J. Sel. Areas Commun., 39 (2021), 574-581. doi: 10.1109/JSAC.2020.3020657. doi: 10.1109/JSAC.2020.3020657
|
| [18] |
J. H. Lee, H. Y. Sun, S. Park, H. Kim, E. J. Hwang, J. M. Goo, et al., Performance of a deep learning algorithm compared with radiologic interpretation for lung cancer detection on chest radiographs in a health screening population, Radiology, 297 (2020). doi: 10.1148/radiol.2020201240. doi: 10.1148/radiol.2020201240
|
| [19] |
A. Hosny, C. Parmar, T. P. Coroller, P. Grossmann, R. Zeleznik, A. Kumar, et al., Deep learning for lung cancer prognostication: a retrospective multi-cohort radiomics study, PLoS Med., 15 (2018). doi: 10.1371/journal.pmed.1002711. doi: 10.1371/journal.pmed.1002711
|
| [20] |
M. Masud, N. Sikder, A. A. Nahid, A. K. Bairagi, M. A. Alzain, A machine learning approach to diagnosing lung and colon cancer using a deep learningbased classification framework, Sensors (Basel), 21 (2021), 1-21. doi: 10.3390/s21030748. doi: 10.3390/s21030748
|
| [21] |
G. Liang, L. Zheng, A transfer learning method with deep residual network for pediatric pneumonia diagnosis, Comput. Methods Programs Biomed., 187 (2020). doi: 10.1016/j.cmpb.2019.06.023. doi: 10.1016/j.cmpb.2019.06.023
|
| [22] | X. Wei, Y. Chen, Z. Zhang, Comparative experiment of convolutional neural network (CNN) models based on pneumonia X-ray images detection, in Proceedings-2020 2nd International Conference on Machine Learning, Big Data and Business Intelligence, MLBDBI, (2020), 449-454. doi: 10.1109/MLBDBI51377.2020.00095. |
| [23] | L. Račić, T. Popovic, S. Caki, S. Sandi, Pneumonia Detection Using Deep Learning Based on Convolutional Neural Network, in 2021 25th International Conference on Information Technology, (2021), 1-4. doi: 10.1109/IT51528.2021.9390137. |
| [24] |
A. G. Taylor, C. Mielke, J. Mongan, Automated detection of moderate and large pneumothorax on frontal chest X-rays using deep convolutional neural networks: a retrospective study, PLoS Med., 15 (2018). doi: 10.1371/journal.pmed.1002697. doi: 10.1371/journal.pmed.1002697
|
| [25] |
S. Roy, W. Menapace, S. Oei, B. Luijten, E. Fini, C. Saltori, et al., Deep learning for classification and localization of COVID-19 markers in point-of-care lung ultrasound, IEEE Trans. Med. Imaging, 39 (2020), 2676-2687. doi: 10.1109/TMI.2020.2994459. doi: 10.1109/TMI.2020.2994459
|
| [26] |
T. Hu, K. Mohammad, M. Mokhtar, P. Gholam-Reza, T. K. Sarkhel H, R. Tarik A, Real‑time COVID-19 diagnosis from X-Ray images using deep CNN and extreme learning machines stabilized by chimp optimization algorithm, Biomed. Signal Process. Control, 68 (2021). doi: 10.1016/j.bspc.2021.102764. doi: 10.1016/j.bspc.2021.102764
|
| [27] |
M. A. Khan, S. Kadry, Y. D. Zhang, T. Akram, M. Sharif, A. Rehman, et al., Prediction of COVID-19-pneumonia based on selected deep features and one class kernel extreme learning machine, Comput. Electr. Eng., 90 (2021). doi: 10.1016/j.compeleceng.2020.106960. doi: 10.1016/j.compeleceng.2020.106960
|
| [28] |
G. B. Kim, K. H. Jung, Y. Lee, H. J. Kim, N. Kim, S. Jun, et al., Comparison of shallow and deep learning methods on classifying the regional pattern of diffuse lung disease, J. Digit. Imaging, 31 (2018), 415-424. doi: 10.1007/s10278-017-0028-9. doi: 10.1007/s10278-017-0028-9
|
| [29] | R. Sivaramakrishnan, S. Antani, S. Candemir, Z. Xue, J. Abuya, M. Kohli, et al., Comparing deep learning models for population screening using chest radiography, in SPIE Medical Imaging 2018: Computer-Aided Diagnosis, Houston, Texas, USA, 10575 (2018). doi: 10.1117/12.2293140. |
| [30] |
C. A. de Pinho Pinheiro, N. Nedjah, L. de Macedo Mourelle, Detection and classification of pulmonary nodules using deep learning and swarm intelligence, Multimed. Tools Appl., 79 (2019), 15437-15465. doi: 10.1007/s11042-019-7473-z. doi: 10.1007/s11042-019-7473-z
|
| [31] |
X. Yiwen, H. Ahmed, Z. Roman, P. Chintan, C. Thibaud, F. Idalid, et al., Deep learning predicts lung cancer treatment response from serial medical imaging, Clin. Cancer Res., 25 (2019). doi: 10.1158/1078-0432.CCR-18-2495. doi: 10.1158/1078-0432.CCR-18-2495
|
| [32] |
K. C. Chen, H. R. Yu, W. S. Chen, W. C. Lin, Y. C. Lee, H. H. Chen, et al., Diagnosis of common pulmonary diseases in children by X-ray images and deep learning, Sci. Rep., 10 (2020), 17374. doi: 10.1038/s41598-020-73831-5. doi: 10.1038/s41598-020-73831-5
|
| [33] |
P. Rajpurkar, J. Irvin, R. L. Ball, K. Zhu, B. Yang, H. Mehta, et al., Deep learning for chest radiograph diagnosis: a retrospective comparison of the CheXNeXt algorithm to practicing radiologists, PLoS Med., 15 (2018). doi: 10.1371/journal.pmed.1002686. doi: 10.1371/journal.pmed.1002686
|
| [34] | A. I. Aviles-Rivero, N. Papadakis, R. Li, P. Sellars, Q. Fan, R. T. Tan, et al., GraphX NET-chest X-Ray classification under extreme minimal supervision, in Medical Image Computing and Computer Assisted Intervention-MICCAI 2019-22nd International Conference, (2019). doi: 10.1007/978-3-030-32226-7_56. |
| [35] | X. Wang, Y. Peng, L. Lu, Z. Lu, R. M. Summers, TieNet: text-image embedding network for common thorax disease classification and reporting in chest X-rays, in Proceedings of the IEEE Computer Society Conference on Computer Vision and Pattern Recognition, (2018), 9049-9058. doi: 10.1109/CVPR.2018.00943. |
| [36] |
S. Xu, H. Wu, R. Bie, CXNet-m1: anomaly detection on chest X-rays with image-based deep learning, IEEE Access, 7 (2019), 4466-4477. doi: 10.1109/ACCESS.2018.2885997. doi: 10.1109/ACCESS.2018.2885997
|
| [37] |
J. Zhao, M. Li, W. Shi, Y. Miao, Z. Jiang, B. Ji, A deep learning method for classification of chest X-ray images, J. Phys. Conf. Ser., 1848 (2021). doi: 10.1088/1742-6596/1848/1/012030. doi: 10.1088/1742-6596/1848/1/012030
|
| [38] |
T. K. K. Ho, J. Gwak, Utilizing knowledge distillation in deep learning for classification of chest X-ray abnormalities, IEEE Access, 8 (2020), 160749-160761. doi: 10.1109/ACCESS.2020.3020802. doi: 10.1109/ACCESS.2020.3020802
|
| [39] |
I. Sirazitdinov, M. Kholiavchenko, T. Mustafaev, Y. Yixuan, R. Kuleev, B. Ibragimov, Deep neural network ensemble for pneumonia localization from a large-scale chest x-ray database, Comput. Electr. Eng., 78 (2019), 388-399. doi: 10.1109/ACCESS.2020.3020802. doi: 10.1109/ACCESS.2020.3020802
|
| [40] |
J. Hu, L. Shen, S. Albanie, G. Sun, E. Wu, Squeeze-and-excitation networks, IEEE Trans. Pattern Anal. Mach. Intell., 42 (2020), 2011-2023. doi: 10.1109/TPAMI.2019.2913372. doi: 10.1109/TPAMI.2019.2913372
|
| [41] |
R. R. Selvaraju, M. Cogswell, A. Das, R. Vedantam, D. Parikh, D. Batra, Grad-CAM: visual explanations from deep networks via gradient-based localization, Int. J. Comput. Vision, 128 (2020), 336-359. doi: 10.1109/ICCV.2017.74. doi: 10.1109/ICCV.2017.74
|
| [42] |
N. L. Ramo, K. L. Troyer, C. M. Puttlitz, Comparing predictive accuracy and computational costs for viscoelastic modeling of spinal cord tissues, J. Biomech. Eng., 141 (2019). doi: 10.1115/1.4043033. doi: 10.1115/1.4043033
|
| [43] | D. M. Powers, Evaluation: from precision, recall and f-measure to ROC, informedness, markedness and correlation, J. Mach. Learn. Technol., 2 (2011), 2229-3981. Available from: http://hdl.handle.net/2328/27165. |
| [44] |
T. Fawcett, An introduction to ROC analysis, Pattern Recognit. Lett., 27 (2006), 861-874. doi: 10.1016/j.patrec.2005.10.010. doi: 10.1016/j.patrec.2005.10.010
|
| [45] | C. X. Ling, J. Huang, H. Zhang, AUC: a better measure than accuracy in comparing learning algorithms, in Advances in Artificial Intelligence, 16th Conference of the Canadian Society for Computational Studies of Intelligence, AI 2003, Halifax, Canada, 2003. doi: 10.1007/3-540-44886-1_25. |
| [46] | K. Simonyan, A. Zisserman, Very deep convolutional networks for large-scale image recognition, in 3rd International Conference on Learning Representations, ICLR 2015-Conference Track Proceedings, (2015). arXiv: 1409.1556. |
| [47] |
C. Szegedy, W. Liu, Y. Jia, P. Sermanet, S. Reed, D. Anguelov, et al., Going deeper with convolutions, IEEE Comput. Soc., (2015), 1-9. doi: 10.1109/CVPR.2015.7298594. doi: 10.1109/CVPR.2015.7298594
|
| [48] | Y. Yang, Z. Zhong, T. Shen, Z. Lin, Convolutional neural networks with alternately updated clique, in Proceedings of the IEEE Computer Society Conference on Computer Vision and Pattern Recognition, (2018), 2413-2422. doi: 10.1109/CVPR.2018.00256. |
| [49] |
G. Zeng, On the confusion matrix in credit scoring and its analytical properties, Commun. Stat. Theory Methods, 49 (2020), 2080-2093. doi: 10.1080/03610926.2019.1568485. doi: 10.1080/03610926.2019.1568485
|
Figures(10) / Tables(5)

Boyang Wang, Wenyu Zhang. MARnet: multi-scale adaptive residual neural network for chest X-ray images recognition of lung diseases[J]. Mathematical Biosciences and Engineering, 2022, 19(1): 331-350. doi: 10.3934/mbe.2022017


 DownLoad: