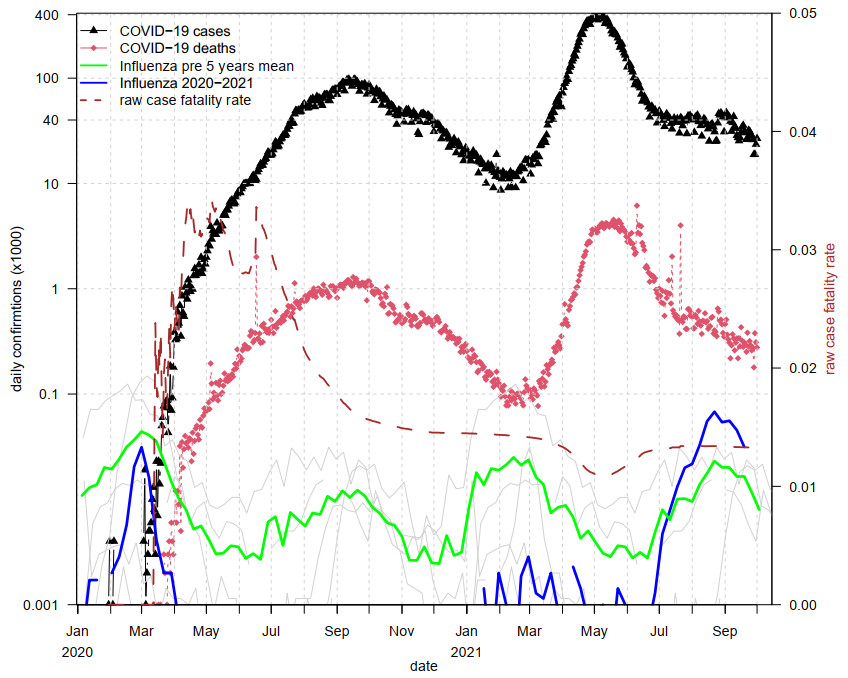
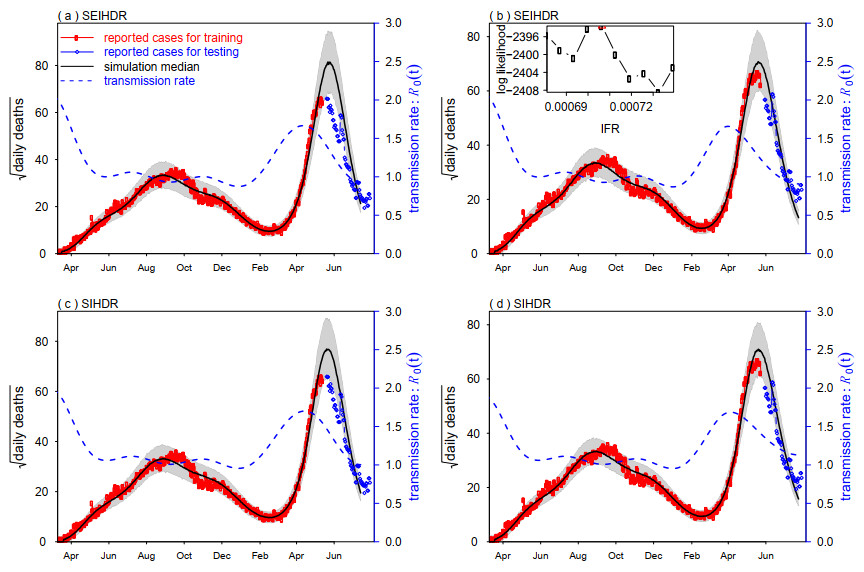
By February 2021, the overall impact of the COVID-19 pandemic in India had been relatively mild in terms of total reported cases and deaths. Surprisingly, the second wave in early April becomes devastating and attracts worldwide attention. Multiple factors (e.g., Delta variants with increased transmissibility) could have driven the rapid growth of the epidemic in India and led to a large number of deaths within a short period. We aim to reconstruct the transmission rate, estimate the infection fatality rate and forecast the epidemic size. We download the reported COVID-19 mortality data in India and formulate a simple mathematical model with a flexible transmission rate. We use iterated filtering to fit our model to deaths data. We forecast the infection attack rate in a month ahead. Our model simulation matched the reported deaths well and is reasonably close to the results of the serological study. We forecast that the infection attack rate (IAR) could have reached 43% by July 24, 2021, under the current trend. Our estimated infection fatality rate is about 0.07%. Under the current trend, the IAR will likely reach a level of 43% by July 24, 2021. Our estimated infection fatality rate appears unusually low, which could be due to a low case to infection ratio reported in previous study. Our approach is readily applicable in other countries and with other types of data (e.g., excess deaths).
Citation: Haitao Song, Guihong Fan, Shi Zhao, Huaichen Li, Qihua Huang, Daihai He. Forecast of the COVID-19 trend in India: A simple modelling approach[J]. Mathematical Biosciences and Engineering, 2021, 18(6): 9775-9786. doi: 10.3934/mbe.2021479
By February 2021, the overall impact of the COVID-19 pandemic in India had been relatively mild in terms of total reported cases and deaths. Surprisingly, the second wave in early April becomes devastating and attracts worldwide attention. Multiple factors (e.g., Delta variants with increased transmissibility) could have driven the rapid growth of the epidemic in India and led to a large number of deaths within a short period. We aim to reconstruct the transmission rate, estimate the infection fatality rate and forecast the epidemic size. We download the reported COVID-19 mortality data in India and formulate a simple mathematical model with a flexible transmission rate. We use iterated filtering to fit our model to deaths data. We forecast the infection attack rate in a month ahead. Our model simulation matched the reported deaths well and is reasonably close to the results of the serological study. We forecast that the infection attack rate (IAR) could have reached 43% by July 24, 2021, under the current trend. Our estimated infection fatality rate is about 0.07%. Under the current trend, the IAR will likely reach a level of 43% by July 24, 2021. Our estimated infection fatality rate appears unusually low, which could be due to a low case to infection ratio reported in previous study. Our approach is readily applicable in other countries and with other types of data (e.g., excess deaths).

| [1] |
J. Rui, Y. Niu, Q. Wang, W. Zhang, Z. Chen, Z. Zhao, et al., Containing the transmission of COVID-19: A modelling study in 160 countries, Front. Med., 8 (2021), 701836. doi: 10.3389/fmed.2021.701836. doi: 10.3389/fmed.2021.701836

|
| [2] |
M. A. Andrews, B. Areekal, K. R. Rajesh, J. Krishnan, R. Suryakala, B. Krishnan, et al., First confirmed case of COVID-19 infection in India: A case report, Indian J. Med. Res., 151 (2020), 490–492. doi: 10.4103/ijmr.IJMR_2131_20. doi: 10.4103/ijmr.IJMR_2131_20
|
| [3] |
S. Kaushik, S. Kaushik, Y. Sharma, R. Kumar, J. P. Yadav, The Indian perspective of COVID-19 outbreak, Virus. Dis., 31 (2020), 146–153. doi: 10.1007/s13337-020-00587-x. doi: 10.1007/s13337-020-00587-x
|
| [4] | S. Biswas, India coronavirus: More than half of Mumbai slum-dwellers had Covid-19, 2020. Available from: https://www.bbc.com/news/world-asia-india-53576653. |
| [5] | India TV News Desk, India can control COVID-19 by Feb 2021, festive laxity can lead to 26 lakh cases in a month: Govt panel, 2020. Available from: https://www.indiatvnews.com/news/india/coronavirus-peak-in-india-over-can-be-controlled-by-february-2021-says-govt-appointed-panel-vidyasagar-657984. |
| [6] | Cov-lineages.org, PANGO lineages Lineage B.1.617. Available from: https://cov-lineages.org/lineages/lineage_B.1.617.html. |
| [7] |
A. Rambaut, E. C. Holmes, A. O'Toole, V. Hill, J. T. McCrone, C. Ruis, et al., A dynamic nomenclature proposal for SARS-CoV-2 lineages to assist genomic epidemiology, Nat. Microbiol., 5 (2020), 1403–1407. doi: 10.1038/s41564-020-0770-5. doi: 10.1038/s41564-020-0770-5
|
| [8] | World Health Organization (WHO), Weekly epidemiological update on COVID-19-27 April 2021. Available from: https://www.who.int/publications/m/item/weekly-epidemiological-update-on-covid-19---27-april-2021. |
| [9] | J. P. Sahoo, A. P. Mishra, K. C. Samal, Triple Mutant Bengal Strain (B. 1.618) of Coronavirus and the Worst COVID Outbreak in India, Biotica Res. Today, 3 (2021), 261–265. |
| [10] | World Health Organization (WHO), WHO Coronavirus (COVID-19) Dashboard. Available from: https://covid19.who.int/. |
| [11] | S. Biswas, India coronavirus: Delta plus India: Scientists say too early to tell risk of Covid-19 variant. BBC News, 2021. Available from: https://www.bbc.com/news/world-asia-india-57564560. |
| [12] | H. Ellyatt, Health and science: After being ravaged by the delta Covid variant, how is India doing now? CNBC, 2021. Available from: https://www.cnbc.com/2021/07/23/coronavirus-how-india-is-doing-now-after-delta-variant-spread.html. |
| [13] | M. Murhekar, T. Bhatnagar, S. Selvaraju, V. Saravanakumar, J. W. V. Thangaraj, N. Shah, et al., SARS-CoV-2 antibody prevalence in India: findings from the second nationwide household serosurvey, August-September 2020, Available at SSRN, 2020. doi: https://dx.doi.org/10.2139/ssrn.3715460. |
| [14] | J. Sriram, Podcast, Coronavirus update: ICMR's sero-surcey, the peak of COVID-19 in India, and new cases reported in Beijing. Available from: https://www.thehindu.com/podcast/coronavirus-update-icmrs-sero-survey-the-peak-of-covid-19-in-india-and-new-cases-reported-in-beijing/article31837397.ece. |
| [15] |
D. J. D. Earn, P. Rohani, B. M. Bolker, B. T. Grenfell, A simple model for complex dynamical transitions in epidemics, Science, 287 (2000), 667–670. doi: 10.1126/science.287.5453.667. doi: 10.1126/science.287.5453.667
|
| [16] | M. J. Keeling, P. Rohani, Modeling infectious diseases in humans and animals, Princeton university press, 2011. doi: 10.1515/9781400841035. |
| [17] | World Health Organization (WHO), FluNet. Available from: https://www.who.int/tools/flunet. |
| [18] |
Y. M. Bar-On, A. Flamholz, R. Phillips, R. Milo, Science Forum: SARS-CoV-2 (COVID-19) by the numbers, eLife, 9 (2020), e57309. doi: 10.7554/eLife.57309. doi: 10.7554/eLife.57309
|
| [19] |
J. Griffin, M. Casey, A. Collins, K. Hunt, D. McEvoy, A. Byrne, et al., Rapid review of available evidence on the serial interval and generation time of COVID-19, BMJ Open, 10 (2020), e040263. doi: 10.1136/bmjopen-2020-040263. doi: 10.1136/bmjopen-2020-040263
|
| [20] |
A. Svensson, A note on generation times in epidemic models, Math. Biosci., 208 (2007), 300–311. doi: 10.1016/j.mbs.2006.10.010. doi: 10.1016/j.mbs.2006.10.010
|
| [21] |
W. M. de Souza, L. F. Buss, D. da Silva Candido, J. P. Carrera, S. Li, A. E. Zarebskial, et al., Epidemiological and clinical characteristics of the COVID-19 epidemic in Brazil, Nat. Hum. Behav., 4 (2020), 856–865. doi: 10.1038/s41562-020-0928-4. doi: 10.1038/s41562-020-0928-4
|
| [22] |
X. Tang, S. S. Musa, S. Zhao, S. J. Mei, D. H. He, Using proper mean generation intervals in modeling of COVID-19, Front. Public Health, 9 (2021), 691262. doi: 10.3389/fpubh.2021.691262. doi: 10.3389/fpubh.2021.691262
|
| [23] |
D. He, S. Zhao, Q. Lin, S. S. Mus, L. Stone, New estimates of the Zika virus epidemic attack rate in Northeastern Brazil from 2015 to 2016: A modelling analysis based on Guillain-Barré Syndrome (GBS) surveillance data, PLOS Neglect. Trop. D., 14 (2020), e0007502. doi: 10.1371/journal.pntd.0007502. doi: 10.1371/journal.pntd.0007502
|
| [24] |
L. Stone, D. He, S. Lehnstaedt, Y. Artzy-Randrup, Extraordinary curtailment of massive typhus epidemic in the Warsaw Ghetto, Sci. Adv., 6 (2020), eabc0927. doi: 10.1126/sciadv.abc0927. doi: 10.1126/sciadv.abc0927
|
| [25] |
S. Zhao, L. Stone, D. Gao, D. H. He, Modelling the large-scale yellow fever outbreak in Luanda, Angola, and the impact of vaccination, PLOS Neglect. Trop. D., 12 (2018), e0006158. doi: 10.1371/journal.pntd.0006158. doi: 10.1371/journal.pntd.0006158
|
| [26] |
D. He, E. L. Ionides, A. A. King, Plug-and-play inference for disease dynamics: Measles in large and small populations as a case study, J. R. Soc. Interface, 7 (2010), 271–283. doi: 10.1098/rsif.2009.0151. doi: 10.1098/rsif.2009.0151
|
| [27] |
E. L. Ionides, C. Bretó, A. A. King, Inference for nonlinear dynamical systems, Proc. Natl. Acad. Sci., 103 (2006), 18438–18443. doi: 10.1073/pnas.0603181103. doi: 10.1073/pnas.0603181103
|
| [28] | Centers for Disease Control and Prevention (CDC), Excess Deaths Associated with COVID-19. Available from: https://www.cdc.gov/nchs/nvss/vsrr/covid19/excess_deaths.htm. |
| [29] | S. Huang, J. G. Xu, F. Wei, Z. Peng, Z. Jin, Y. M. Xu, et al., The epidemic in India remains on an upward trend, which may cause total of 200 million cases in the world 2021. Available from: https://riph.nankai.edu.cn/2021/0502/c23093a355929/pagem.htm. |
| [30] |
T. W. Russell, J. Hellewell, C. I. Jarvis, K. van Zandvoort, S. Abbott, R. Ratnayake, et al., Estimating the infection and case fatality ratio for coronavirus disease (COVID-19) using age-adjusted data from the outbreak on the Diamond Princess cruise ship, February 2020, Eurosurveillance, 25 (2020), 2000256. doi: 10.2807/1560-7917.ES.2020.25.12.2000256. doi: 10.2807/1560-7917.ES.2020.25.12.2000256
|
| [31] | M. Krishman, COVID in India: Is India counting all its Covid-19 deaths?, 2021. Available from: https://www.rfi.fr/en/international/20210722-is-india-counting-all-its-covid-19-deaths. |
| [32] | R. Ranjan, A. Sharma, M. K. Verma, Characterization of the Second Wave of COVID-19 in India, medRxiv, 2021. doi: 10.1101/2021.04.17.21255665. |
| [33] |
M. V. Murhekar, T. Bhatnagar, J. W. V. Thangaraj, V. Saravanakumar, M. S. Kumar, S. Selvaraju, et al., SARS-CoV-2 seroprevalence among the general population and healthcare workers in India, December 2020–January 2021, Int. J. Infect. Dis., 108 (2021), 145–155. doi: 10.1016/j.ijid.2021.05.040. doi: 10.1016/j.ijid.2021.05.040
|
| [34] | H. Song, G. Fan, Y. Liu, x. Y. Wang, D. H. He, The second wave of COVID-19 in South and Southeast Asia and vaccination effects, Research Square, 2021. doi: 10.21203/rs.3.rs-877949/v1. |
| [35] |
Q. Lin, A. P. Y. Chiu, S. Zhao, D. H. He, Modeling the spread of Middle East respiratory syndrome coronavirus in Saudi Arabia, Stat. Methods Med. Res., 27 (2018), 1968–1978. doi: 10.1177/0962280217746442. doi: 10.1177/0962280217746442
|
| [36] | M. Banaji, Estimating COVID-19 infection fatality rate in Mumbai during 2020, medRxiv, 2021. doi: 10.1101/2021.04.08.21255101. |


Figures(4)

Haitao Song, Guihong Fan, Shi Zhao, Huaichen Li, Qihua Huang, Daihai He. Forecast of the COVID-19 trend in India: A simple modelling approach[J]. Mathematical Biosciences and Engineering, 2021, 18(6): 9775-9786. doi: 10.3934/mbe.2021479


 DownLoad: