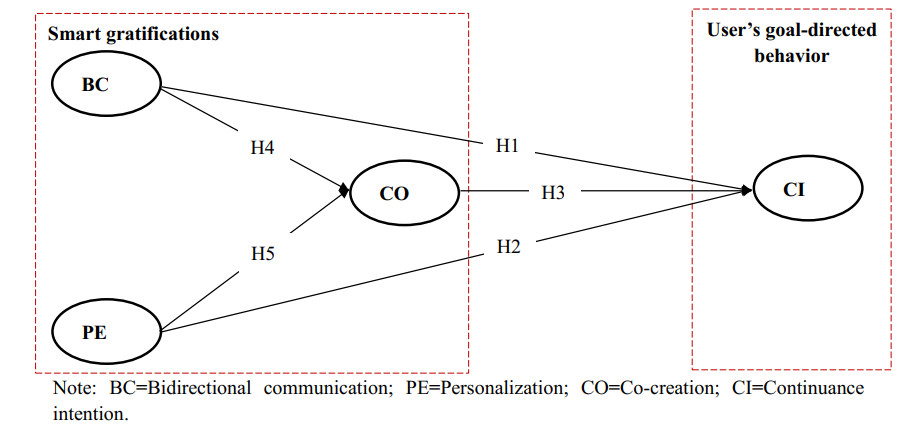
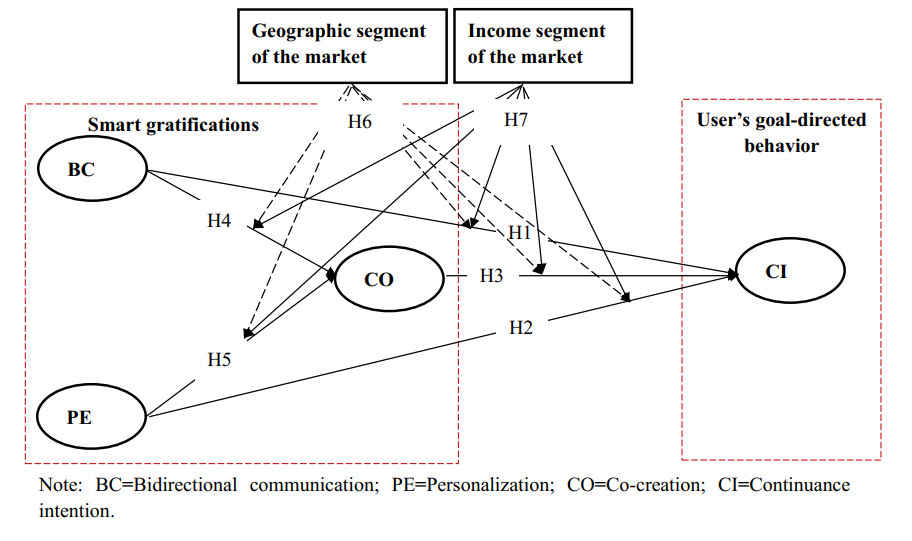
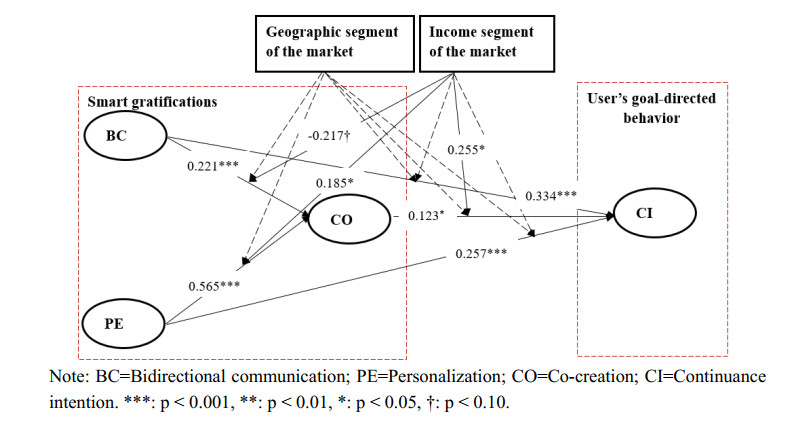
Smart media usage is influenced by certain critical factors and can be further affected by the degree of diffusion in the market. However, existing research lacks sufficient understanding of the factors affecting smart media usage and their influential mechanisms. Taking AI-enabled smart TV in China as the research object, this study (1) develops a base model that includes users' three key gratifications (bi-directional communication, personalization, and co-creation); and (2) takes two sub-dimensions of market development (geographic segment and income segment) as moderators. Using data from 407 valid samples of current users, the partial least squares structural equation modeling analysis suggests that these three key smart gratifications can impact continuance intention with the moderating effect of market development. This study thus contributes to the literature by (1) clarifying the smart media gratification opportunities (smart media users' motivations or needs) for using smart media itself; (2) exploring the impact of the degree of market development on the uses and gratifications of the smart media itself; and (3) combining the uses and gratifications theory, and the diffusion of innovations theory, to complement each other in a model that provides a more complete picture of smart media usage.
Citation: Biao Gao, Lin Huang. Toward a theory of smart media usage: The moderating role of smart media market development[J]. Mathematical Biosciences and Engineering, 2021, 18(6): 7218-7238. doi: 10.3934/mbe.2021357
Smart media usage is influenced by certain critical factors and can be further affected by the degree of diffusion in the market. However, existing research lacks sufficient understanding of the factors affecting smart media usage and their influential mechanisms. Taking AI-enabled smart TV in China as the research object, this study (1) develops a base model that includes users' three key gratifications (bi-directional communication, personalization, and co-creation); and (2) takes two sub-dimensions of market development (geographic segment and income segment) as moderators. Using data from 407 valid samples of current users, the partial least squares structural equation modeling analysis suggests that these three key smart gratifications can impact continuance intention with the moderating effect of market development. This study thus contributes to the literature by (1) clarifying the smart media gratification opportunities (smart media users' motivations or needs) for using smart media itself; (2) exploring the impact of the degree of market development on the uses and gratifications of the smart media itself; and (3) combining the uses and gratifications theory, and the diffusion of innovations theory, to complement each other in a model that provides a more complete picture of smart media usage.

| [1] | B. Gao, L. Huang, Understanding interactive user behavior in smart media content service: An integration of TAM and smart service belief factors, Heliyon, 12 (2019), 1-13. |
| [2] | Z. R. Hu, The future development direction of media: Constructing an all-media ecosystem, Chinese Broadcast. (In Chinese), 11 (2016), 48-52. |
| [3] |
E. Katz, M. Gurevitch, H. Haas, On the use of the mass media for important things, Am. Sociol. Rev., 38 (1973), 164-181. doi: 10.2307/2094393

|
| [4] | A. M. Rubin, Media uses and effects: A uses and gratifications perspective, in Media effects: Advances in theory and research (eds. J. Bryant and D. Zillmann), Lawrence Erlbaum Associates, Inc., (1994), 417-436. |
| [5] | T. E. Ruggiero, Uses and Gratifications Theory in the 21st Century, Mass Commun. Soc., 1 (2000), 3-37. |
| [6] | P. Palmgreen, Uses and gratifications: A theoretical perspective, in communication Yearbook 8 (eds. R. Bostrom), Sage, (1984), 20-55. |
| [7] |
I. C. W. Gogan, Z. Zhang, E. D. Matemba, Impacts of gratifications on consumers' emotions and continuance use intention: An empirical study of Weibo in China, Sustainability, 10 (2018), 3162. doi: 10.3390/su10093162
|
| [8] | J. Joo, Y. Sang, Exploring Koreans' smartphone usage: An integrated model of the technology acceptance model and uses and gratifications theory, Comput. Hum. Behav., 6 (2013), 2512-2518. |
| [9] | J. G. Blumler, The role of theory in uses and gratifications studies, Commun. Res., 1 (1979), 9-36. |
| [10] | P. Palmgreen, L. A. Wenner, J. D. Rayburn, Relations between gratifications sought and obtained a study of television news, Commun. Res., 2 (1980), 161-192. |
| [11] | L. Leung, Generational differences in content generation in social media: The roles of the gratifications sought and of narcissism, Comput. Hum. Behav., 3 (2013), 997-1006. |
| [12] | L. Hou, Supplement to the theory of " uses" in the theory of " uses and gratifications", Shandong audiovisual (In Chinese), 8 (2006). |
| [13] | M. Mcluhan, Understanding media: the extensions of man, MIT Press, (1964). |
| [14] | B. R. Kiran, I. Sobh, V. Talpaert, P. Mannion, A.A.A. Sallab, S. Yogamani, et al., Deep reinforcement learning for autonomous driving: A survey, IEEE T. Intell. Transp., (2020), 1-18. |
| [15] | B. Hogan, A. Quan-Haase, Persistence and change in social media, B. Sci. Technol. Soc., 5 (2010), 309-315. |
| [16] | S. Livingstone, The challenge of changing audiences or, what is the audience researcher to do in the age of the Internet?, Eur. J. Commun., 1 (2004), 75-86. |
| [17] | S. J. McMillan, J. S. Hwang, Measures of perceived interactivity: An exploration of the role of direction of communication, user control, and time in shaping perceptions of interactivity, J. Advert., 3 (2002), 29-42. |
| [18] | S. S. Sundar, S. Bellur, J. Oh, H. Jia, H.-S. Kim, Theoretical importance of contingency in human-computer interaction, Commun. Res., 5 (2014), 595-625. |
| [19] | R. P. Hawkins, M. Kreuter, K. Resnicow, M. Fishbein, A. Dijkstra, Understanding tailoring in communicating about health, Health Educ. Res., 3 (2008), 454-466. |
| [20] | L. Nahar, Z. Sultana, N. Iqbal, A. Chowdhury, Sentiment analysis and emotion extraction: A review of research paradigm, 1st International Conference on Advances in Science, Engineering and Robotics Technology (ICASERT), (2019). |
| [21] |
S. Kumar, M. Gahalawat, P. P. Roy, D. P. Dogra, B. G. Kim, Exploring impact of age and gender on sentiment analysis using machine learning, Electronics, 9 (2020), 374. doi: 10.3390/electronics9020374
|
| [22] |
D. Jeong, B. G. Kim, S. Y. Dong, Deep Joint Spatiotemporal Network (DJSTN) for efficient facial expression recognition, Sensors, 20 (2020), 1936. doi: 10.3390/s20071936
|
| [23] |
J. H. Kim, B. G. Kim, P. P. Roy, D. M. Jeong, Efficient facial expression recognition algorithm based on hierarchical deep neural network structure, IEEE Access, 7 (2019), 41273-41285. doi: 10.1109/ACCESS.2019.2907327
|
| [24] | S. Y. Ho, D. Bodoff, The effects of web personalization on user attitude and behavior: an integration of the elaboration likelihood model and consumer search theory, MIS Quart., 2 (2014), 497-520. |
| [25] |
J. Kim, A. Gambino, Do we trust the crowd or information system? Effects of personalization and bandwagon cues on users' attitudes and behavioral intentions toward a restaurant recommendation website, Comput. Hum. Behav., 65 (2016), 369-379. doi: 10.1016/j.chb.2016.08.038
|
| [26] | P. M. Napoli, Audience Evolution: New Technologies and the Transformation of Media Audiences, Columbia University Press, (2011). |
| [27] | X. Duan, L. Dai, Study on the relationship between experience quality, Co-created value and users' behavioral intention of making continuous contributions on internet UGC platforms, J. Serv. Sci. Manage., 2 (2018), 267-277. |
| [28] | D. Smallbone, R. Leig, D. North, The characteristics and strategies of high growth SMEs, Int. J. Entrep. Behav. Res., 3 (1995), 44-62. |
| [29] | S. F. Slater, J. C. Narver, Product-market strategy and performance: an analysis of the miles and snow strategy types, Eur. J. Market., 10 (1993), 33-51. |
| [30] | E. M. Rogers, Diffusion of innovations (1st ed.), Free Press of Glencoe, (1962). |
| [31] | E. Ferlie, L. Gabbay, L. Fitzgerald, L. Locock, S. Dopson, Organisational Behaviour and Organisational Studies in Health Care: Reflections on the Future, in Evidence-Based Medicine and Organisational Change: An Overview of Some Recent Qualitiative Research, 8 (eds. L. Ashburner), Palgrave, (2001). |
| [32] | B. Ryan, N. C. Gross, The diffusion of hybrid seed corn in two Iowa communities, Rural Sociol., 8 (1943), 15-24. |
| [33] | J. Suriãnach, C. Autant-Bernard, F. Manca, N. Massard, R. Moreno, The diffusion/adoption of innovation in the internal market, European Economy Economic Papers, (2009). |
| [34] | Forward-looking Industry Research Institute, China's smart home equipment industry market outlook and investment strategy planning report (In Chinese), (2020). |
| [35] | R. Likert, A technique for the measurement of attitudes, Arch. Psychol., 140 (1932), 44-53. |
| [36] | C. E. Osgood, G. J. Suci, P. Tannenbaum, The measurement of meaning, University of Illinois Press, (1957). |
| [37] | Y. J. Kim, J. Han, Why smartphone advertising attracts customers: A model of web advertising, flow, and personalization, Comput. Hum. Behav., 2 (2014), 256-269. |
| [38] |
E. F. Mathis, H. Kim, M. Uysal, J. M. Sirgy, N. K. Prebensen, The effect of co-creation experience on outcome variable, Annu. Tour. Res., 57 (2016), 62-75. doi: 10.1016/j.annals.2015.11.023
|
| [39] | A. Bhattacherjee, Understanding information system continuance: An expectation-confirmation model, MIS Quart., 3 (2001), 351-370. |
| [40] | V. Cho, A study of the roles of trusts and risks in information-oriented online legal services using an integrated model, Inform. Manag., 4 (2006), 502-520. |
| [41] | J. F. Hair, C. M. Ringle, M. Sarstedt, PLS-SEM: Indeed a silver bullet, J. Market. Theory Prac., 2 (2011), 139-152. |
| [42] | W. W. Chin, B. Marcolin, P. R. Newsted, A partial least squares latent variable modelling approach for measuring interaction effects: Results from a Monte Carlo simulation study and an electronic-mail emotion/adoption study, Inform. Syst. Res., 2 (2003), 189-217. |
| [43] | C. Fornell, D. F. Larcker, A Second Generation of Multivariate Analysis: Classification of Methods and Implication for Marketing Research, in Review of Marketing (eds. M. J. Houston), American Marketing Association, (1987), 407-450. |
| [44] | V. Venkatesh, J. Y. L. Thong, X. Xu, Consumer acceptance and use of Information technology: Extending the unified theory of acceptance and use of technology, MIS Quart., 1 (2012), 157-178. |
| [45] | J. F. Hair, C. M. Ringle, M. Sarstedt, Partial least squares structural equation modelling: Rigorous applications, better results and higher acceptance, Long Range Plann., 46 (2013), 1-12. |
| [46] | J. Henseler, C. M. Ringle, M. Sarstedt, Using partial least squares path modelling in advertising research: Basic concepts and recent issues. Handbook of Research on International Advertising, Edward Elgar Publishing, (2012). |
| [47] | J. Cohen, Statistical power analysis for the behavioural sciences (2nd ed.). Lawrence Erlbaum, (1988). |
| [48] | M. Tenenhaus, V. E. Vinzi, Y. M. Chatelin, C. Lauro, PLS path modeling, Comput. Stat. Data An., 1 (2005), 159-205. |
| [49] | C. Fornell, D. F. Larcker, Evaluating Structural Equation Models with unobservable variables and measurement error, J. Market. Res., 1 (1981), 39-50. |
| [50] | D. Croasdell, A. Mcleod, M. G. Simkin, Why don't more women major in information systems?, Inform. Technol. Peopl., 2 (2011), 158-183. |
| [51] | M. Wetzels, G. Odekerken-Schröder, C. Oppen, Using PLS path modelling for assessing hierarchical construct models: Guidelines and empirical illustration, MIS Quart., 1 (2009), 177-195. |
| [52] | M. Keil, B. C. Y. Tan, K. K. Wei, T. Saarinen, A Cross-Cultural Study on Escalation of Commitment Behavior in Software Projects, MIS Quart., 2 (2000), 299-325. |
| [53] | W. W. Chin, A. M. Mills, D. J. Steel, A. Schwarz, Multi-group invariance testing: An illustrative comparison of PLS permutation and covariance-based SEM invariance analysis, in The Multiple Facets of Partial Least Squares and Related Methods (eds. H. Abdi et al.), Springer International Publishing, (2016), 267-284. |
| [54] | S. E. Fawcett, C. Wallin, C. Allred, A. M. Fawcett, G. M. Magnan, Information technology as an enabler of supply chain collaboration: A dynamic-capabilities perspective, J. Supply Chain Manag., 1 (2011), 38-59. |
| [55] | M. Sarstedt, J. Henseler, C. M. Ringle, Multigroup analysis in partial least squares (PLS) path modeling: Alternative methods and empirical results. Adv. Int. Marketing, 1 (2011), 195-218. |
Figures(4) / Tables(8)

Biao Gao, Lin Huang. Toward a theory of smart media usage: The moderating role of smart media market development[J]. Mathematical Biosciences and Engineering, 2021, 18(6): 7218-7238. doi: 10.3934/mbe.2021357


 DownLoad: