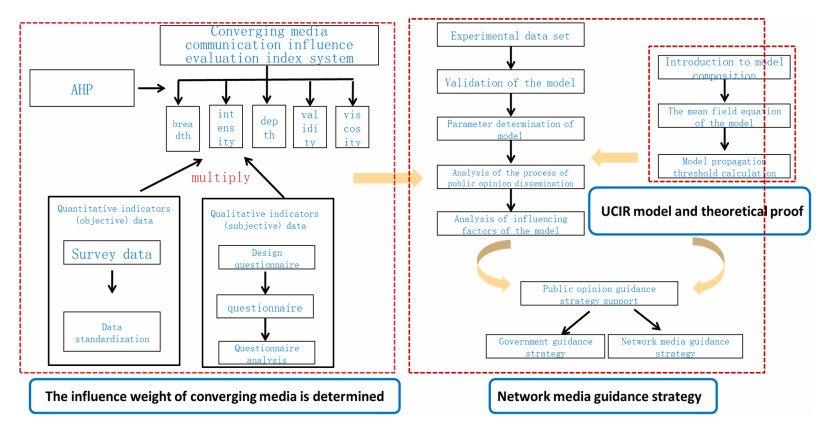
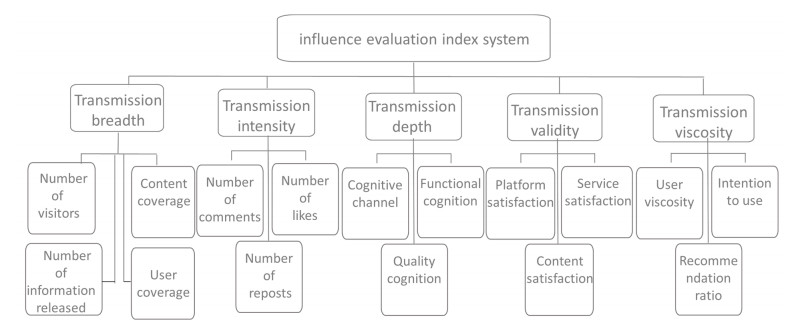
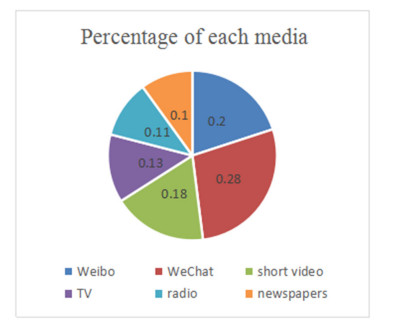
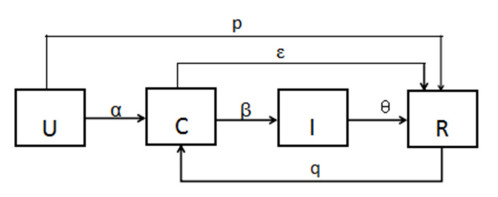
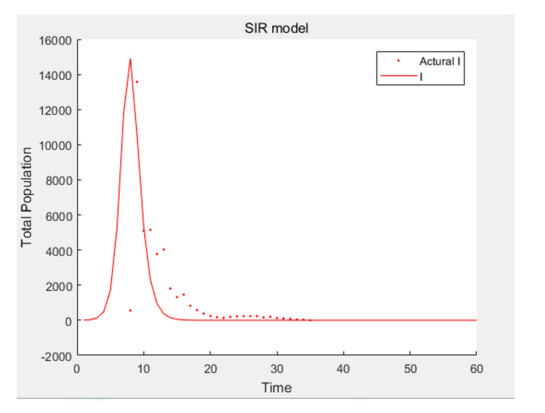
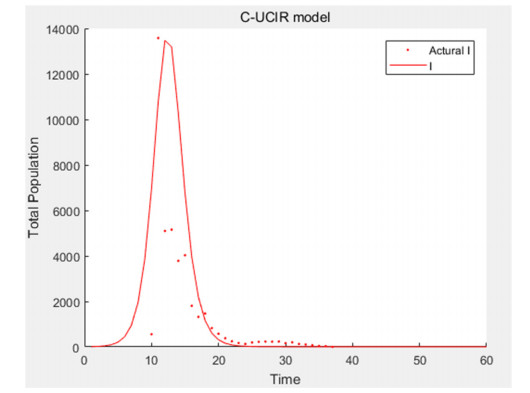
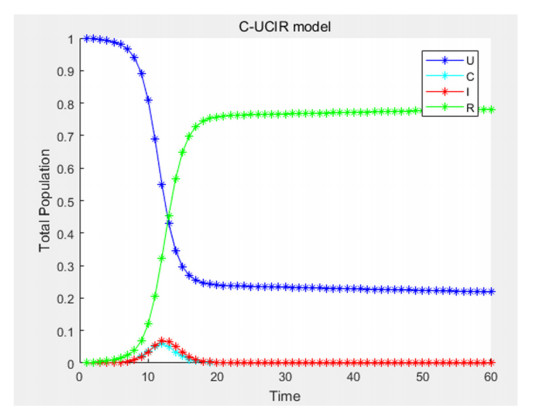
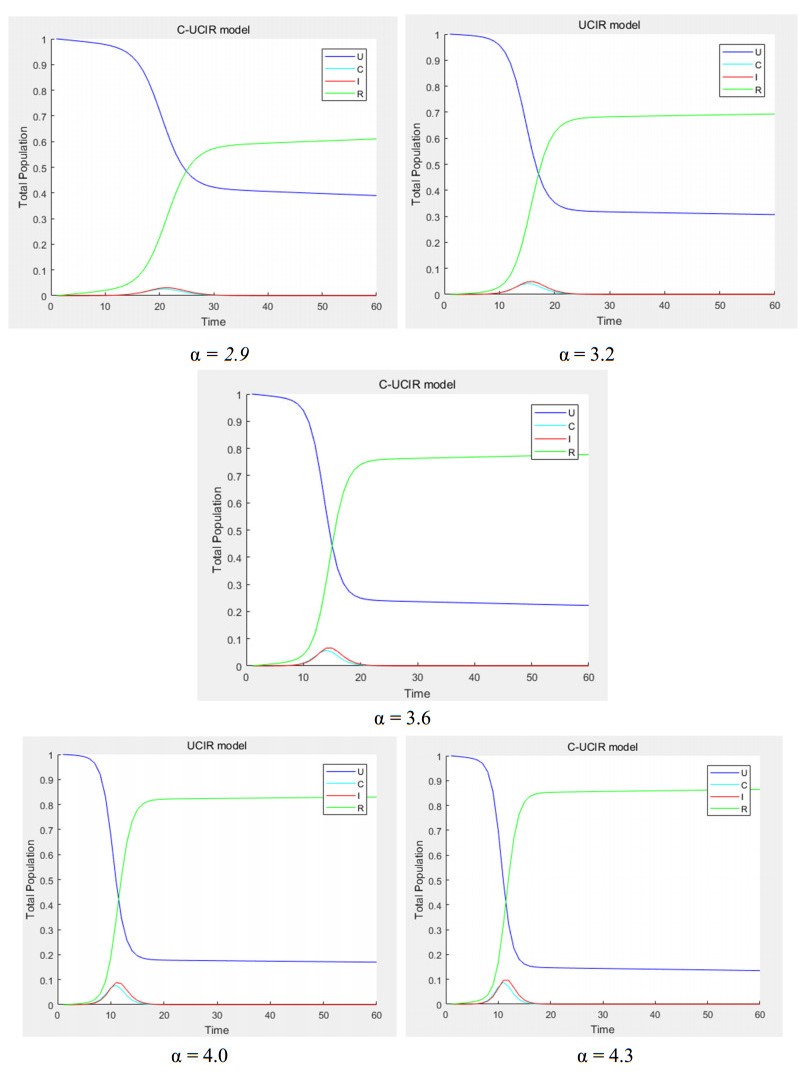
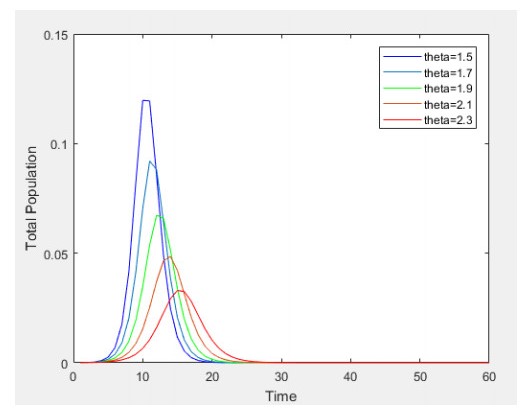
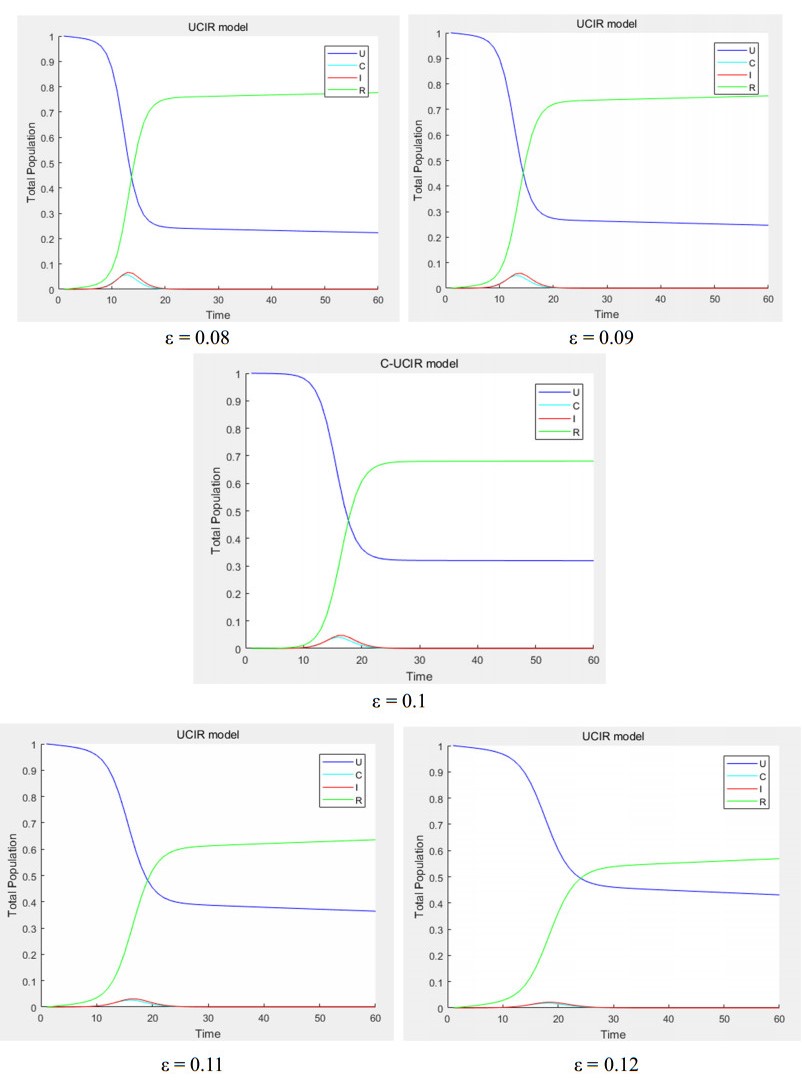
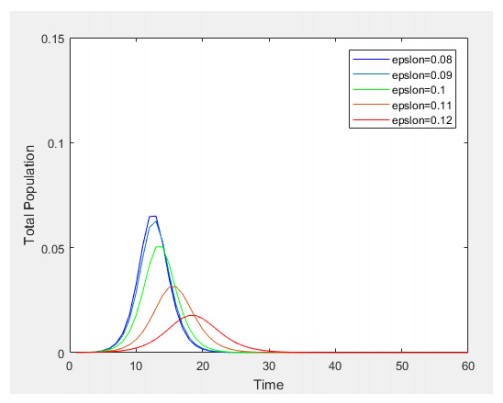
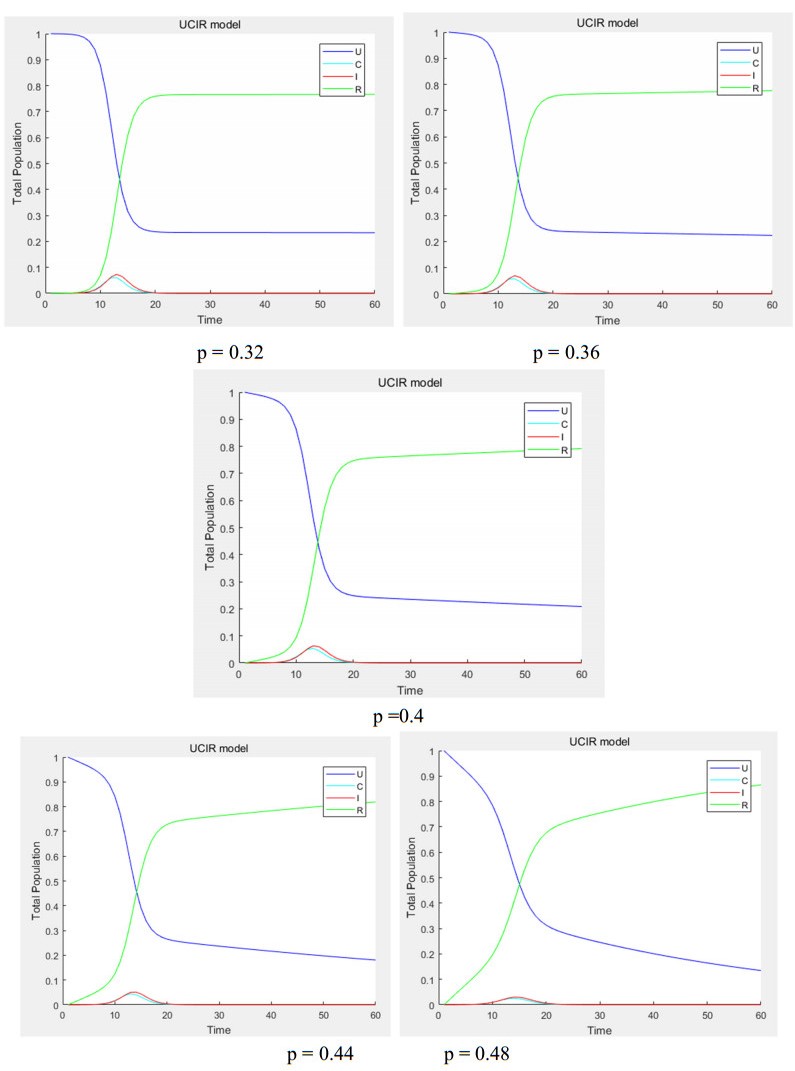
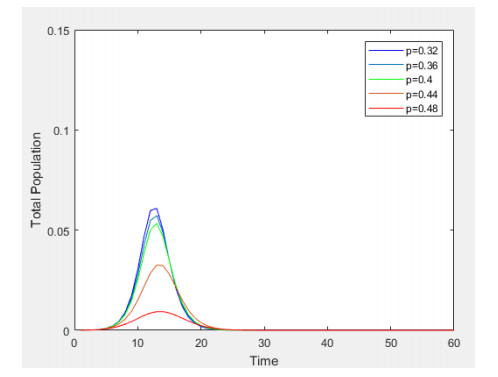
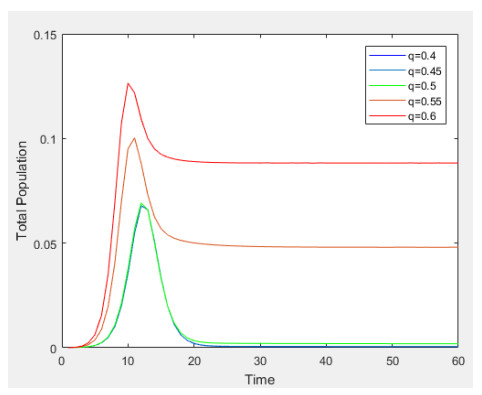
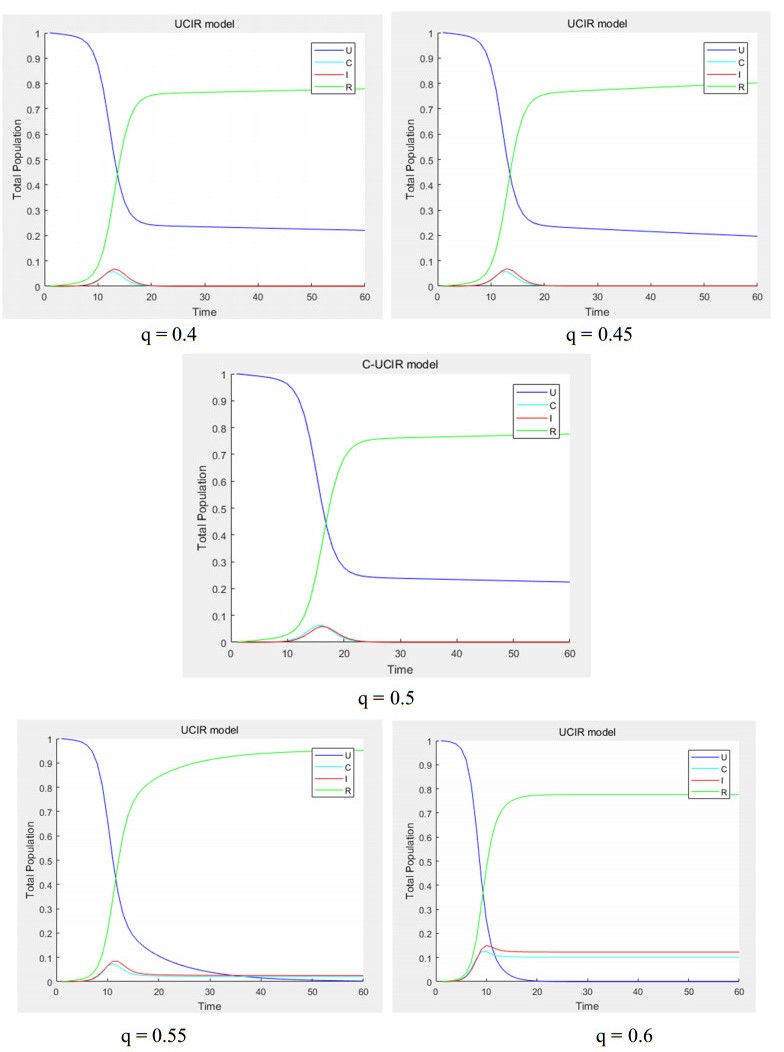
In the 5G era, media convergence and technological updates lead to tremendous changes in the dissemination of public opinion information. The guidance of public opinion in the converged media environment is a new research topic. Users participate in the discussion of different media, and flow in and out from different media, which gradually generate a new complex dynamics model of the dissemination of public opinion information. An index system for evaluating the influence of converged media communication that combines the advantages of traditional media and new media is constructed. We use AHP to determine the index weights in the evaluation system and conduct consistency tests. The final weight of each media is determined through the combination of subjective and objective methods, which provides data supports for later determining the participation of various media in the dissemination process of public opinion information. Based on the SIR model, a UCIR (unknown-contact-infected-recovered) dynamic model is established. The simulation results show that the root mean square error (RMSE) of the UCIR model is 31.6% lower than that of the SIR model. Finally, by fixing the key parameters α, β, θ, ε, p, q in the UCIR model, and changing only one of them, we studied the effect of the transition probability between different states on the process of public opinion information transmission, and then proposed corresponding guidance. In addition, from the two perspectives of network media and government, the countermeasures and suggestions for the guidance of public opinion are proposed. We try to solve the problems of humanities and social sciences with the method of natural science. These research results can provide theoretical and methodological support for people to understand the law of public opinion information transmission and establish a guiding mechanism for public opinion information transmission.
Citation: Jinbao Song, Xiaoya Zhu. Research on public opinion guidance of converging media based on AHP and transmission dynamics[J]. Mathematical Biosciences and Engineering, 2021, 18(5): 6857-6886. doi: 10.3934/mbe.2021341
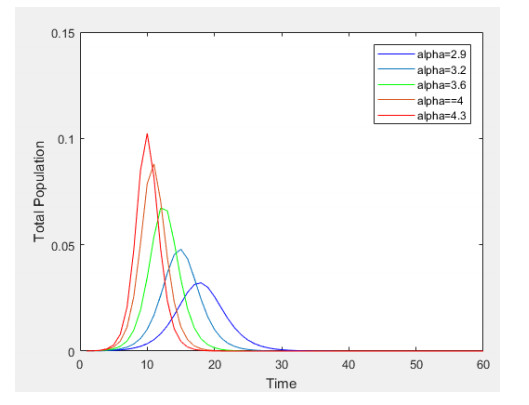
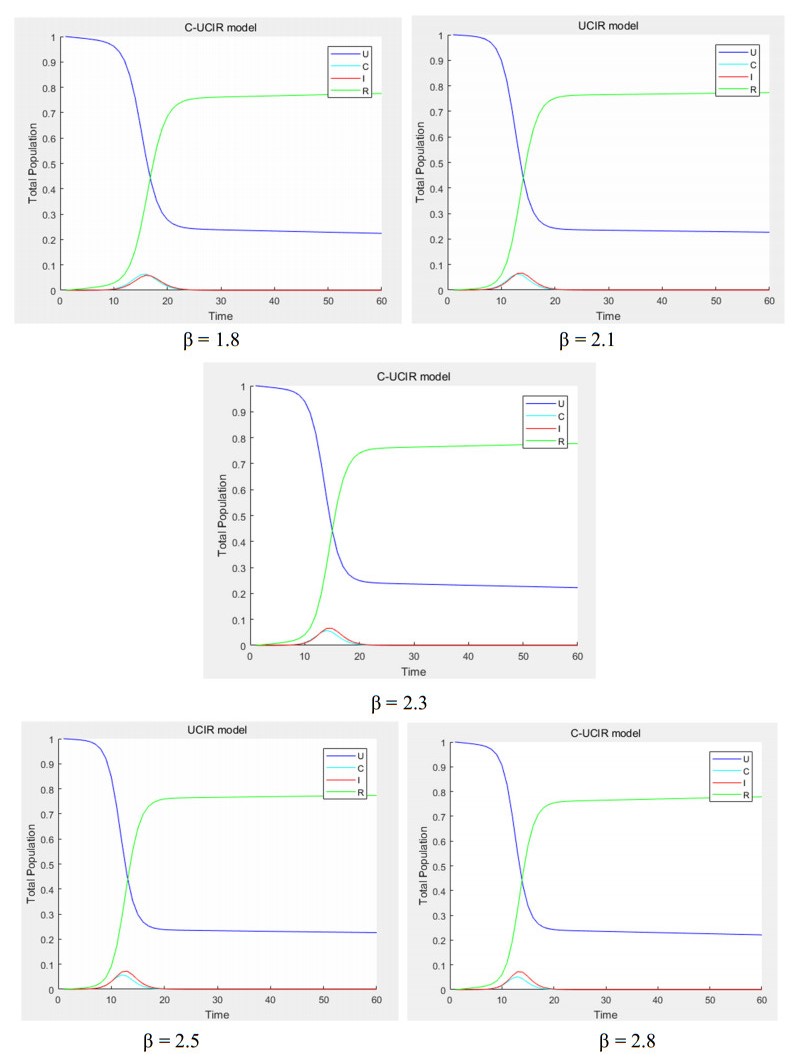
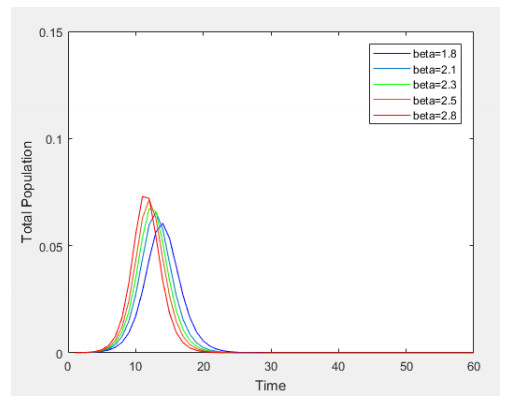
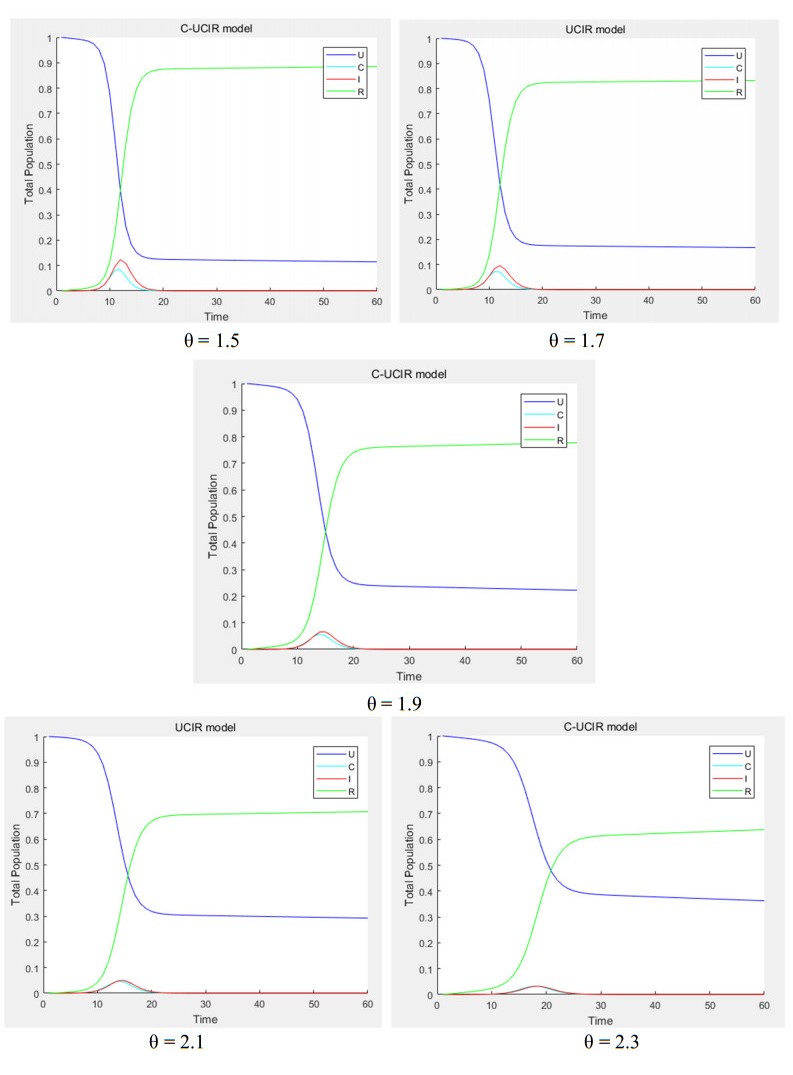
In the 5G era, media convergence and technological updates lead to tremendous changes in the dissemination of public opinion information. The guidance of public opinion in the converged media environment is a new research topic. Users participate in the discussion of different media, and flow in and out from different media, which gradually generate a new complex dynamics model of the dissemination of public opinion information. An index system for evaluating the influence of converged media communication that combines the advantages of traditional media and new media is constructed. We use AHP to determine the index weights in the evaluation system and conduct consistency tests. The final weight of each media is determined through the combination of subjective and objective methods, which provides data supports for later determining the participation of various media in the dissemination process of public opinion information. Based on the SIR model, a UCIR (unknown-contact-infected-recovered) dynamic model is established. The simulation results show that the root mean square error (RMSE) of the UCIR model is 31.6% lower than that of the SIR model. Finally, by fixing the key parameters α, β, θ, ε, p, q in the UCIR model, and changing only one of them, we studied the effect of the transition probability between different states on the process of public opinion information transmission, and then proposed corresponding guidance. In addition, from the two perspectives of network media and government, the countermeasures and suggestions for the guidance of public opinion are proposed. We try to solve the problems of humanities and social sciences with the method of natural science. These research results can provide theoretical and methodological support for people to understand the law of public opinion information transmission and establish a guiding mechanism for public opinion information transmission.

| [1] | B. P. Niehoff, R. H. Moorman, Justice as a mediator of the relationship between methods of monitoring and organizational citizenship behavior, Acade. Manage. J., 36 (1993), 527-556. |
| [2] | A. Nachison, Good business or good journalism, Lessons from the bleeding edge, World Editors' Forum, 2001. |
| [3] | R. Gordon, Implications of convergence, in Digital journalism: Emerging media and the changing horizons of journalism, 2003. |
| [4] | F. Liao, Research on the spread mode of emergencies in overseas chinese hometown and the guiding strategies of public opinion in the hometown of overseas chinese in the media era, J. Lishui Univ., 38 (2016), 58-64. |
| [5] | W. O. Kermack, A. G. McKendrick, A contribution to the mathematical theory of epidemics, Proc. R. Soc. London, Ser. A, 115 (1927), 1095-1934. |
| [6] |
L. Zhao, J. Wang, Y. Chen, Q. Wang, J. Cheng, H. Cui, SIHR rumor spreading model in social networks, Phys. A, 391 (2012), 2444-2453. doi: 10.1016/j.physa.2011.12.008

|
| [7] | X. Ding, Research on propagation model of public opinion topics based on SCIR in microblogging, Comput. Eng. Appl., 51 (2015), 20-26. |
| [8] | X. Lin, Y. Zhuang, L. Sun, Research on SEIR network public opinion dissemination model with saturated contact rate, J. Inf., 34 (2015), 150-155. |
| [9] | X. You, Q. Liu, Research on microblog information dissemination prediction based on infectious disease model, Comput. Appl. Software, 33 (2016), 53-56. |
| [10] |
Y. Liu, S. M. Diao, Y. X. Zhu, Q. Liu, SHIR competitive information diffusion model for online social media, Phys. A, 461 (2016), 543-553. doi: 10.1016/j.physa.2016.06.080
|
| [11] |
X. Rui, F. Meng, Z. Wang, G. Yuan, C. Du, SPIR: The potential transmissioners involved SIR model for information diffusion in social networks, Phys. A, 506 (2018), 254-269. doi: 10.1016/j.physa.2018.04.062
|
| [12] | H. A. Ebadizadeh, H. Haghbayan, Dynamics of rumor spreading, Ann. Optim. Theory Pract., 1 (2018), 45-54. |
| [13] |
Y. Zan, DSIR double-rumors spreading model in complex networks, Chaos Solitons Fractals, 110 (2018), 191-202. doi: 10.1016/j.chaos.2018.03.021
|
| [14] |
K. M. A. Kabir, K. Kuga, J. Tanimoto, Analysis of SIR epidemic model with information spreading of awareness, Chaos Solitons Fractals, 119 (2019), 118-125. doi: 10.1016/j.chaos.2018.12.017
|
| [15] |
R. Xiao, T. Yu, A multi-agent simulation approach to rumor spread in virtual commnunity based on social network, Intell. Autom. Soft Comput., 17 (2011), 859-869. doi: 10.1080/10798587.2011.10643194
|
| [16] |
Y. Zan, J. Wu, P. Li, Q. Yu, SICR rumor spreading model in complex networks: Counterattack and self-resistance, Phys. A, 405 (2014), 159-170. doi: 10.1016/j.physa.2014.03.021
|
| [17] |
J. Zhou, Z. Liu, B Li, Influence of network structure on rumor propagation, Phys. Lett. A, 368 (2007), 458-463. doi: 10.1016/j.physleta.2007.01.094
|
| [18] | Z. Chen, Z. Xu, A delayed diffusive influenza model with two-strain and two vaccinations, Appl. Math. Comput., 349 (2019), 439-453. |
| [19] |
R. Y. Tian, X. F. Zhang, Y. J. Liu, SSIC model: A multi-layer model for intervention of online rumors transmissioning, Phys. A, 427 (2015), 181-191. doi: 10.1016/j.physa.2015.02.008
|
| [20] |
Q. Liu, T. Li, M. Sun, The analysis of an SEIR rumor propagation model on heterogeneous network, Phys. A, 469 (2017), 372-380. doi: 10.1016/j.physa.2016.11.067
|
| [21] |
C. Wan, T. Li, Z. Sun, Global stability of a SEIR rumor transmissioning model with demographics on scale-free networks, Adv. Differ. Equation, 2017 (2017), 1-15. doi: 10.1186/s13662-016-1057-2
|
| [22] | Y. Zhang, C. Chen, A rumor spreading model considering latent state, Proceedings of the Eighth International Conference on Management Science and Engineering Management, (2014), 155-162. |
| [23] | L. Zhang, C. Su, Y. Jin, M. Goh, Z. Wu, Cross-network dissemination model of public opinion in coupled networks, Inf. Sci., 451 (2018), 240-252. |
| [24] |
Y. A. Kuznetsov, C. Piccardi, Bifurcation analysis of periodic SEIR and SIR epidemic models, Math. Biol., 32 (1994), 109-121. doi: 10.1007/BF00163027
|
| [25] | J. M. Pan, Z. Chen, X. J. Zhao, The Construction of Evaluation Index System of Network Public Opinion Based on Large Data of Mobile Internet-take Hunan as an example, J. Hunan Ind. Polytech., 15 (2015), 21-24. |
| [26] | D. Du, Q. Pang, Y. Wu, Modern Comprehensive Evaluation Method and Case Selection, Beijing: Tsinghua University Press, (2008), 21-32. |
| [27] |
M. Radovanovic, A. Ranđelović, Ž. Jokić, Application of hybrid model fuzzy AHP-VIKOR in selection of the most efficient procedure for rectification of the optical sight of the long-range rifle, Decis. Making Appl. Manage. Eng., 3 (2020), 131-148. doi: 10.31181/dmame2003131r
|
| [28] |
Z. Bobar, D. Božanić, K. Djurić, D. Pamučar, Ranking and Assessment of the Efficiency of Social Media using the Fuzzy AHP-Z Number Model-Fuzzy MABAC, Acta Polytech. Hung., 17 (2020), 43-70. doi: 10.12700/APH.17.3.2020.3.3
|
| [29] |
H. M. Lyu, W. H. Zhou, S. L. Shen, A. N. Zhou, Inundation risk assessment of metro system using AHP and TFN-AHP in Shenzhen, Sustainable Cities Soc., 56 (2020), 102103. doi: 10.1016/j.scs.2020.102103
|
| [30] | S. Duleba, Introduction and comparative analysis of the multi-level parsimonious AHP methodology in a public transport development decision problem, J. Oper. Res. Soc., 2020 (2020), 1-14. |
| [31] |
R. Ohta, V. A. P. Salomon, M. B. Silva, Classical, fuzzy, hesitant fuzzy and intuitionistic fuzzy analytic hierarchy processes applied to industrial maintenance management, J. Intell. Fuzzy Syst., 38 (2020), 601-608. doi: 10.3233/JIFS-179433
|
| [32] | M. C. Choi, Evaluation of analytic hierarchy process method and development of a weight modified model, Manage. Inf. Syst. Rev., 39 (2020), 145-162. |
| [33] | C. Lin, G. Kou, A heuristic method to rank the alternatives in the AHP synthesis, Appl. Soft Comput., 100 (2020), 106916. |
| [34] |
J. E. Leal, AHP-express: A simplified version of the analytical hierarchy process method, MethodsX, 7 (2020), 100748. doi: 10.1016/j.mex.2019.11.021
|
| [35] |
X. Deng, Y. Deng, D-AHP method with different credibility of information, Soft Comput., 23 (2019), 683-691. doi: 10.1007/s00500-017-2993-9
|
| [36] |
P Zhang, Q Liu, B Kang, An improved OWA-Fuzzy AHP decision model for multi-attribute decision making problem, J. Intell. Fuzzy Syst., 40 (2021), 9655-9668. doi: 10.3233/JIFS-202168
|
| [37] |
F. Abastante, S. Corrente, S. Greco, A. Ishizaka, I. M. Lami, A new parsimonious AHP methodology: Assigning priorities to many objects by comparing pairwise few reference objects, Expert Syst. Appl., 127 (2019), 109-120. doi: 10.1016/j.eswa.2019.02.036
|
| [38] | T. Chen, A diversified AHP-tree approach for multiple-criteria supplier selection, Comput. Manage. Sci., 2021 (2021), 1-23. |
| [39] |
W. Li, G. Xu, Q. Xing, M. Lyu, Application of improved AHP-BP neural network in CSR performance evaluation model, Wireless Pers. Commun., 111 (2020), 2215-2230. doi: 10.1007/s11277-019-06981-z
|
Figures(19) / Tables(6)

Jinbao Song, Xiaoya Zhu. Research on public opinion guidance of converging media based on AHP and transmission dynamics[J]. Mathematical Biosciences and Engineering, 2021, 18(5): 6857-6886. doi: 10.3934/mbe.2021341


 DownLoad: