This study was aimed to identify prognostic factors in glioma by analysis of the gene expression and DNA methylation data.
The RNAseq and DNA methylation data associated with glioma were downloaded from GEO and TCGA databases to analyze the differentially expressed genes (DEGs) and methylated genes between tumor and normal tissues. Function and pathway analyses, co-expression network and survival analysis were performed based on these DEGs. The intersection genes of DEGs and differentially methylated genes were obtained followed by function analysis.
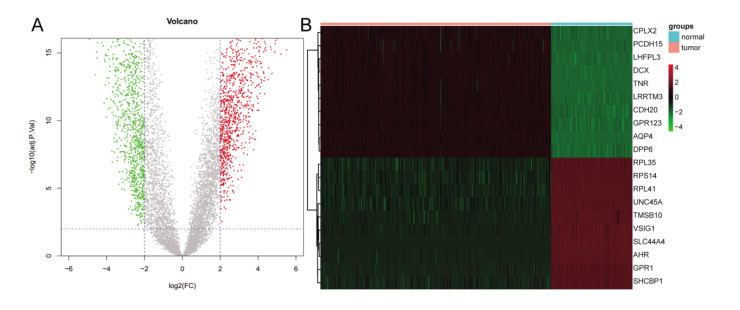
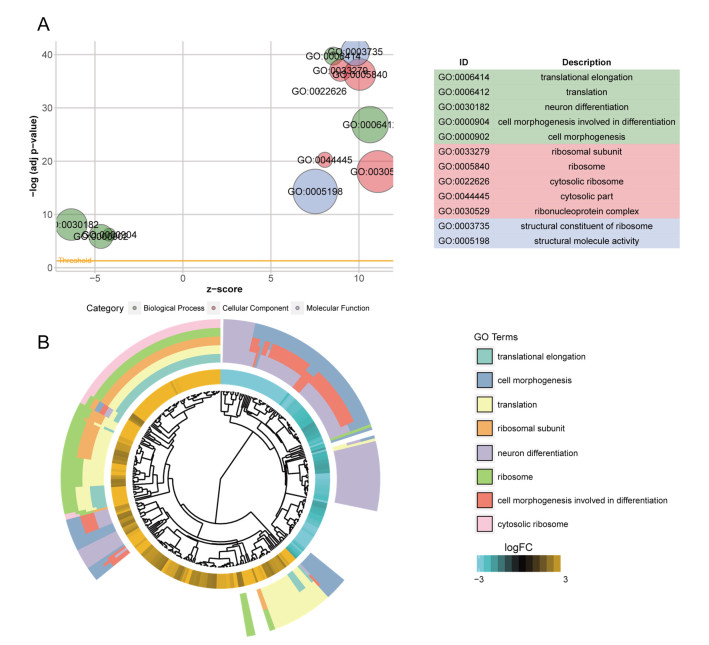
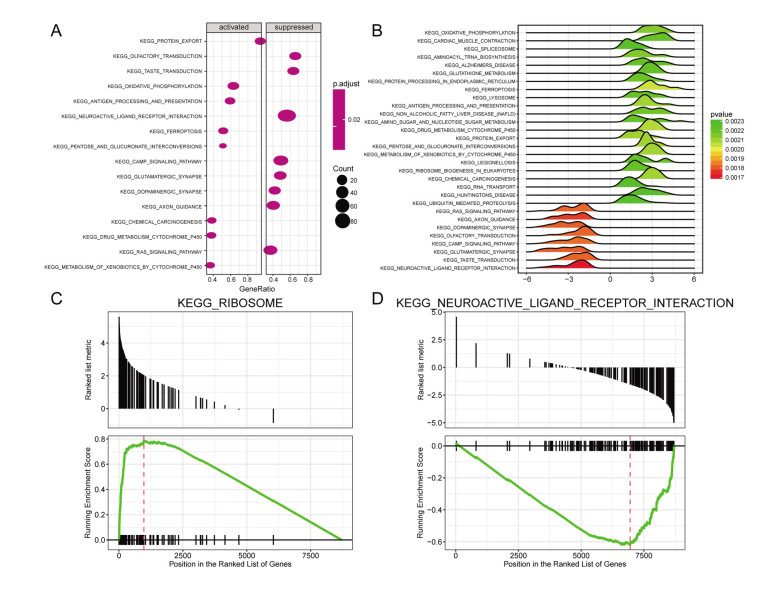
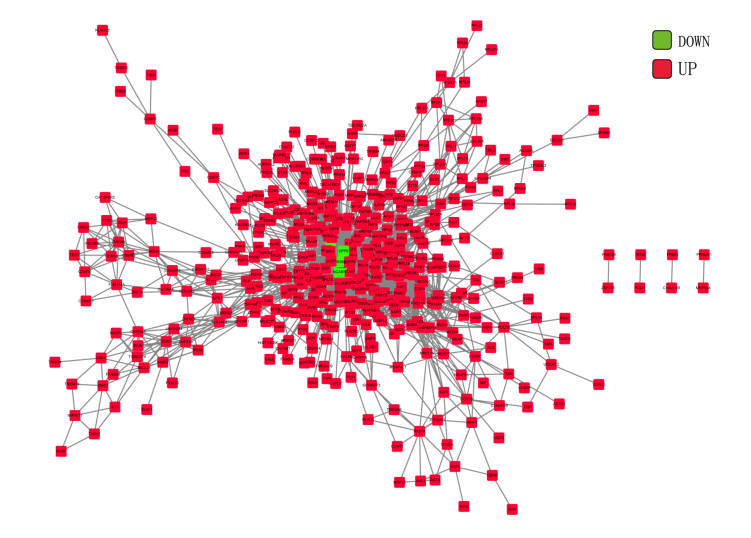
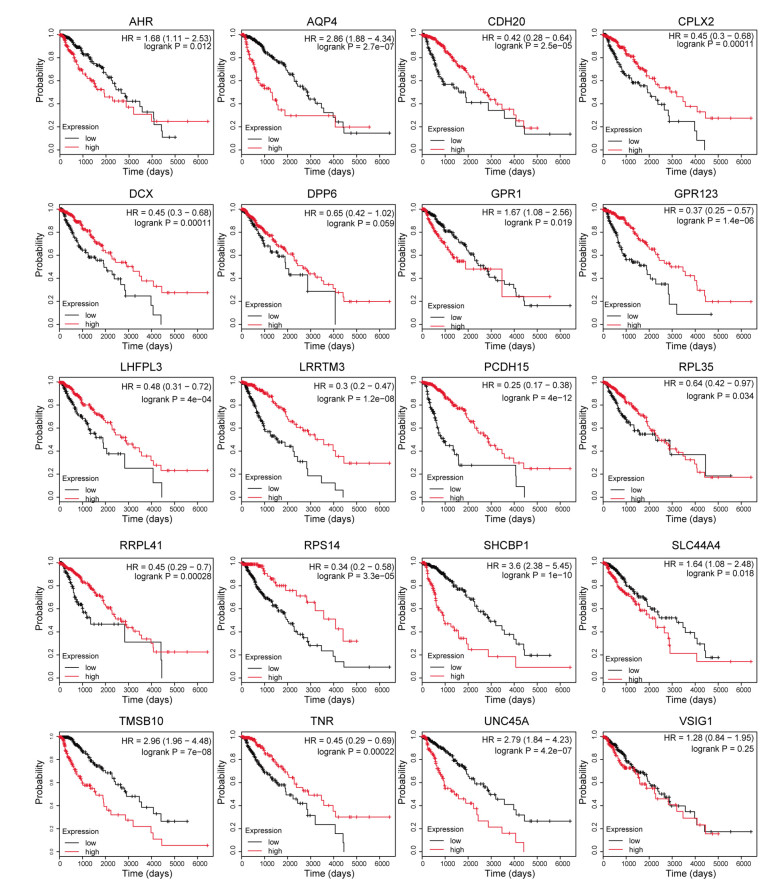
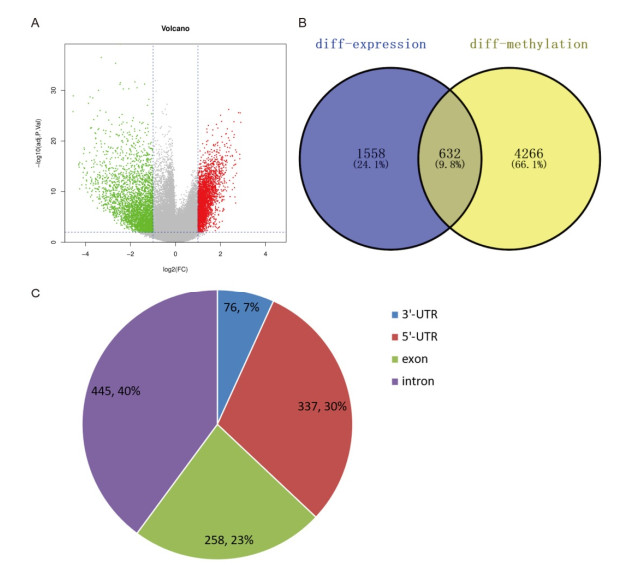
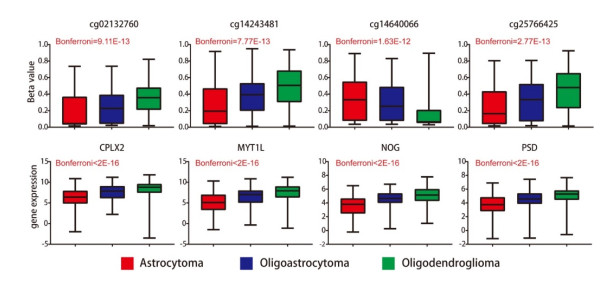
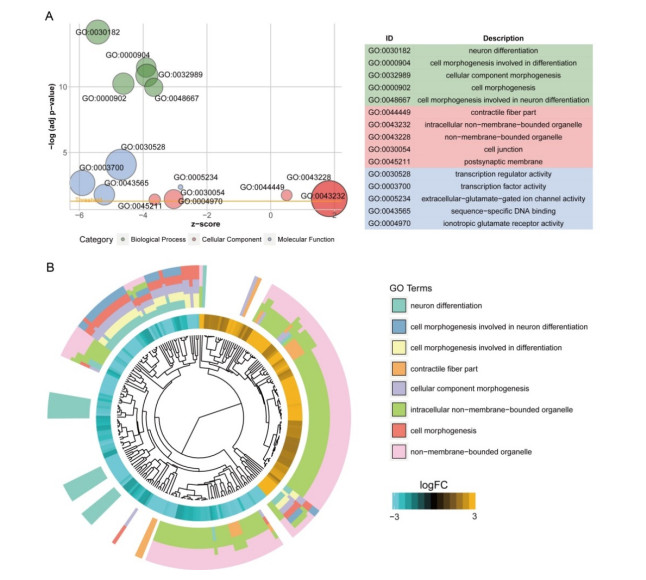
Total 2190 DEGs were identified between tumor and normal tissues, which were significantly enriched in neuron differentiation associated functions, as well as ribosome pathway. There were 6186 methylation sites (2834 up-regulated and 3352 down-regulated) with significant differences in tumor vs. normal. In the constructed co-expression network, DPP6, MAPK10 and RPL3 were hub genes. Survival analysis of 20 DEGs obtained 18 prognostic genes, among which 9 were differentially methylated, such as LHFPL tetraspan subfamily member 3 (LHFPL3), cadherin 20 (CDH20), complexin 2 (CPLX2), and tenascin R (TNR). The intersection of DEGs and differentially methylated genes (632 genes) were significantly enriched in functions of neuron differentiation.
DPP6, MAPK10 and RPL3 may play important roles in tumorigenesis of glioma. Additionally, methylation of LHFPL3, CDH20, CPLX2, and TNR may serve as prognostic factors of glioma.
Citation: Bo Wei, Rui Wang, Le Wang, Chao Du. Prognostic factor identification by analysis of the gene expression and DNA methylation data in glioma[J]. Mathematical Biosciences and Engineering, 2020, 17(4): 3909-3924. doi: 10.3934/mbe.2020217
This study was aimed to identify prognostic factors in glioma by analysis of the gene expression and DNA methylation data.
The RNAseq and DNA methylation data associated with glioma were downloaded from GEO and TCGA databases to analyze the differentially expressed genes (DEGs) and methylated genes between tumor and normal tissues. Function and pathway analyses, co-expression network and survival analysis were performed based on these DEGs. The intersection genes of DEGs and differentially methylated genes were obtained followed by function analysis.
Total 2190 DEGs were identified between tumor and normal tissues, which were significantly enriched in neuron differentiation associated functions, as well as ribosome pathway. There were 6186 methylation sites (2834 up-regulated and 3352 down-regulated) with significant differences in tumor vs. normal. In the constructed co-expression network, DPP6, MAPK10 and RPL3 were hub genes. Survival analysis of 20 DEGs obtained 18 prognostic genes, among which 9 were differentially methylated, such as LHFPL tetraspan subfamily member 3 (LHFPL3), cadherin 20 (CDH20), complexin 2 (CPLX2), and tenascin R (TNR). The intersection of DEGs and differentially methylated genes (632 genes) were significantly enriched in functions of neuron differentiation.
DPP6, MAPK10 and RPL3 may play important roles in tumorigenesis of glioma. Additionally, methylation of LHFPL3, CDH20, CPLX2, and TNR may serve as prognostic factors of glioma.

| [1] | L. M. DeAngelis, Brain tumors, N. Engl. J. Med., 344 (2001), 114-123. |
| [2] |
A. Claes, A. J. Idema, P. Wesseling, Diffuse glioma growth: A guerilla war, Acta Neuropathol., 114 (2007), 443-458. doi: 10.1007/s00401-007-0293-7

|
| [3] |
N. A. O. Bush, S. M. Chang, M. S. Berger, Current and future strategies for treatment of glioma, Neurosurg. Rev., 40 (2017), 1-14. doi: 10.1007/s10143-016-0709-8
|
| [4] |
K. Ludwig, H. I. Kornblum, Molecular markers in glioma, J. Neuro-Oncol., 134 (2017), 505-512. doi: 10.1007/s11060-017-2379-y
|
| [5] |
K. Aoki, H. Nakamura, H. Suzuki, K. Matsuo, K. Kataoka, T. Shimamura, et al., Prognostic relevance of genetic alterations in diffuse lower-grade gliomas, Neuro. Oncol., 20 (2018), 66-77. doi: 10.1093/neuonc/nox132
|
| [6] |
Q. T. Ostrom, H. Gittleman, L. Stetson, S. Virk, J. S. Barnholtz-Sloan, Epidemiology of intracranial gliomas, Prog. Neurol. Surg., 30 (2018), 1-11. doi: 10.1159/000464374
|
| [7] |
B. Melin, R. Jenkins, Genetics in glioma-lessons learned from genome wide association studies, Curr. Opin. Neurol., 26 (2013), 688. doi: 10.1097/WCO.0000000000000033
|
| [8] |
H. Binder, E. Willscher, H. Loeffler-Wirth, L. Hopp, D. T. W. Jones, S. M. Pfister, et al., DNA methylation, transcriptome and genetic copy number signatures of diffuse cerebral WHO grade Ⅱ/Ⅲ gliomas resolve cancer heterogeneity and development, Acta Neuropathol. Commun., 7 (2019), 59. doi: 10.1186/s40478-019-0704-8
|
| [9] |
M. Klutstein, D. Nejman, R. Greenfield, H. Cedar, DNA methylation in cancer and aging, Cancer Res., 76 (2016), 3446-3450. doi: 10.1158/0008-5472.CAN-15-3278
|
| [10] |
D. Capper, D. T. Jones, M. Sill, V. Hovestadt, D. Schrimpf, D. Sturm, et al., DNA methylation-based classification of central nervous system tumours, Nature, 555 (2018), 469-474. doi: 10.1038/nature26000
|
| [11] |
C. F. de Souza, T. S. Sabedot, T. M. Malta, L. Stetson, O. Morozova, A. Sokolov, et al., A distinct DNA methylation shift in a subset of glioma CpG island methylator phenotypes during tumor recurrence, Cell Rep., 23 (2018), 637-651. doi: 10.1016/j.celrep.2018.03.107
|
| [12] |
D. Sturm, H. Witt, V. Hovestadt, D. Khuong-Quang, D. T.W. Jones, C. Konermann, et al., Hotspot mutations in H3F3A and IDH1 define distinct epigenetic and biological subgroups of glioblastoma, Cancer cell, 22 (2012), 425-437. doi: 10.1016/j.ccr.2012.08.024
|
| [13] | R. A. Kroes, J. R. Moskal, The role of DNA methylation in ST6Gal1 expression in gliomas, Glycobiology, 26 (2016), 1271-1283. |
| [14] |
A. Majchrzak-Celińska, M. Słocińska, A. M. Barciszewska, S. Nowak, W. Baer-Dubowska, Wnt pathway antagonists, SFRP1, SFRP2, SOX17, and PPP2R2B, are methylated in gliomas and SFRP1 methylation predicts shorter survival, J. Appl. Genet., 57 (2016), 189-197. doi: 10.1007/s13353-015-0312-7
|
| [15] | T. Barrett, S. E. Wilhite, P. Ledoux, et al., NCBI GEO: archive for functional genomics data sets-update, Nucleic Acids Res., 41 (2013), 991-995. |
| [16] |
M. Haeussler, A. S. Zweig, C. Tyner, M. L. Speir, K. R. Rosenbloom, B. J. Raney, et al., The UCSC Genome Browser database: 2019 update, Nucleic Acids Res., 47 (2019), 853-858. doi: 10.1093/nar/gky1095
|
| [17] |
M. E. Ritchie, B. Phipson, D. Wu, Y. Hu, C. W. Law, W. Shi, et al., Limma powers differential expression analyses for RNA-sequencing and microarray studies, Nucleic Acids Res., 43 (2015), e47. doi: 10.1093/nar/gkv007
|
| [18] |
W. Huang da, B. T. Sherman, R. A. Lempicki, Systematic and integrative analysis of large gene lists using DAVID bioinformatics resources, Nat. Protoc., 4 (2009), 44-57. doi: 10.1038/nprot.2008.211
|
| [19] |
W. Walter, F. Sanchez-Cabo, M. Ricote, GOplot: An R package for visually combining expression data with functional analysis, Bioinformatics, 31 (2015), 2912-2914. doi: 10.1093/bioinformatics/btv300
|
| [20] |
M. Kanehisa, S. Goto, KEGG: kyoto encyclopedia of genes and genomes, Nucleic Acids Res., 28 (2000), 27-30. doi: 10.1093/nar/28.1.27
|
| [21] | D. Damian, M. Gorfine, Statistical concerns about the GSEA procedure, Nat. Genet., 36 (2004), 663. |
| [22] | M. Jason, Psych issues, JEMS:a journal of emergency medical services, 38 (2013), 23717912. |
| [23] |
K. Wada, N. Yokotani, C. Hunter, K. Doi, R. J. Wenthold, S. Shimasaki, Differential expression of two distinct forms of mRNA encoding members of a dipeptidyl aminopeptidase family, Proc. Natl. Acad. Sci., 89 (1992), 197-201. doi: 10.1073/pnas.89.1.197
|
| [24] |
A. P. Klein, Genetic susceptibility to pancreatic cancer, Mol. Carcinog., 51 (2012), 14-24. doi: 10.1002/mc.20855
|
| [25] |
L. Li, Z. Luo, Dysregulated miR-27a-3p promotes nasopharyngeal carcinoma cell proliferation and migration by targeting Mapk10, Oncol. Rep., 37 (2017), 2679-2687. doi: 10.3892/or.2017.5544
|
| [26] | Y. Xie, Y. Liu, X. Fan, L. Zhang, Q. Li, S. Li, et al., MicroRNA-21 promotes progression of breast cancer via inhibition of mitogen-activated protein kinase10 (MAPK10), Biosci. Rep., 2019 (2019). |
| [27] | M. Shao, W. Liu, Y. Wang, Differentially expressed LncRNAs as potential prognostic biomarkers for glioblastoma, Cancer Genet., 226 (2018), 23-29. |
| [28] |
H. Wang, L. N. Zhao, K. Z. Li, R. Ling, X. J. Li, L. Wang, Overexpression of ribosomal protein L15 is associated with cell proliferation in gastric cancer, BMC cancer, 6 (2006), 91. doi: 10.1186/1471-2407-6-91
|
| [29] |
A. Russo, A. Saide, R. Cagliani, M. Cantile, G. Botti, G. Russo, rpL3 promotes the apoptosis of p53 mutated lung cancer cells by down-regulating CBS and NFkappaB upon 5-FU treatment, Sci. Rep., 6 (2016), 1-13. doi: 10.1038/s41598-016-0001-8
|
| [30] |
S. O. Sulima, I. J. Hofman, K. De Keersmaecker, J. D. Dinman, How ribosomes translate cancer, Cancer discovery, 7 (2017), 1069-1087. doi: 10.1158/2159-8290.CD-17-0550
|
| [31] |
W. Guo, L. Zhu, M. Yu, R. Zhu, Q. Chen, Q. Wang, A five-DNA methylation signature act as a novel prognostic biomarker in patients with ovarian serous cystadenocarcinoma, Clin. Epigenetics, 10 (2018), 142. doi: 10.1186/s13148-018-0574-0
|
| [32] |
M. M. Petit, E. F. Schoenmakers, C. Huysmans, J. M.W. Geurts, N. Mandahl, W. J. M. Van de Ven, et al., LHFP, a Novel Translocation Partner Gene ofHMGICin a Lipoma, Is a Member of a New Family ofLHFP-like Genes, Genomics, 57 (1999), 438-441. doi: 10.1006/geno.1999.5778
|
| [33] |
M. Nagaishi, Y.-H. Kim, M. Mittelbronn, et al., Amplification of the STOML3, FREM2, and LHFP genes is associated with mesenchymal differentiation in gliosarcoma, Am. J. Pathol., 180 (2012), 1816-1823. doi: 10.1016/j.ajpath.2012.01.027
|
| [34] |
V. Milinkovic, J. Bankovic, M. Rakic, F. Giangaspero, W. Paulus, B. Brokinkel, et al., Genomic instability and p53 alterations in patients with malignant glioma, Experimental and molecular pathology, 93 (2012), 200-206. doi: 10.1016/j.yexmp.2012.05.010
|
| [35] | Z. Li, R. Qian, J. Zhang, X. Shi, Lipoma HMGIC fusion partner-like 3 (LHFPL3) promotes proliferation, migration and epithelial-mesenchymal transitions in human glioma cells, Int. J. Clin. Exp. Pathol., 10 (2017), 5471-5479. |
| [36] |
V. Milinkovic, J. Bankovic, M. Rakic, T. Stankovic, M. Skender-Gazibara, S. Ruzdijic, Identification of novel genetic alterations in samples of malignant glioma patients, Plos One, 8 (2013), e82108. doi: 10.1371/journal.pone.0082108
|
| [37] |
J. Tang, A. Maximov, O. H. Shin, H. Dai, J. Rizo, T. C. Südhof, et al., A complexin/synaptotagmin 1 switch controls fast synaptic vesicle exocytosis, Cell, 126 (2006), 1175-1187. doi: 10.1016/j.cell.2006.08.030
|
| [38] |
D. Glynn, H. E. Gibson, M. K. Harte, K. Reim, S. Jones, G. P. Reynolds, et al., Clorgyline-mediated reversal of neurological deficits in a Complexin 2 knockout mouse, Hum. Mol. Genet., 19 (2010), 3402-3412. doi: 10.1093/hmg/ddq252
|
| [39] |
H. Komatsu, A. Kakehashi, N. Nishiyama, N. Izumi, S. Mizuguchi, S. Yamano, et al., Complexin-2 (CPLX2) as a potential prognostic biomarker in human lung high grade neuroendocrine tumors, Cancer Biomarkers, 13 (2013), 171-180. doi: 10.3233/CBM-130336
|
| [40] | L. Li, X. Liu, X. Ma, X. Deng, T. Ji, P. Hu, et al., Identification of key candidate genes and pathways in glioblastoma by integrated bioinformatical analysis, Exp. Ther. Med., 18 (2019), 3439-3449. |
| [41] |
S. Hirohashi, Y. Kanai, Cell adhesion system and human cancer morphogenesis, Cancer Sci., 94 (2003), 575-581. doi: 10.1111/j.1349-7006.2003.tb01485.x
|
| [42] |
U. Cavallaro, G. Christofori, Cell adhesion and signalling by cadherins and Ig-CAMs in cancer, Nat. Rev. Cancer, 4 (2004), 118. doi: 10.1038/nrc1276
|
| [43] | P. G. Gritsenko, P. Friedl, Adaptive adhesion systems mediate glioma cell invasion in complex environments, J. Cell Sci., 131 (2018). |
| [44] |
N. Brösicke, A. Faissner, Role of tenascins in the ECM of gliomas, Cell Adhes. Migr., 9 (2015), 131-140. doi: 10.1080/19336918.2014.1000071
|
| [45] |
J. Q. Fu, Z. Chen, Y. J. Hu, Z. Hu. Fan, Z. X. Guo, J. Y. Liang, et al., A single factor induces neuronal differentiation to suppress glioma cell growth, CNS Neurosci. Ther., 25 (2019), 486-495. doi: 10.1111/cns.13066
|
Figures(8) / Tables(1)

Bo Wei, Rui Wang, Le Wang, Chao Du. Prognostic factor identification by analysis of the gene expression and DNA methylation data in glioma[J]. Mathematical Biosciences and Engineering, 2020, 17(4): 3909-3924. doi: 10.3934/mbe.2020217


 DownLoad: