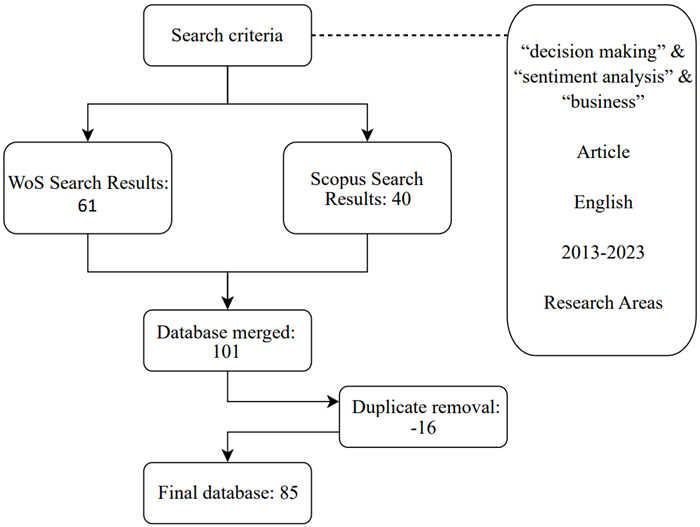
1.
Introduction
In recent years, unstructured information scattered on the web has become an increasingly relevant source of information to support organizations in decision-making [1]. From the analysis of this data, managers try to improve the relationship with their potential customers and implement business improvements [2] in a more affordable, faster, and more direct way than the traditional manner, in which customer experience used to be counted through customer service surveys [3,4].
According to [5], business is the practice of making one's living or making money by producing or buying and selling products (such as goods and services). More recently, [6] added that "any activity or enterprise entered into for profit". To this definition we must add the concept of decision-making in the organizational structure of the company, where various authors emphasize the role of business processes or business processes management (BPM) [7]. The definition of business decision-making in a BPM environment is more complex, as according to [8] it depends on the context and the topic of discussion in which the processes take place.
Due to the large amount of existing information, this can be incomprehensible for manual analysis both for customers [9] and for organizations that intend to review opinions about their own or competing products or services [10], so the need arises to automate the collection and analysis process [11].
This can be done with sentiment analysis (SA), defined as the field of study that analyzes people's opinions, feelings, attitudes, and emotions toward entities such as products, services, events, organizations, individuals, problems, or other topics or the attributes expressed about these in a text [12]. This can automate the task of processing large amounts of unstructured data by applying artificial intelligence and machine learning algorithms to obtain relevant information about the opinions, emotions, and attitudes manifested in texts, such as social media posts, product reviews, or blog comments.
This method of analysis has become an indispensable tool for organizations that want to know the opinions and needs of their customers in real time, allowing them to make more accurate decisions and enhance their products and services, reformulate processes, take into account the customer, predict trends and market dynamics [13,14], or identify potential risks and business opportunities [15].
Although SA has been studied in a variety of fields, especially in engineering, where there is a considerable number of publications related to precision comparisons between classifier algorithms in the branch of machine learning (ML) of SA, there are still areas of research in which literature reviews or bibliometric analyses are not found that show how research is currently carried out in terms of its practical application in business decision-making.
In this context, this article aims to analyze the importance of SA in business decision-making, understand the state of research in relation to this method of analysis applied to decision-making, in which areas it has been most frequently applied, and discover its evolution and current trends in its application through a bibliometric analysis of the existing literature from 2013 until the date of this paper.
Thus, the following research questions are proposed:
• RQ1: What is the current state of research on sentiment analysis applied to business decision- making?
• RQ2: What are the areas of business where there is a greater adoption of sentiment analysis methodologies to support decision-making?
• RQ3: Which online platforms are most frequently used to obtain customer feedback?
• RQ4: How is the application evolving and with what other methods is sentiment analysis combined?
The findings indicate that SA methods are becoming increasingly popular [16], and that they are being used in combination with other methodologies such as the multicriteria decision making method (MCDM) and predictive algorithms, among others.
The structure of this article is divided into this introductory section in which everything developed in the article is discussed in general terms and the research questions are set out. The second section is the methodology section, which defines in detail the procedure followed, the databases consulted, and their search strings, and the software used for the study. This is followed by the conceptual section, which explains what SA consists of, and the object of study in this work. Next is the results section, in which the results of the research on bibliometrix are shown and commented on, and, in the document analysis subsection, a review of the most relevant articles of the compilation is carried out. The discussion section summarizes the findings by answering the research questions posed before completing the article with the last section, the conclusions section.
2.
Related works
2.1. Sentiment analysis definition
The concept of SA or opinion mining has been defined in the scientific literature by different authors. In Table 1 "Definitions of sentiment analysis" some of these definitions are collected:
Of these, the definition given by Liu [12] is one of the most complete and recent, and has led to it being considered and included in numerous articles related to SA in their literature review sections.
In turn, SA is included within the research field of natural language processing (NLP). This field of research refers to the techniques with which machines process the language of people [23] in order to generate some utility, and includes different techniques such as speech recognition and speech generation, spelling and grammar correction, translation, intelligent writing assistants, named entities identification, analysis of topics, or the one on which this paper focuses, SA [24,25].
NLP is one of the branches framed in the field of artificial intelligence, a discipline that, as shown in Figure 1 "Taxonomy of the subareas of artificial intelligence with emphasis on SA", has as main branches machine learning, computer vision, knowledge-based systems, fuzzy logic, natural language processing, robotics, automated planning and scheduling, expert systems, and optimization. [24,26,27,28].
Within the field of SA there are several techniques to perform the analysis. Figure 1 "Taxonomy of the subareas of artificial intelligence with emphasis on SA" shows that within SA there are three types of methods [29,30]:
-Machine learning based: From a set of labeled data, the classifier is trained to detect patterns in the sample, new unlabeled data is then added, and the classifier will determine the sentiment of these. The best-known and most accurate classifying algorithms are support vector machine (SVM), Naive Bayes, and decision trees [31].
-Lexicon-based: The feeling of the sentences is determined by coincidence with the words included in a predetermined dictionary in which each word is assigned a positive, negative or neutral connotation expressed in polarity values between -1 and +1, -1 being the most negative value, 0 the neutral value, and +1 the most positive value. Some of the best-known lexicons are VADER [32] and SentiWordNet [19].
-Hybrid: This is a mixture of the two previous methods.
There are also three levels of classification according to the level of detail of the analysis [16,33]:
-Document-level: Classifies the sentiment of a document in general.
-Sentence-level: Classifies the feeling of all the different sentences that make up a text. Sentences can be considered short documents, so this level is similar to the document level; however, it involves more difficulty due to less information being contained in the sentences regarding the documents.
-Aspect-level or aspect based sentiment analysis (ABSM): Identifies entities and associates the detected sentiment with each of the detected entities. As explained in the conclusions of this article, it is one of the most widely used levels when detecting sentiment in reviews, as it allows us to know which attributes are the best or worst for a product or service.
The purpose of applying SA methods in business is generally for monitoring online opinions of customers, experts, and other influential people that represent a source of unstructured data that is infeasible to parse manually and which serves as a rich source of information to improve the quality of customer service, make improvements in the marketed product, and prevent future emergencies. It should be noted that, although SA can be a boost to business, it currently has great limitations. All the same, its combination with other methods from other research fields such as psychology, engineering, or marketing, resulting in hybrid models, could improve its application in the future [34]. Among the main limitations of SA are [30]:
-Lack of resources: Algorithms require a large annotated dataset and manual labeling requires considerable time. In addition, most of the research is focused on English, and with other languages the accuracy is not as high.
-Web jargon: Some publications use a very specific vocabulary, which is another limitation for sentiment dictionaries.
-Irony and sarcasm: Reviews expressed in an ironic tone may contain a word that denotes a sentiment but says the opposite.
-Presence of multiple aspects in the same sentence: It may happen that in the same sentence one aspect is commented positively and another negatively, which leads to greater difficulty in classifying the feeling of the sentence.
2.2. Systematic literature reviews about sentiment analysis
Before searching the articles in the databases, a compilation of previous articles from systematic literature reviews and related bibliometric analyses was conducted with the aim of comprehending from what perspectives the relationship between SA and business had been studied so far and to know how they had formulated the search chain. These previous works carried out research adopting an approach focused on methodological or technical aspects of SA, so it was determined that there were no literature reviews, nor bibliometric analyses focused on the practical aspects of how SA can be used to optimize and improve decision-making in a company. Table 2 "SLR and previous bibliometrics" shows the systematic literature reviews and bibliometric analyses that were considered:
3.
Methodology
The methodology used in this article is based on the bibliometric analysis of the papers collected from the Clarivate Analytics Web of Science (WoS) and Scopus databases, chosen because they are considered the most relevant in "business" and "economics" journals [48] and have quality indexes like Journal Citation Reports (JCR), cover a wide time horizon, and allow the simultaneous download of a large volume of references [49].
A bibliometric analysis is a methodology based on the quantitative analysis of a literature collection of data related to authorship, publication, citations, and content [50] to discover emerging trends in the structure of the research field to which the analysis refers (patterns of collaboration and citations, performance of articles and journals, etc.) following a systematic process in four phases: definition of objectives and scope, choice of bibliometric techniques, data collection, analysis, and conclusion of results [51].
One of the main differences of this study from previous ones is its methodology as well as the field of study. We have followed the recommendations of authors such as [52,53] for work related to information systems.
The search for publications in the aforementioned databases was carried out using the search strings set out below in Table 3 "Search strings in databases":
The search keywords used were: "sentiment analysis", "decision making" and "business", being searched in the topic of the papers (titles, abstracts and keywords). This would result in documents that apply or explain the adoption of SA methodology to business decision-making. On the other hand, to further refine the search, the temporal filter is applied to focus the research on the period between 2013 and 2023 because it is the interval in which practically all the publications for this search are concentrated as it is an emerging area, the document type filter to focus the search on journal articles, the research area filter to exclude all those areas that are not relevant to our field of study, and the language filter by selecting English.
A total of 61 results were obtained in Clarivate Analytics Web of Science (WoS) and 40 in Scopus. 101 articles in total that, after eliminating 16 duplicates and merging the two lists, a total of 85 articles turned out to be valid. This process is reflected in Figure 2 "Articles filtering flow".
For the subsequent bibliometric analysis of these results, the Bibliometrix tool, based on the R programming language, was used. This open-access tool, proposed by developers Aria and Cuccurullo [54] for an exhaustive analysis of scientific mapping, unifies the statistical workflow in the same environment, allowing the generation of a wide variety of descriptive statistics about the collected publications.
This R package has been increasingly used among the scientific community in recent years. It has been checked in the Clarivate Analytics Web of Science (WoS) database by searching (TS = ("bibliometrix")) AND TS = ("R") where 377 results appear, of which 237 correspond to the years 2022 and 2023.
Specifically, the research area "business economics" is the second in which this tool has been used the most with a total of 70 publications, where we can find papers studying different areas of business such as human resources [55], human resources applying artificial intelligence [56,57], managerial skills [58], tourism [59], entrepreneurship [60], virtual-reality [49], digital transformation [61], or even telework through remote teams [62].
The workflow in Bibliometrix consists of three phases: (1) Data collection, enabling importing in various formats the results of different databases for a joint and complete analysis, including those chosen in this work (Scopus and Clarivate Analytics Web of Science), and the file format in which the data from both are downloaded (BibTeX), which allows merging the files of both databases [7]. (2) Data analysis. (3) Graphical visualization of the analysis results.
4.
Results
4.1. General information
Starting with an overview of the results of the bibliometric study, the 85 articles examined were disseminated across 62 distinct journals and involved 256 authors. (Table 4 "Summary of bibliometric information").
On average, the annual publication count during the last decade is less than 10. However, the progression during these years is ascending as can be seen in Figure 3 "Evolution of the number of publications" from only 3 articles in 2013, with some ups and downs, to values between 10 and 18 articles per year from 2018 to the present. This indicates that the application of SA as a decision support tool in the business world has been growing in popularity over the last decade as seen in the exponential trend line showing its upward projection with an R2 of 0.55.
4.2. Source analysis
The journal "Decision Support System", with a total of 5 articles, is the journal with the most related publications. It is followed by the journals "IEEE Access" and "Kybernetes" with 4; and "Industrial Management & Data Systems", "International Journal of Recent Technology and Engineering", "Online Information Review", and "Technological Forecasting and Social Change" with 3 articles. With 2 publications are "7TH International Conference on Information Technology and Quantitative Management", "Annals of Operations Research", "Information Sciences", "International Journal of Hospitality Management", and "Sustainability (Switzerland)". Table 5 "Most relevant sources" below shows the above ranking.
These sources are classified according to their importance in their field through the indicators presented below with the figures of "Bradford's law" (Figure 4) and "Source growth" (Figure 5), which represents the growth of the journal in this field of research according to the number of annual publications. The journal "Decision and Support Systems" maintains a constant growth throughout the time horizon, surfacing as the journal with the most extensive publication count. Although on a smaller scale, the journals "Kybernetes" and "Online Information Review" have a similar growth.
"Decision Support Systems" reached 371, standing out as the journal with the greatest citation frequency. It is followed by "Online Information Review" with 70, "International Journal of Hospitality Management" with 54, and "Technological forecasting and social change" with 53. Table 6 "Impact of sources" summarizes the information.
4.3. Author analysis
3.9% of the 256 authors mentioned in the general information section, that is 10 authors according to Table 8 "Ratio of publications per author" (Amankwah-Amoah, Herrera-Viedma, Kalpana, Lau, Li J, Morente-Molinera, Sheng J, Wang X, and Yang Z.), published 2 articles. Only one author (Li Y), published more than 2 articles, as shown in Table 7 "Number of documents per author". 95.7% of the authors wrote only 1 article.
The following Table 9 "Impact of authors" shows the impact index of authors in the column "h_index". In this case, the number of publications is proportional to the author's impact because the number of citations is quite homogeneous among all the articles, with no author having achieved a greater impact with a single article than the authors who have published a greater number of articles. In this way, the authors with the greatest impact coincide with those who have produced the most publications, Li Y being the first of them with an h index of 3, followed by those with an h index of 2: Amankwah-Amoah, Herrera-Viedma, Kalpana, Lau, Li J, Morente-Molinera, Sheng, and Wang.
Reviewing the publications that each of the previous authors have in their respective academic profiles, it is observed that Wang and Sheng are the authors who have placed the most emphasis in recent years on research into OM, online reviews, and Big Data, being co-authors in most of the articles. There is also Morente-Molinera, a researcher at the University of Granada who has focused his research on topics such as customer satisfaction, SA, decision-making with multicriteria methods, and the Internet of Things (IoT), and who also has worked as a co-author with Herrera-Viedma, professor at the University of Granada, specializing in the fields of Computer Science and Artificial Intelligence. Li J has published papers on online customer reviews to improve competitive intelligence, review writing style identification, and perform SA in Chinese. The other authors included in the previous table have used SA as a methodology not recurrently, but specifically, in their publications. The following Figure 6 "Collaboration networks between authors" shows the collaboration groups, highlighting the Granada group of Herrera-Viedma and Morente-Molinera and the group of Wang and Sheng.
To obtain an overview, the nationality of the authors was consulted in order to understand which countries are the most prolific countries for this field of study.
Table 10 "Number of publications by country" below shows that China stands out from the rest with 18 publications, representing 21.2% of the total number (85 articles). There are 14 publications of which the country could not be identified. India emerges as the country with the second-highest publication count with 10 (11.8%), followed by the USA with 9 publications (10.6%) and Spain with 9 (9.4%).
These data are graphically represented in the choropleth map of Figure 7 "Choropleth map of production by countries and collaboration between countries" in which international collaborations are also represented. The USA with China, China with India, and India with the UK are the only international collaborations for which more than one article has been recorded, although there are 15 other pairs of international collaborations that have recorded only one publication: China-Australia, China-Iran, China-Netherlands, China- UK, India-France, India-Netherlands, Korea-France, Pakistan-Saudi Arabia, Spain-Brazil, Spain-Finland, Tunisia-Saudi Arabia, UK-Brazil, UK-France, UK-Netherlands, and USA-Iran.
In terms of the number of citations, the four countries with the highest impact are Spain, which leads the ranking with 366, followed by China, the USA, and Pakistan with 298, 274, and 246 publications, respectively. The best average number of citations per article is Pakistan with 123 citations. Table 11, titled "Impact by country", showcases the ranking of the top 10 nations based on their citation counts.
In order to identify the research clusters with a higher level of concreteness, the universities with more publications are checked based on the affiliation of the authors. In Table 12 "Publications by affiliation", National Cheng Kung University (Taiwan) and Northeastern University (USA) hold the distinction of being the universities with the highest publication count, each contributing 5 articles. Guangdong University of Foreign Studies (China), Indian Institutes of Information Technology (India), Renmin University of China (China), and the University of Granada (Spain) are ranked next with 4 papers.
4.4. Document analysis
4.4.1. Research areas analysis
In order to find out which research areas are the most active in the collection of publications, a count of the number of articles per year and research area has been made. Each article may have several research areas that overlap each other, so the count of articles by research areas does not have to coincide with the total number of articles. Figure 8 "Research areas analysis" shows that Computer Science, Business & Economics, and Engineering are the most represented research areas, increasing in frequency, especially since 2019.
4.4.2. Citation analysis
Five articles exceed one hundred citations. Reyes et al. [63] stands out with a noteworthy citation count of 298, averaging 27.09 TC per year, followed by Khan et al. [64] with 245 citations and an average of 24.50 per year. Del Vecchio et al. [65] obtained 143 citations and an average of 23.83. Then there is Sheng et al. [66] with 109 citations and an average of 15.57 per year, and Chang et al. [67] with 106 citations and an average of 21.20 per year. Table 13 "Most cited papers" exhibits the 25 articles with the greatest citation counts.
In the most cited article of the collection, Reyes et al. [63] presents a multidimensional approach based on the characteristics of representativeness and relevance to detect irony in tweets, one of the main challenges faced by SA when determining the polarity of tweets [68] to evaluate a company's reputation or support decision-making in it. The tweet irony detection model is trained on a corpus of tweets that explicitly claim to be ironic by including the hashtag #irony. The model is evaluated with another corpus of untagged tweets to determine whether they are ironic and checks the results manually; however, this did not obtain a high precision.
The second article with the highest number of citations corresponds to Khan et al. [64]. They also use the social network Twitter in their article as a source of information and focus on developing a hybrid classification scheme with several steps of preprocessing the data before being classified to solve the most common problems of SA: classification accuracy, data sparsity, and sarcasm. In preprocessing they clean the corpus by removing URLs, hashtags, usernames, special characters, and stopwords. Once the cleaning is done, they proceed to classify the tweets with the hybrid scheme, which is based, on the one hand, on SA founded on lexicon with the SentiWordNet dictionary and, on the other hand, on the detection and interpretation of emoticons and an enhanced polarity classifier incorporating a lexicon of positive and negative words.
The third article of the classification is Del Vecchio et al.'s [65], who applies SA using ML to identify tourists' opinions of a tourist destination from official hashtags on the main social networks (Facebook, Twitter, and Instagram) to support decision-making regarding the creation of new business models, custom offers, and generating greater trust and transparency for customers. The article aims to demonstrate how tourist-generated content, which makes up a source of data of great value and enormous magnitude in terms of its volume, can be used to create value in a smart tourist destination.
Chang et al. [67], the article ranking fifth in terms of the highest citation count, has a similar purpose by extracting ratings and opinions from the TripAdvisor portal about a hotel chain. The particularity of this work is that they perform ABSA, one of the methods that, as already commented on in the literature review section, is most frequent when SA is applied to identify opinions about products or services, allowing discriminating between in the same sentence positive and negative attributes about different hotel services such as cleaning, food, and attention, among others.
The fourth article on the list corresponds to a literature review that addresses academic works related to Big Data in management research. This work compiles and classifies articles on big data in 5 areas: organization, operation and production, marketing, information management, and others. Within the field of marketing, it incorporates SA. Although this article by Sheng et al. [66] frames SA exclusively from a marketing perspective because it is the business area that is most frequently used, this paper has shown that its application is not only limited to the marketing area, but can be applied to many others, especially operations to detect risks, for example in the supply chain.
4.4.3. Word cloud
To identify recurring themes among all the collected works, a word cloud has been generated with the most frequent terms. For greater specificity and significance, it has been decided to base it on bigrams (pairs of words) that are only included in the titles of the articles. The following Figure 9 "Most frequent bigrams cloud" shows the result.
Obviously, "social media", "opinion mining", "media analytics", "online reviews", "business intelligence", and bigrams of similar characteristics are common to most of the articles. There are also some SA methodologies such as "aspect based sentiment", which focuses on identifying different attributes with their corresponding polarity values within the same sentence instead of assigning a general polarity to that sentence [69], "neural network", "machine learning", "clustering algorithm", "fake reviews", or "based sarcasm", which as mentioned above try to produce advances in aspects with which SA encounters certain problems.
But, going into more detail there are some specific fields of application of these methods to business: "chain risk", "supply chain", "stock market", "product ranking", "banking sector", "cryptocurrency market", "textual aftersales", and "corporate reputation". These bigrams indicate that SA applied to business has already been used to analyze opinions in the supply chain and its risks, to analyze the customer's view of the company and after-sales service and, to a large extent, in the traditional financial sector both in terms of banking entities and stock markets and in the most disruptive aspect with the rise of cryptocurrencies. Likewise, terms referring to the impact of the COVID-19 pandemic, which greatly affected businesses, are also identified: "covid pandemic", "covid outbreak".
These keywords already leave some brushstrokes of the topics that have been worked on in the field of SA research applied to business decision-making, providing a general impression about what has been written so far.
4.4.4. Factor analysis
Focusing on the content of the collected articles, we proceed to the factor analysis of the documents with the method of multiple correspondence analysis to find out how closely related the keywords of the articles are to each other and to be able to interpret how close or distant are the specific research subareas framed within the application of SA to business. In the following Figure 10 "Factor analysis", it is observed that the first dimension, located on the abscissa axis is represented by words with more quantitative or technical attributes the greater the degree of the dimension, noting in its highest values keywords that refer to the methods and algorithms "learning algorithms", "learning systems", "natural language processing", etc., and in their values closest to zero or even negative words that have a more subjective or qualitative connotation and that correspond to the application of algorithms to concrete realities "Word of mouth", "customer", "opinion", "investor sentiment", "twitter", etc. The second dimension, that of the ordinate axis, refers to the specific areas to which the commented algorithms have been applied, placing in the values below zero the areas focused mainly on the lexicon (articles that develop SA lexicons in specific languages or areas could be included here) and as the "Y" axis increases in value, areas of application are seen in a more business contexts: "investor sentiment", "customer", "product", "online reviews", "business", even establishing a separate category due to the large number of articles in this area that is the sector of hospitality and tourism "tourism".
The highest proportion of words is concentrated is in the qualitative area, but they are found in large numbers both in the part most closely linked to the business context and in the most generic part.
Considering the two previous dimensions, the following Figure 11 "Most relevant documents of factor analysis" shows the documents that have contributed most to these dimensions. Thus, in the upper left quadrant (application in business context and with subjective or qualitative connotation) are framed the papers of Marcolin et al. [70] and Bacik et al. [71], which deal with hotel guests' SA; Yalcinkaya et al.'s [72], which analyzes sentiment in restaurants; and Caviggioli et al.'s [73], which analyzes the corporate reputation of companies that adopt Bitcoin as a means of payment. In the upper right quadrant (application in business context, but with a more technical approach) is that of Kim et al. [74], based on an example of comparing smartphones but with the focus on revealing gaps between the market leader and competitors, and valid for any other sector. In the lower left quadrant (articles not so focused on a business context but on the generation of models applicable to the company) is framed the article by Zhang et al. [9] developing a classification model of products that may interest a specific customer according to their preferences based on ABSA reviews of other customers, and the article by Chung and Zeng [75] that develops a model to dissect user emotion and influence in social networks. In the lower left quadrant (in which the articles with a more technical purpose are located) is the article by Dai et al. [76], based on the development of a text mining model to collect and analyze competitive intelligence.
The clusters mentioned above can also be seen in a more visual and structured way in Figure 12 "Dendogram of topics". The red cluster focuses on eWOM opinion mining in tourism. Another cluster focused on technical aspects of algorithms and sentiment classifiers is in blue. A third cluster focused on the application of these to the business context is in green.
4.4.5. Document review
The analysis is completed with a detailed review of the articles taking as reference what was commented on in the previous figure. The compilation of works provides publications which, within the subject of the application of SA to decision-making in a business context, can be grouped into different subcategories according to the approach used by the authors in their articles. Thus, there are publications that, as already mentioned in the factor analysis, are based on the comparison of SA algorithms, a second group that brings together publications on empirical studies that use SA (or develop approaches combining SA with other methodologies), as a tool to develop conclusions on some aspect of the company and, finally, a third group that focuses on the application in the hospitality sector due to the high number of publications found in this sector.
Group 1: Comparison of SA algorithms
Some of those collected papers do not make a practical application of the methodology to solve business issues, but focus on the method, comparing sentiment classifiers to determine which has the highest accuracy, such as Eletter [77] that performs a comparison of five classifiers (Deep Learning, Decision Tree, Logistic Regression, SVM, Naive Bayes) using restaurant customer reviews as a sample. It concluded that deep learning was the most accurate, and Naive Bayes was the one with the lowest accuracy rate. The remaining three were evenly matched. Basani et al. [78] perform a similar experiment comparing the Naive Bayes classifier with a support vector machine (SVM) and again obtain a lower accuracy for Naive Bayes. Also related to classifiers is the paper of Balusamy et al. [79] that develops a three-level text classifier in which a principal component analysis (PCA) followed by support vector machine (SVM) and conditional random fields (CRF) is performed to analyze the sentiment of a collection of tweets.
Other articles have focused on finding possible solutions to the limitations presented by SA, one of them being irony and sarcasm, which causes erroneous results in the analysis. Reyes et al. [63] presents a model for detecting irony in tweets trained with a corpus of tweets that explicitly declare to be ironic when including the hashtag #irony. This model was tested by applying it to unlabeled tweets to determine whether they were ironic and the results were checked manually, but the accuracy was not high.
On the other hand, some of the articles focus on the implementation of systems that integrate the entire process of collection, analysis, and visualization of data and results to make SA accessible to organizations, as in the work of Boumhidi et al. [80], whose proposal integrates data collected from Twitter, Facebook, Amazon, and TripAdvisor, among other platforms, continues with spam filtering, and reviews popularity analysis along with other parameters such as publication time and ABSA to generate reputation values of companies in a visual way with the graphic visualization tool that it incorporates.
Specifically focused on Twitter is the article of De Oliveira Júnior et al. [81], which collects and analyzes sentiment, and provides visualizations to monitor anonymous real-time searches of tweets on a given topic, in a way that offers a utility in supporting business decision-making. The classifiers used for SA are Naïve Bayes and decision tree algorithms and they choose a lexicon-based SA.
Some studies compare and show different techniques and software tools (free access web services) to carry out sentiment analysis, such as the study by Serrano-Guerrero [82]. This study examines the ability to classify and rate different text fragments with respect to the sentiments they contain.
Group 2: Empirical studies using SA applied to the company
SA has been used in a variety of contexts to identify and analyze user sentiments allowing them to obtain relevant and useful information for decision-making in different areas, such as supply chain management, operations management, the hotel and restaurant sector, the stock market, the automotive industry, real estate agencies, the financial and banking sector, hospitals, and retail, and also with different purposes, including the measurement of a company's corporate image or brand sentiment and risk identification. The ability to perform real-time analysis has enabled faster and more accurate decision-making in critical situations, which can be critical to the success of a business [83]. Some of the articles in the compilation that have used this method to support decision-making are summarized below.
Deiva Ganesh and Kalpana [15] propose a streaming data analysis approach to identify supply chain risks in real-time. They use Twitter's streaming API to extract real-time information. They filter with the Python modules Regular Expression (Regex) and Fuzzywuzzy the tweets that contain relevant terms based on coincidences with previously defined expressions, and then calculate the polarity and subjectivity values to obtain tweets that may contain relevant information in order to contribute to fast and reliable decision-making, in what is referred to as supply chain management. In critical situations, quick action can seem transcendental, and with previous methods the identification of risks in the supply chain took a longer time, something that is solved with real-time SA.
Risk identification is one of the most common solutions given to NLP techniques. Xia [84] introduces a multi-level integration framework utilizing advanced neural network models for the detection and extraction of adverse drug events. This framework can be applied to social networks by leveraging user feedback to identify novel adverse effects.
Saura et al. [85] identify data-driven strategies in operations management from user-generated data on the social network Twitter. They use TextBlob to perform SA, and differentiate the different topics with LDA. They conclude that the topics of automation, data, forecasting, mobile accessibility, and employee experience are positive, the security intelligence issue is negative, and the operational CRM and digital teams topics are negative.
In terms of articles analyzing the company's corporate image Eachempati et al.'s [86] develops a deep neural network approach and uses as a data source the information that organizations disclose on the internet, either voluntarily or mandatorily, to assess how the sentiment of these disclosures influences the companies' stock market listing, with the company itself even being able to influence the listing by pre-reviewing its disclosures with the predictive algorithm.
Peng and Wan [4] also emphasize the corporate image of the company as its focal point by constructing a model that evaluates corporate image based on topics analysis and lexicon-based SA. They propose this method as a novel alternative to expensive and time-consuming surveys that also have the handicap of providing cross-sectional or static results, so the proposed method has the advantage of providing updated results.
Singh and Verma [87] investigate how to represent company reputation and user sentiment toward a brand using Twitter data about delivery companies and how this can contribute to the company's decision-making. They perform a supervised machine learning comparison with four different classifiers to compare them with each other: Logistic Regression, Random Forest, GBT Classifier, and Multilayer Perceptron Classifier (MLPC), and determine that the multilayer perceptron is the most accurate, so they finally choose it for the SA model.
Caviggioli et al. [73] use SA to measure how the dissemination of news in the media pertains to the adoption of Bitcoin as a payment method by these companies affects the reputation of an e-commerce company on Twitter, based on tweets that mention the company or key pieces of it.
SA can not only focus globally, but also by products to be able to improve or market them in the best way serving consumers. This is what Luo et al. [88] does, identifying the psychological cognition of consumers about energy-efficient refrigerators to provide suggestions to manufacturers and managers of e-commerce from the analysis of reviews and thus be able to better define their trading strategies. They propose an ML-based model that includes support vector machines (SVM), Naive Bayes, latent Dirichlet allocation (LDA), and importance-performance analysis (IPA). As a result, they get a ranking of features that customers are most satisfied with.
Liang et al.'s study [89] is based on the review of reviews on a Chinese e-commerce website of all kinds of products by identifying the topics discussed with LDA and applying supervised ML-based SA to the reviews toward different attributes, combining LSTM and PLTS. The results obtained are a series of attributes or topics that are most talked about in the reviews and their corresponding sentiment scores, which gives the company a quick and summarized idea of which aspects customers highlight about the products it sells and which should be improved.
In the study conducted by Sathyan et al. [13], SA is incorporated as a component of a predictive model that integrates big data analytics and fuzzy DEMATEL. The objective is to forecast demand and enhance supply chain agility in the automotive industry. It uses customer feedback to detect which are the attributes of the vehicles that most influence the purchase decision and analyzes these attributes with a multi-criteria decision-making method (MCDM) technique, specifically the fuzzy DEMATEL method.
The MCDM is also used by Abirami and Askarunisa [3] to rank hospitals according to a score generated by different criteria with their corresponding weights from lexicon-based SA to online user reviews. The study concludes that effective online reputation management is essential for maintaining user trust, as reputation and quality improvement are closely intertwined, and that this methodology allows measuring the customer experience faster and with less effort than with traditional surveys.
Another technique included in multicriteria decision-making methods (MCDM) is VIKOR, which is used by Zhang et al. [9] in a customer-focused model to generate a classification of products related to those sought and order them by relevance based on customer satisfaction obtained by SA founded on lexicon for its different attributes (price, brand, etc.). They conduct the study using automobiles as examples, as does Zhou et al. [90] in their paper as well.
Hui Chi et al. [91] examine how the interactions of potential real estate customers on real estate agencies' Facebook posts influence their interactions. It collects the number of likes, comments, photos, videos, links, etc., and the text of the post, to which it applies SA to obtain sentiment polarity. The aforementioned metrics are used as independent variables to determine the dependent variable, which is the commission received by the real estate agency and from which they have a database to find the correlation with the independent variables. This methodology can be used by real estate agencies to improve sales with a careful Facebook publication strategy, as well as creating a predictive model.
The application of SA has also been used in the financial sector, specifically by Kim et al. [14], who study the bullish or bearish market sentiment of cryptocurrencies by mining Bitcoin-related Twitter data and Google Trends to check the rising or falling interest in the topic and its sentiment, and mining data from the stock market and cryptocurrency trading platforms to obtain stock prices. The study is framed in a hidden Markov model (HMM).
The banking sector in its aspect of customer relationship management is another field of application of SA, Alamsyah et al. [92], based on Twitter data, and Ramos et al. [93] propose to use data available online to manage relationships with stakeholders.
Symeonidis et al. [94], in order to determine whether social networks, mainly Twitter, are appropriate to analyze customer opinions, collect tweets for a full year about the iPhone 5 to find through SA whether or not there is purchase intention in the tweet, intention to compare with another product, or aim to seek more information about the device. They conclude that Twitter is a platform that needs to be considered from a management perspective to gain meaningful insights into customers' intentions and their products in order to improve them, as well as to identify what aspects customers emphasize about the product and focus marketing campaigns on promoting those benefits or qualities.
Kauffmann et al. [95] have a similar objective when presenting a general framework that uses NLP techniques to perform ABSA of products in the Amazon marketplace, specifically mobile phones, and to comprehend the requirements and demands of consumers.
Also, Kim et al. [74] take the smartphone market as a reference for their study. They use Twitter as a data source to demonstrate that the volume of tweets available during a temporary period in this social network contains competitive intelligence that enables revealing gaps between the market leader and competitors.
At the same time that eWOM has become popular, fake comments also appear that denigrate the image of a company and can affect the business, so there are also publications that propose detection models of these fake comments, such as Tufail et al.'s study [96] that, using the Support Vector Machine (SVM), K-Nearest Neighbor, and logistic regression (SKL) classifiers, demonstrates high accuracy in classifying fraudulent comments based on bigrams, pronouns, verbs, and feelings.
Group 3: SA in the hotel and tourism sector
In the factor analysis of Figure 10, it is observed that articles related to tourism generated a new category. This is because the hospitality sector is widely represented in the compilation that has been carried out. In Del Vecchio et al. [65], SA is used based on ML to evaluate the opinions of tourists about a particular tourist destination. The information is obtained from official hashtags used in the most popular social networks (Facebook, Twitter, and Instagram) in order to support decision-making regarding the development of novel business models, the personalization of offers, and the generation of greater trust and transparency in customers. The main objective of the study is to demonstrate how tourist-generated content, which represents a very valuable and large data source, can be used to create value in a smart tourist destination.
Also, in order to identify what guests think about a hotel, Chang et al. [67] analyze the ratings and opinions of hotels on TripAdvisor. The distinctive feature of this paper is that they carried out ABSA, which permits discriminating between positive and negative attributes in the same sentence, in relation to different hotel services, such as cleanliness, food, and attention, among others.
For their part, Bacik et al. [71] distinguish in their article according to the type of stay in business travelers, couples, friends, family, and single travelers, and also use TripAdvisor as a source of reviews to analyze sentiment.
Focusing on the restaurant sector, Yalcinkaya and Just [72] compare customer sentiment in two types of restaurants, local and those belonging to a chain, based on four attributes: service, food, price, and ambience. They conclude that sentiment toward chain restaurants is more polarized. They use lexicon-based SA, specifically the Bing lexicon of the Tidytext package in R, and justify their choice in the similar precision with ML and in the lack of need to train the model. Reviews are obtained from Google Reviews.
In the era of the COVID-19 pandemic, when hygienic measures in restaurants were intensified, online customer reviews could also provide valuable information for restaurants to understand their needs. Luo and Wang [97] perform a comparative investigation of deep learning models for the analysis of restaurant reviews during the pandemic posted on the Yelp portal. They use the Decision Tree, Simple Embedding + Average Grouping, Bidirectional LSTM, and Random Forest classifiers.
Another interesting solution is predictive algorithms, which can be used to predict business failure or success through an analysis of business survival that helps companies achieve better performance and improve managers' decision-making. This is suggested by Li et al. [98], taking the restaurant industry as an example. In the paper, customer reviews are used to perform ABSA and get customer sentiment for five specific aspects of the restaurant. In addition, it predicts the survival of the restaurant based on certain characteristics in the reviews that are taken as optimal indicators.
5.
Discussion
This manuscript constitutes a different proposal to all previous works because, on the one hand, it studies manuscripts up to 2023 and thus updates all the previous information from other systematic literature reviews and bibliometric analyses.
On the other hand, it is specialized in sentiment analysis in the fields of business, management, economy, social sciences, and decision-making. In the authors' opinion, this is a field that has grown so much in recent years that this paper can be considered an original and different contribution to those previously published.
Based on the reading of the articles collected and their bibliometric analysis with the Bibliometrix tool, with which it has been possible to identify various statistical patterns that describe the state of the art in this field of SA research applied to the improvement of decision-making in business, the research questions posed are answered:
With reference to RQ1, the growing interest in research to address SA as a methodology to identify areas of improvement in products, services, or processes is a reality that year after year has experienced growth, and is evident in Figure 3 "Evolution of the number of publications". Specifically, since 2015, this method which some authors describe as an alternative to traditional surveys has become popular [3], but, even more so, since 2018 the increase has reached its highest level. The focus is mainly on Asian countries such as China, India, and Pakistan, and in the West in Spain and the United States according to Table 10 "Number of publications per country".
RQ2 focuses on finding out in which areas these methods have been applied in the collected literature. Thus, it has been concluded that the scope of application of SA to support decision-making in a business context is very diverse and can be applied to any company that has textual data online, and in the explained document review articles from sectors have been found: supply chain management, operations management, the stock market, the automotive industry, real estate agencies, the financial and banking sectors, hospitals, and retail trade. Especially noteworthy above the rest is the hotel and catering sector, as a considerable number of articles apply SA to improve the experience of guests in hotels and customers in restaurants. From a global perspective, its application so far has focused mainly on marketing areas to identify the perception that customers have about a company or product and on operations areas for the identification of risks. However, this methodology has the potential to be applied to many other areas of the company that so far have not been so questioned in the scientific literature.
For RQ3, referring to the data sources used for SA, it has been concluded that they are mainly Twitter and, second, Amazon. The former because it is one of the most used social networks worldwide, resulting in a substantial quantity of users commenting on any topic, and its short, spontaneous, direct, and real-time text format makes it a platform conducive to observing opinions of a very diverse and international audience. Added to this is the fact that there are SA models based on machine learning specialized in Twitter that have been trained with samples of thousands of tweets, for example, the RoBERTa model [99], and the ease with which the information can be obtained due to the existence of the Twitter API that can be accessed from the social network's developer portal. The latter, Amazon, because it is one of the most well-known marketplaces in the world and has the largest number of products, constituting an extensive database in which each product has useful customer reviews to be analyzed along with other parameters such as price, descriptions, etc. Google Reviews, Facebook, and TripAdvisor, among others, are also found as a source of data.
In response to RQ4, regarding the content of the articles, it is observed that, although there are numerous cases in which it is applied independently, SA is also frequently combined with other methods to create the models, the multicriteria decision making method (MCDM) being one of the most common combinations that usually appear based on fuzzy DEMATEL or VIKOR when the objective is to generate a comparative ranking based on customer sentiment. In addition, SA is being used with predictive algorithms, which from the available data try to predict future aspects such as demand or the image of a company from the sentiment of online reviews [13,14,86,98,100], and it is about achieving the greatest concreteness of information both in temporal and organizational terms. Hence, there is considerable interest in obtaining real-time data [15,81] and in its classification in different topics combining it with other techniques framed within natural language processing such as topics analysis with the LDA model (Latent Dirichlet Allocation) or directly performing aspect-based sentiment analysis (ABSA) [67,95,98].
6.
Conclusions
The digitalization process is nowadays essential for organizations to maintain a sustainable competitive position in a constantly and rapidly changing market and, therefore, SA solutions are postulated as valuable tools that provide information in a fast and accessible way to improve the company and adopt customer-centric approaches. There has been a growing interest in recent years, popularizing this methodology as an alternative to traditional surveys to be less expensive and faster, or even immediate in real time.
In the academic field, the research is focused on Asian countries such as China, India, and Pakistan and can be applied to any company that has textual data online, often from social networks or online review platforms. Articles have been found in different business sectors, especially in the hotel and catering sector. To date, this tool has been widely used for marketing and operations, but there are also more business areas where it can be applied. SA is usually combined with other methods to create models, such as the multicriteria decision making method or predictive algorithms.
SA still has many limitations: obviously, it does not have the same capacity as a person to ascertain the sentiment expressed in a text, but it is clear that artificial intelligence is here to stay and will continue to evolve and improve its accuracy. Therefore, it seems essential to incorporate it into organizations, not to replace human capital but to facilitate and streamline the workflows of people when they have to make decisions and not fall into obsolescence in a highly competitive environment.
Among these limitations of SA in its application to decision-making are several aspects. In addition to the limitations related to the method itself that were discussed in Section 2.1 "Sentiment analysis definition", such as the focus on the English language, the difficulty in detecting irony and sarcasm, and the difficulty to discriminate between opposing sentiments toward different attributes in the same sentence [30], there are also limitations in its application to decision-making, mainly due to the constant activity and immediate change in the business world, which increasingly requires a faster analysis for organizations that even demand to do it in real time, and also in the format of the source, since much of the information is in videos and audio files, not just text as most analyses currently focus on. Another limitation is the complexity involved in customizing SA models for each organization or sector considering the jargon and the specific context they use, which will give greater precision to the analysis than using a generically trained model or a common lexicon. And, finally, rather oriented to the predisposition of organizations for the implementation of SA, it is observed that it is mainly used for marketing studies, forgetting other areas of the company that are susceptible to application.
Use of AI tools declaration
The authors declare they have not used Artificial Intelligence (AI) tools in the creation of this article.
Conflict of interest
The authors declare there is no conflict of interest.