Research article

Assessment of irrigation shortfall using WATHNET in the Otago region of New Zealand

  • Received: 15 May 2018 Accepted: 04 September 2018 Published: 11 September 2018
  • Knowledge of the likely rainfall and river flow for a coming season can improve management of an overall water resources system without unduly compromising either the environmental or productive behaviour of the system. The objective of this study has been to assess the probability of irrigation demand shortfalls, i.e. soil moisture deficits, for a typical “run of the river” irrigation scheme so as to identify the duration and severity of potential shortfalls. In this study a multi-objective linear programming tool WATHNET has been used to build and run a model of the irrigation scheme. The focus of this study has been on how to use predictions of 3-monthly rainfall and temperature to estimate potential daily water available for irrigation. The method uses Monte-Carlo simulations, to produce multiple replicates of equally likely sequences of river flows, rainfall and potential evaporation values. A sub-set of the equally likely sequences is then selected using prediction information of the likely seasonal climate outlook from NIWA’s Climate Update. The selected sequences, which are biased towards the seasonal climate prediction, are then used as inputs to multiple model runs. By using the output from all the “biased” model runs a probability distribution can be made of water availability for irrigation. The methodology has been demonstrated using the Shag River Irrigation Scheme located in the Otago region of New Zealand. The results compare the predicted soil moisture variation over two three-month periods with retrospective simulations based on the observed rainfalls, river flows and potential evaporation values. Results suggest that WATHNET can simulate 3-month soil moisture dynamics. In order to develop WATHNET as a tool to assess probabilities of irrigation shortfall it needs to be validated using measurements of soil moisture variations over an irrigation season at sites with different soil types.

    Citation: Shailesh Kumar Singh, Richard Ibbitt. Assessment of irrigation shortfall using WATHNET in the Otago region of New Zealand[J]. AIMS Geosciences, 2018, 4(3): 166-179. doi: 10.3934/geosci.2018.3.166

    Related Papers:

    [1] Sajana Pramudith Hemakumara, Thilini Kaushalya, Kamal Laksiri, Miyuru B Gunathilake, Hazi Md Azamathulla, Upaka Rathnayake . Incorporation of SWAT & WEAP models for analysis of water demand deficits in the Kala Oya River Basin in Sri Lanka: perspective for climate and land change. AIMS Geosciences, 2025, 11(1): 155-200. doi: 10.3934/geosci.2025008
    [2] Adeeba Ayaz, Maddu Rajesh, Shailesh Kumar Singh, Shaik Rehana . Estimation of reference evapotranspiration using machine learning models with limited data. AIMS Geosciences, 2021, 7(3): 268-290. doi: 10.3934/geosci.2021016
    [3] Dek Vimean Pheakdey, Tran Dang Xuan, Tran Dang Khanh . Influence of Climate Factors on Rice Yields in Cambodia. AIMS Geosciences, 2017, 3(4): 561-575. doi: 10.3934/geosci.2017.4.561
    [4] Maurizio Iaccarino . Why there is water scarcity. AIMS Geosciences, 2021, 7(3): 529-541. doi: 10.3934/geosci.2021030
    [5] Wahidullah Hussainzada, Han Soo Lee . Impact of land surface model schemes in snow-dominated arid and semiarid watersheds using the WRF-hydro modeling systems. AIMS Geosciences, 2024, 10(2): 312-332. doi: 10.3934/geosci.2024018
    [6] Sergii Skakun, Eric Vermote, Jean-Claude Roger, Belen Franch . Combined Use of Landsat-8 and Sentinel-2A Images for Winter Crop Mapping and Winter Wheat Yield Assessment at Regional Scale. AIMS Geosciences, 2017, 3(2): 163-186. doi: 10.3934/geosci.2017.2.163
    [7] Shailesh Kumar Singh, Nelly Marcy . Comparison of Simple and Complex Hydrological Models for Predicting Catchment Discharge Under Climate Change. AIMS Geosciences, 2017, 3(3): 467-497. doi: 10.3934/geosci.2017.3.467
    [8] Rosazlin Abdullah, Firuza Begham Mustafa, Subha Bhassu, Nur Aziaty Amirah Azhar, Benjamin Ezekiel Bwadi, Nur Syabeera Begum Nasir Ahmad, Aaronn Avit Ajeng . Evaluation of water and soil qualities for giant freshwater prawn farming site suitability by using the AHP and GIS approaches in Jelebu, Negeri Sembilan, Malaysia. AIMS Geosciences, 2021, 7(3): 507-528. doi: 10.3934/geosci.2021029
    [9] Shishay T Kidanu, Gebremedhin Berhane, Mogos Amare, Mulubrhan Kebede . Assessment of rock mass properties and load-bearing potential in low-grade metamorphic rocks: A study from the Tigray region, Ethiopia. AIMS Geosciences, 2024, 10(3): 498-523. doi: 10.3934/geosci.2024026
    [10] Maurizio Barbieri, Tiziano Boschetti, Giuseppe Sappa, Francesca Andrei . Hydrogeochemistry and groundwater quality assessment in a municipal solid waste landfill (central Italy). AIMS Geosciences, 2022, 8(3): 467-487. doi: 10.3934/geosci.2022026
  • Knowledge of the likely rainfall and river flow for a coming season can improve management of an overall water resources system without unduly compromising either the environmental or productive behaviour of the system. The objective of this study has been to assess the probability of irrigation demand shortfalls, i.e. soil moisture deficits, for a typical “run of the river” irrigation scheme so as to identify the duration and severity of potential shortfalls. In this study a multi-objective linear programming tool WATHNET has been used to build and run a model of the irrigation scheme. The focus of this study has been on how to use predictions of 3-monthly rainfall and temperature to estimate potential daily water available for irrigation. The method uses Monte-Carlo simulations, to produce multiple replicates of equally likely sequences of river flows, rainfall and potential evaporation values. A sub-set of the equally likely sequences is then selected using prediction information of the likely seasonal climate outlook from NIWA’s Climate Update. The selected sequences, which are biased towards the seasonal climate prediction, are then used as inputs to multiple model runs. By using the output from all the “biased” model runs a probability distribution can be made of water availability for irrigation. The methodology has been demonstrated using the Shag River Irrigation Scheme located in the Otago region of New Zealand. The results compare the predicted soil moisture variation over two three-month periods with retrospective simulations based on the observed rainfalls, river flows and potential evaporation values. Results suggest that WATHNET can simulate 3-month soil moisture dynamics. In order to develop WATHNET as a tool to assess probabilities of irrigation shortfall it needs to be validated using measurements of soil moisture variations over an irrigation season at sites with different soil types.


    1. Introduction

    Efficient irrigation is crucial to raise agricultural productivity in any country, and to improve environmental outcomes resulting from farming activities. New Zealand's agricultural productivity is boosted by irrigation. The amount of increased productivity depends on the crops that are grown and the weather over each growing season. Over many growing seasons, productivity will be affected by the adequacy of the region's water supplies to meet irrigation demand, with available water supplies likely to be affected by changes to the climate. Thus when designing a potential irrigation scheme, tools are needed to assess the ability to meet inherently uncertain future irrigation demands over monthly, seasonal, annual, and decadal time periods [1].

    When soil moisture drops below a certain percentage of the plant available water, irrigation needs to be applied if crop yield is not to deteriorate [2]. Water supply for irrigation usually comes with restrictions when there is not enough natural soil water recharge [3]. Typically, legislative restrictions limit abstraction from river(s) to maintain ecological values. Other significant factors can also control the availability of water for irrigation and these must all be taken into account. They include such things as the requirements of other users, natural inputs, i.e. rainfall and potential evaporation, differences in soil types because of their different moisture holding capacities, and the water demands of different types of land use.

    Knowledge of available water in the coming season can help better management of water resources without unduly compromising crop production or the environment. Hence, there is a need for tools to estimate availability of water for a coming season's irrigation.

    This need can be addressed by developing estimates of future water availability for various possible scenarios where the scenarios are based on historical climate conditions [4]. Each scenario represents a unique combination of probable future behavioural and climate conditions.

    The objective of this study is to assess the probability of irrigation shortfalls for a specific irrigation scheme, and uses the WATHNET system to provide a flexible approach to achieve this objective. It has two main advantages over other available systems: It is a purpose-built planning tool for modelling the interaction of demand, supply and constraints, and has a long history of successful use [5,6,7,8,9,10,11,12]; it can handle complex conditions on water abstractions unlike other systems most of which can only impose minimum flow conditions, e.g. the water balance model WATYIELD [13].


    2. Methodology


    2.1. The Shag River irrigation scheme

    The concepts of this paper have been demonstrated using "The Shag River Irrigation Scheme (SRIS)". This irrigation scheme was selected because of data availability from previous work [14]. The Shag River irrigation scheme is located in East Otago in the South Island of New Zealand (Figure 1). Irrigation water is drawn from multiple points along the river and used directly by properties with the requisite consents. While there are plans for surface storage of water these have not yet been implemented. There are no known groundwater withdrawals and there is no diversion of water into the catchment. The Shag River is the only source of irrigation water within the catchment. The Shag River is gauged at two locations namely, the Shag at The Grange (site number 72603) and the Shag at Craig Road (site number 72690). The catchment drainage areas at The Grange and Craig Road are 319 and 428 km2 respectively. Table 1 shows the statistics of flow for the measurement locations. The catchment precipitation is based on the rainfall measured at Stoneburn in the south of the catchment, site number 504502.

    Figure 1. Location of Shag River irrigation scheme and major land use types (High producing exotic grassland is the irrigated area).
    Table 1. The Hydrological characteristics of the Shag River (7-day MALF is 7-day mean annual low flow) [22].
    Drainage area (km2) Mean annual Precipitation(mm) Mean Flow (m3/s) Median flow (m3/s) 7-day MALF (m3/s)
    The Grange 319 652 1.67 0.59 0.16
    Crag Road 428 652 2.12 0.71 0.16
     | Show Table
    DownLoad: CSV

    The SRIS has four main soil types, Table 2, and while these are scattered across the irrigable area, they have been aggregated for modelling purposes. Figure 2 shows the schematic of the SRIS as modelled using WATHNET with details given in following section.

    Table 2. Soil areas with different moisture holding capacities [14].
    Soil Moisture capacity (mm) Area km2 % of total irrigable area
    40 8.32 10.8
    80 47.88 62.2
    100 7.19 9.3
    120 0 0
    140 0 0
    160 13.64 17.7
    Total area 77.03 100
     | Show Table
    DownLoad: CSV
    Figure 2. The Shag River Irrigation Scheme (SRIS) as modelled using WATHNET—see text for a description of individual features.

    2.2. WATHNET modelling

    WATHNET [5] is a multi-functional, objective-based, water resources system multi-objective linear programming model that can simulate, optimize and calibrate simple to very complex water resources systems. The WAHNET model was developed at University of Newcastle, Australia. One of the components of WATHNET is a tool that allows the user to build models that are specific to their system and which conform to the requirements for solution as a multi-objective linear programming problem. Models built using WATHNET are quite general and can apply different types of constraints to allocate water within a system. In this respect it departs from a more traditional "headroom" based approach for assessing system capacity such as outlined in the UK Water Industry Research (UKWIR) publication "An Improved Methodology for Assessing Headroom—Final Report" [15]. Use of a scripting language enables the user to apply complex runtime functions to model components [11]. Models built using WATHNET can simulate the operation of a wide range of water supply network configurations, and can use as input, information about the current state of a system, as well as predicted flow and demand.

    WATHNET uses information about the current state of a system (initial conditions), and time series of predicted flows and demands for stepping simulations forward in time.

    In a normal WATHNET approach sequences of demand data are used to "draw" water through a water supply system subject to different types of constraint, e.g. pipe sizes, allowable abstractions, etc. For an irrigation scheme, demand is determined by how much water is required to raise soil moisture to field capacity. Thus the SRIS model departs from the default hierarchy of model objectives given below, in the ways shown in brackets after each item, in order of decreasing priority [10]:

    ● Satisfy demand at all demand centres (not used);

    ● Satisfy all instream flow requirements and constraints (abstraction conditions set by the regulator; highest priority);

    ● Ensure that reservoirs are at their target volumes (the target volumes correspond to field capacities, and these conditions act as the system demands; second highest priority);

    ● Minimise delivery costs (used to prioritise the order in which flows use different paths in the model; lowest priority);

    ● Avoid any unnecessary spill from the system (not used).

    For use in New Zealand where environmental considerations usually outweigh demand considerations, the default hierarchy of objectives is overridden by associating higher "costs" with violation of environmental conditions.

    A WATHNET model is made up of a network of nodes and arcs and that provide a graphical representation of the system being simulated. For each model run WATHNET uses a multi-objective genetic algorithm to efficiently search through all possible solutions. For the past two decades this model has been successfully used for long term bulk water supply planning by Wellington Water in New Zealand [6,16,17]. This model has also been widely used in Australia [9,10,18,19].


    2.3. Description of the SRIS using the WATHNET system

    The model schematic is given in Figure 2. It is a topological representation of the system elements, not a geographical one, i.e. it shows the correct relationships between elements, but gives no graphical idea of their relative sizes and locations. The outcome on the model has no impact if the representation of the system elements shows the correct relationship. Size is a property attached to each element in the network when a model is built. Through their properties some elements effectively function as sub-models of the overall model. For example, the properties of the soil moisture storage units act like simple soil moisture column models in that water enters the column, any surplus runs off if the column is filled, and evaporation reduces the contents.

    Blue lines are "stream channels" whereas green lines are "conduits". The difference between "stream channels" and "conduits" is that they allow different properties to be assigned to how water flows along them. For instance, stream channels have an "infinite" capacity while "conduits" have finite maximum capacities that can be defined by conditions elsewhere in the network. The square symbols are referred to as nodes and serve to define demand centres, reservoirs, and various types of connection points between flow arcs such as stream channel segments and pipe segments (collectively called conduits).

    Nodes 1, 2, 3, 4 represent the Shag River, where node 2 is The Grange, a flow monitoring point, node 4 is Craig Road (another flow monitoring point), and node 1 is the sea. Node 3 is to enable the reach between The Grange and Craig Road to be split so that tributary inflow between the two sites can be entered into the model. The branch 4 to 5 to 6 represents the demand taken by the users. It is largely irrelevant to the functioning of the SRIS model since "demand" is introduced through the soil moisture modelling. However, every model must have a demand node (yellow symbol) and this branch fulfils that requirement. It has also been useful in checking other parts of the model and may have a future role if the model is expanded.

    The remainder of the model comprises four similar sets of nodes and arcs. A typical set consists of nodes 1, 15, 7, 11, 16. The four sets represent soil moisture storages (corresponding to the four different soil types in the SRIS) of 160 mm, 100 mm, 80 mm, and 40 mm respectively. They all function similarly so that only one set will be described in detail.

    The modelling uses a daily time step, litres to express volume units and l/s to express flow rates. This has required a number of conversions factors for quantities such as rainfall that are usually recorded in terms of depth. To convert depths to l/s the areas have to be defined over which the rain falls. The areas used represent the spatial extend of each of the major soil groups and are given in Table 2.

    Nodes 7 8, 9, and 10, the red symbols, are the soil moisture storage representing soils with decreasing capacities respectively (Table 2). An infinite supply of water is provided at nodes 16, 18, 20, and 22. The arrangement of arcs 16–11–7 limits the water drawn from the infinite supply using the consent rules relevant to the SRIS. Two rules apply:

    1. No water may be taken if the flow in the arc 2–3 is less than 100 l/s. This is the "Grange" control.

    2. No water may be taken if the flow in the arc 3–4 is less than 150 l/s. This is the "Craig Road" control.

    Above the minimum flow, the rule that applies is that takes may be up to half the available water. This rule can be easily varied if required.

    Arc 16–11 applies the "Grange" control. It does this by limiting the capacity of the arc so that no more than the arc's maximum capacity can be taken from the "infinite" supply provided at node 16. Arc 11–7 applies the Craig Rd control in the same way. By arranging these arcs in series, the one with the lowest capacity determines the supply to the soil moisture storage.

    In addition to the irrigation inflow, the storage has an input of rainfall and an evaporative loss.

    Rainfall data are input to node 23, and the "flows" in arc 23–1, which are actually rainfalls, are used to define a variable capacity for the arc 15–7, the inflow to the soil moisture reservoir (i.e. soil moisture holding capacity). By assigning an "infinite" supply to node 15, and by giving the arc 15–7 priority over arc 15–1, i.e., by giving it a cost advantage, water is drawn from the infinite supply in the correct simulation units, i.e. l/s, to the limit of the arc as defined by the actual rainfall. The arc 15–1 must be present to take the remainder of the infinite supply that cannot go down arc 15–7. A similar mechanism is used for each of the other 3 soil types, but with different conduit capacities to reflect the different capacities and spatial extent of each soil type.

    Just as the rainfall amounts on each soil type have to reflect the amount and extent of each soil type, so must the maximum storage capacity be assigned to the area of each "soil" type.


    2.4. Data used

    In this study, flow, rainfall, potential evapotranspiration, and initial soil moisture status were used as input. Since measured flow data were available for only 15 years (prior to 2004), a hydrological model TopNet [20] was build and calibrated against the measured flow data. The calibrated model was used to extend the longer precipitation and temperature data into flows (44 years, 1960–2004). The methodology adopted to extend the data is described in detail by [14,21]. Beyond year 2004 observed flow and rainfall were used. At present the evaporative losses are implicitly set at the potential rate used in the TopNet modelling.


    2.5. Derivation of a set of "conditioned" irrigation predictions

    Ibbitt [8] and Ibbitt and Woolley [16] describe a procedure that was developed for the Wellington Water, New Zealand, formerly part of the Wellington Regional Council, to help them estimate what was likely to happen to available water supply for urban consumption over the summer months. The procedure uses a probabilistic climate prediction to estimate what might happen to the temperature, rainfall, potential evaporation, and river flows over an outlook period of three months. Its main purpose is to provide a way of assessing the probability of water supply shortfall for the coming months by using a Monte Carlo simulation approach to define different sets of equally likely input conditions and demands. The procedure begins by generating a large number of replicates using a uniform distribution of input data. The key feature of the procedure is that it incorporates initial reservoir storage volumes that match those at the start of the prediction period, and uses replicate datasets consistent with the predicted climate over the coming three months. The predicted climate data is provided by the National Institute of Water and Atmosphere Research (NIWA) National Climate Centre Seasonal Climate Outlook, and is used to put bias into the input climate and river flow data.

    For this study the final outputs need to be an indication of likely soil moisture values over the outlook period so that irrigators can assess when the soil moisture deficit is likely to affect crop growth and hence when to begin irrigation. To do this a large sample, typically 10000, of possible input data is generated based on the statistics of the historical data. For each sample the total amount of water available to the soil is then calculated. This quantity is called the Potentially Available Water, (PAW), and is the sum of the legally allowable takes from the river plus any rainfall during the outlook period. The rainfall can have a threshold applied to it to allow for when surface runoff occurs, i.e. only a certain amount may enter the soil profile in a day. The PAW is a single value that characterises each replicate. The replicates are then sorted by PAW value from "driest" to "wettest" before being divided into three equal groups. Three groups are used because the Climate Outlook data provides estimates of three conditions: "Below normal", "normal", and "above normal". The terciles give the chances of conditions being in the driest third, the middle or average third, and the wettest third of those measured. So, when the Climate Update predictions were 50% average rainfall, 25% below average, and 25% above average, it would imply that the chance of conditions being average over the coming three months is twice that of it being either dry or wet. A subset of replicates that represents these probabilities is then constructed using all the "average" replicates (one third of the total number of replicates generated), but only half of each of the "below normal" and "above normal" replicates. This selection process produces a set of replicates biased in favour of average conditions.

    The probability of occurrence of each group is then used to draw a sample of replicates indicative of the likely climate outlook. For example, if 300 replicates were made representing the full range of likely PAW conditions, and if the Climate Update predictions were 50% average rainfall, 25% below average, and 25% above average, then the biased set of replicates would contain all 100 with the mid-range PAW values, corresponding to the 50% likelihood of average rainfall, 50 ( = 100/50 × 25) with lowest values, corresponding to a 25% likelihood of below normal conditions, and 50 from the "above average" category. The number of replicates to be used for conditional simulations would be 200 and would be biased in favour of "average" conditions. The selected sequences, which are biased towards the seasonal climate prediction, are then used as inputs to multiple model runs.

    Figure 3 shows how the methodology adapted for this study.

    Figure 3. Flow chart for the methodology used.

    3. Results and discussion

    WATHNET Monte-Carlo simulations were performed to produce 10000 replicates of the input data (rainfall, potential evaporation, and flow values) for the outlook period 1st December 2004 to 28th February 2005, and then the Climate Update predictions (25% above average, 50% average and 25% below average) were used to produce a "conditioned" set of inputs to produce a probability distribution of likely storage shortages at the different soil moisture reservoirs.

    Typical results for December 2004 to February 2005 (summer season) for the 4 soil types, are given in Figure 4. Each plot in this figure shows the variation of the soil moisture capacity for the 160 mm, 100 mm, 80 mm and the 40 mm soils based on predictions made on the 1st of December 2004. The x axis represents the time step in days and y axis represents the storage in the soil (mm). Four storage percentiles, 5, 50, 75 and 95 are presented. These indicate the chance of particular predicted soil moisture values being reached for different dates for each of the four soil types. Thus, the top left-hand plot shows that for the 160 mm capacity soil, there is a 5% chance (the broken red line) of the predicted soil moisture reaching a value of 60 mm by the 1st of March 2004. The solid turquoise lines, labelled "Expected", indicate the soil moisture values the model would have generated using retrospectively measured input data.

    Figure 4. The 5, 50, 75 and 95 percentile and observed data based soil moisture simulation values over the outlook period 1st December 2004–28th Feb 2005 (Normal) for the four soils with different water holding capacities. Observed daily rainfall (blue) is plotted downwards in the top of each plot.

    All four plots give an indication of how the soil moisture will fall over time and hence when irrigation may need to begin. While the rates at which soil moistures decline, and the dates when low values are reached, are based on the evaporation being at the potential rate, individual irrigators would need to factor in the type(s) of crop and their water needs. Comparison of the top left-hand plot (160 mm capacity soil) with the bottom right hand plot (40 mm capacity soil) also shows that there is greater volatility, as would be expected, for the shallower capacity soils.

    To check the results, a simulation was performed using observed input data (rainfall, potential evaporation, and flow values) for period 1st December 2004 to 28th February 2005. The simulated soil moisture values are shown in Figure 4 as solid light blue lines (labelled as "Expected"). As expected the simulated values show greater volatility than the percentile lines as they respond to individual events. Comparison with the storage percentile lines serves to put the simulated soil moisture values into their long-term perspective.

    The 2004–2005 irrigation was predicted to be "average" with a 50% chance of being correct. Under this scenario, the combination of rainfall and irrigation would have been sufficient for the two higher capacity soils to have remained close to or above 50% of their water holding capacity, despite a dry period extending from mid-January to early February. However, for the shallower, 40 mm water holding capacity soil, conditions would have been more severe and crop yield on these shallow soils would have been likely impacted. Thus, any expansion of the currently available irrigation supplies would have considerable benefit to the 10.8% (Figure 4) of the scheme with these shallow soils. Alternatively, the planting of drought resistant crops could be a practical option for these soils. So, these results can be utilised to choose cropping option.

    Figure 5 shows what the model would have predicted for a below average summer, that of year 2011–2012. This irrigation season started with a month (December) of dry weather and the model shows that there would have been a 95% chance (5%–100%) of all soils being close to their historically driest conditions. However, the rapid recovery in early January serves to show how dependent the current scheme is on "run of the river" based irrigation and summer rainfall. Clearly, off-river storage would even out some of the more extreme soil moistures that can be experienced in a "below normal" year.

    Figure 5. The 5, 50, 75 and 95 percentiles and observed data based soil moisture simulation values over the outlook period 1st December 2011–28th Feb 2012 (Below Normal) for the four soils with different water holding capacities. Observed daily rainfall (blue) is plotted downwards in the top of each plot.

    The comments above must be seen against a backdrop of assumptions that have been necessary to provide a tractable model and allow for data limitations. In particular, the study requires long records of historical input data such as precipitation, flow and evapotranspiration information. By using a combination of the latest hydrological and climatological modelling techniques an adequate length of record has been synthesised, but inevitably this record will be no better than the assumptions the different modelling techniques utilise. Nevertheless, since the data extension work uses a wide range of measured, albeit sometimes spatially dispersed data, it is considered that errors arising from input data, while recognised as inevitable, are considered within acceptable bounds. Given input data limitations, other factors that have a potential to impact upon the usefulness of the results are:

    a) All rainfall, irrespective of daily intensity, is assumed to infiltrate while the soil is below its water holding capacity. Once the soil is at capacity, surplus rainfall runs off to the river.

    b) All plant water needs are assumed to occur at the PE rate for each day.

    c) There are no structural constraints on taking water, only consent requirements.

    d) Simulations use measured flows at The Grange and tributary inflow between The Grange and the downstream site at Craig Road. While the measured flows at The Grange are understood to be largely unaffected by irrigation withdrawals as these mainly occur downstream of The Grange, downstream tributary inflows, based on differencing the Craig Road and The Grange flows are likely to be influenced by irrigation takes. In the absence of information on the actual irrigation withdrawals we have used the downstream flows at Craig Road as though they are unaffected by upstream withdrawals. This may, or may not, be realistic depending on how the consent rule for Craig Road is interpreted. However, as the purpose of this study is to illustrate the use of simulation for predicting available irrigation water, adjustment of this assumption could be made given measured irrigation takes.

    e) Different crop types and their potential to use water have not been considered. Thus, the model focuses on filling soil storage at every opportunity, even though for some crops there will be times when soil water should be restricted for plant health, harvesting conditions etc.


    4. Summary

    Knowledge of available water in the coming season can help better management of water resources without unduly compromising crop production or the environment. The objective of this study has been to assess the probability of irrigation shortfall for an operating irrigation scheme. In this study, a multi-objective linear programming model has been used to estimate the relationship between allocated water and the percentage of time that full irrigation demand is satisfied. The method has used a model built using the WATHNET system, along with Monte-Carlo simulations, to produce multiple replicates of the input data (river flows, rainfall and potential evaporation values). Prediction information of the likely seasonal climate from NIWA's Climate Update is then used to produce a "conditioned" set of inputs which enable calculation of a probability distribution of water availability for irrigation. By using the probability distribution, irrigators can assess the probability of not being able to meet their water requirements. The methodology was demonstrated using the Shag River Irrigation Scheme located in the Otago region of New Zealand. The results show that the dynamics and magnitude of soil moisture variation over two three-month periods based on the observed input, fall within predicted soil moisture storage values for each of the four soil moisture storage types. By using averaged predictions based on the expected weather over a 3-month projection period provides information on when initiation of soil irrigation may be beneficial.

    While this study has focused on seasonal risk, the WATHNET simulation model is quite general and has other potential applications for modelling the SRIS. For example, the effects of off-river storage could be included so that potential benefits might be assessed. Alternatively, climate change affected input data could be used to examine the likely effects that such changes might have, and when they might become "critical". These are, however, outside the scope of the present work and await another day.

    In order to develop the WATHNET model as a fully functional tool to assess probabilities of irrigation shortfall, future work could include:

    ● Validating WATHNET based soil moisture simulation using measured soil moisture variations over an irrigation season at sites with different soil types.

    ● Testing improvements in irrigation scheme efficiency predicted by the model by using actual demand data, rather than that based on assuming all plant water needs occur at the PE rate.

    ● Using the model to optimise potential irrigation efficiency

    ● Using the model for long-term planning. For example, by applying climate change scenarios the model can be used to test the potential long term effectiveness of irrigation infrastructure.


    Acknowledgements

    We acknowledge NIWA's Water Resources Programme for funding the work presented in the paper. The authors could like to thank the editor and the reviewers for their constructive comments which have undoubtedly improved the paper.


    Conflicts of interest

    All authors declare no conflicts of interest in this paper.


    [1] Davids Engineering I (2015) Solano Irrigation District Water Supply Shortage Risk Assessment, Available from: https://www.sidwater.org/documentcenter/view/998.
    [2] Zotarelli L, Dukes M, Morgan K (2010) Interpretation of soil moisture content to determine soil field capacity and avoid over-irrigating sandy soils using soil moisture sensors. University of Florida Cooperation Extension Services, AE460.
    [3] Oweis T, Hachum A (2006) Water harvesting and supplemental irrigation for improved water productivity of dry farming systems in West Asia and North Africa. Agr Water Manage 80: 57–73. doi: 10.1016/j.agwat.2005.07.004
    [4] Singh SK (2016) Long-term Streamflow Forecasting Based on Ensemble Streamflow Prediction Technique: A Case Study in New Zealand. Water Resour Manage 30: 2295–2309. doi: 10.1007/s11269-016-1289-7
    [5] Kuczera G, Cui L, Gilmore R, et al. (2009) Addressing the shortcomings of water resource simulation models based on network linear programming. 32nd Hydrology and Water Resources Symposium (H2009). Newcastle, Australia Engineers Australia/Causal Productions.
    [6] Singh SK, Williams G, Ibbitt R (2016) Opeartional and strategic planning for dynamic water supply system. Water New Zealand's Annual Conference & Expo, 19–21 Oct Rotorua, New Zealand.
    [7] Singh S, Ibbitt R, Mullan B (2016) Sustainable Yield Model Upgrade 2016: SYM Upgrade 2016. Wellington Water Ltd (Working on behalf of the Greater Wellington Regional Council), 85.
    [8] Ibbitt RP (2004) KARAKA model: A seasonal water availability model based on the SYM. WRC05501. Christchurch: NIWA, 57: 57 figs, 51 table.
    [9] Kuczera G, Cui L, Gilmore R, et al. (2010) Enhancing the robustness of water resource simulation models based on network linear programming. 9th International conference on Hydroinformatics. Tianjin, China: Chemical Industry Press (CIP), 2245–2252.
    [10] Cui L, Ravalico J, Kuczera G, et al. (2011) Multi-onjective Optimisation Methodology for the Canberra Water Supply System. Canberra, Australia: eWater Cooperative Research Centre.
    [11] Mortazavi M, Kuczera G, Cui L (2012) Multiobjective optimization of urban water resources: Moving toward more practical solutions. Water Resour Res 48.
    [12] Mortazavi-Naeini M, Kuczera G, Kiem AS, et al. (2013) Robust optimisation of urban drought security for an uncertain climate. National Climate Change Adaptation Research Facility Gold Coast, 74.
    [13] Fahey B, Ekanayake J, Jackson R, et al. (2010) Unisg the WATYIELD water balance model to predict catchmnet water yields and low flows. J Hydrol 49: 35–58.
    [14] Ibbitt RP (2005) Otago Strategic Water Study: 1. Natural flow series and water availability for eight catchments. ORC05503. Christchurch: NIWA, 96: 146 figs, 144 tables, 145 refs.
    [15] UKWIR (2002) An Improved Methodology for Assessing Headroom. ReportWR-13, UK Water Industry Research Ltd, London.
    [16] Ibbitt RP, Woolley K (2008) Seasonal prediction of supply and demand for a dynamic water supply system. 16–18 October Bangkok.
    [17] Ibbitt RP (1997) Documentation for the Reliable Yield Model for the bulk water supply system for the Wellington Regional Council. WRC70501. Christchurch: NIWA, 3 v.: ill. (some missing) tables, refs.
    [18] Varley I (2016) WATHNET Water Supply System Model Independent Review 2016-Final report, WaterNSW, WR2016-002J, Available from: https://www.waternsw.com.au/__data/assets/pdf_file/0019/73504/Wathnet-Water-Supply-System-Model-Independent-Review-2016.PDF.
    [19] SKM, Water Supply System Model and Yield Review 2009/2010, Volume 1: Main Report, 2011. Available from: https://www.waternsw.com.au/__data/assets/pdf_file/0003/55929/WSSMYieldReview2010Vol1.pdf.
    [20] Bandaragoda C, Tarboton DG, Woods R (2004) Application of TOPNET in the distributed model intercomparison project. J Hydrol 298: 178–201. doi: 10.1016/j.jhydrol.2004.03.038
    [21] Ibbitt RP, Woods RA, McKerchar AI (2004) Otago Strategic Water Study: 1. Natural flow series and water availability for eight catchments-Draft. Christchurch: NIWA, 72 leaves: 152 figs, 153 tables, 153 refs.
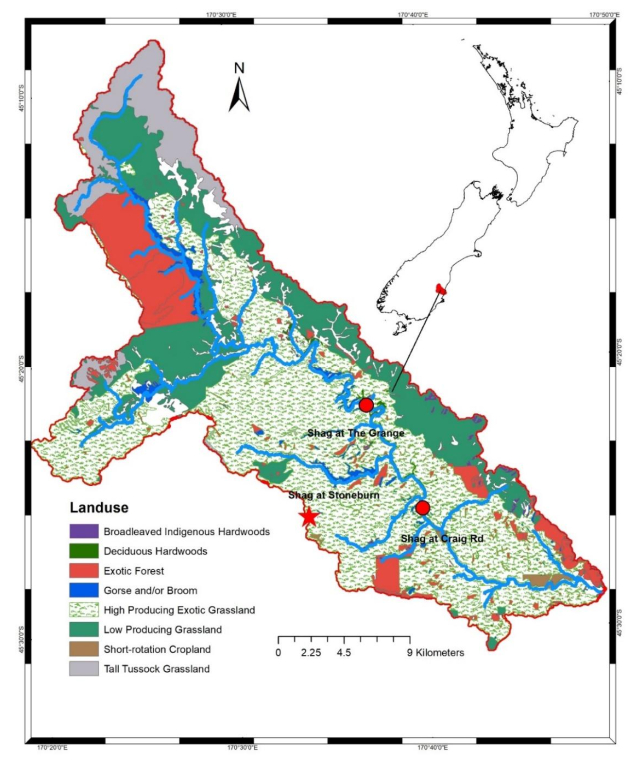
    [22] ORC, Flow at Shag River, 2018. Available from: http://water.orc.govt.nz/WaterInfo/Site.aspx?s=ShagGrange, Accesed on 01 Feb 2018.
  • This article has been cited by:

    1. Juan Quijano-Baron, Rebecca Carlier, Jose F. Rodriguez, Steven G. Sandi, Patricia M. Saco, Li Wen, George Kuczera, And we thought the Millennium Drought was bad: Assessing climate variability and change impacts on an Australian dryland wetland using an ecohydrologic emulator, 2022, 218, 00431354, 118487, 10.1016/j.watres.2022.118487
  • Reader Comments
  • © 2018 the Author(s), licensee AIMS Press. This is an open access article distributed under the terms of the Creative Commons Attribution License (http://creativecommons.org/licenses/by/4.0)
通讯作者: 陈斌, bchen63@163.com
  • 1. 

    沈阳化工大学材料科学与工程学院 沈阳 110142

  1. 本站搜索
  2. 百度学术搜索
  3. 万方数据库搜索
  4. CNKI搜索

Metrics

Article views(3739) PDF downloads(726) Cited by(1)

Article outline

Figures and Tables

Figures(5)  /  Tables(2)

Other Articles By Authors

/

DownLoad:  Full-Size Img  PowerPoint
Return
Return

Catalog