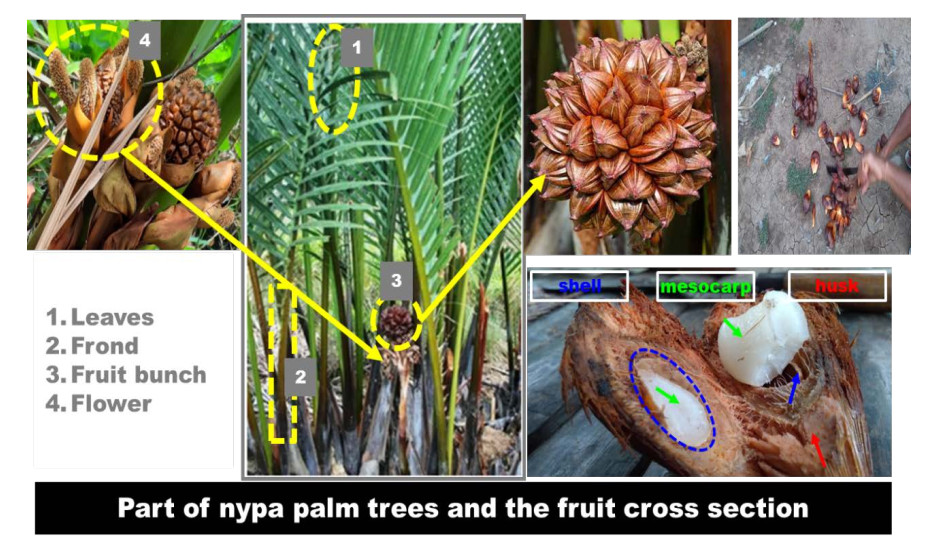
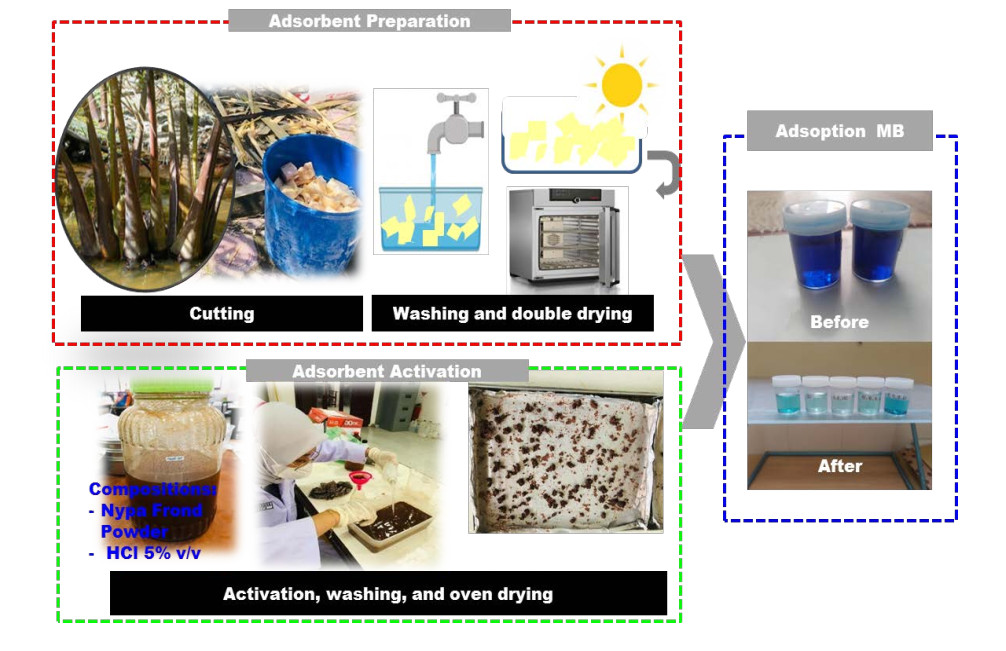
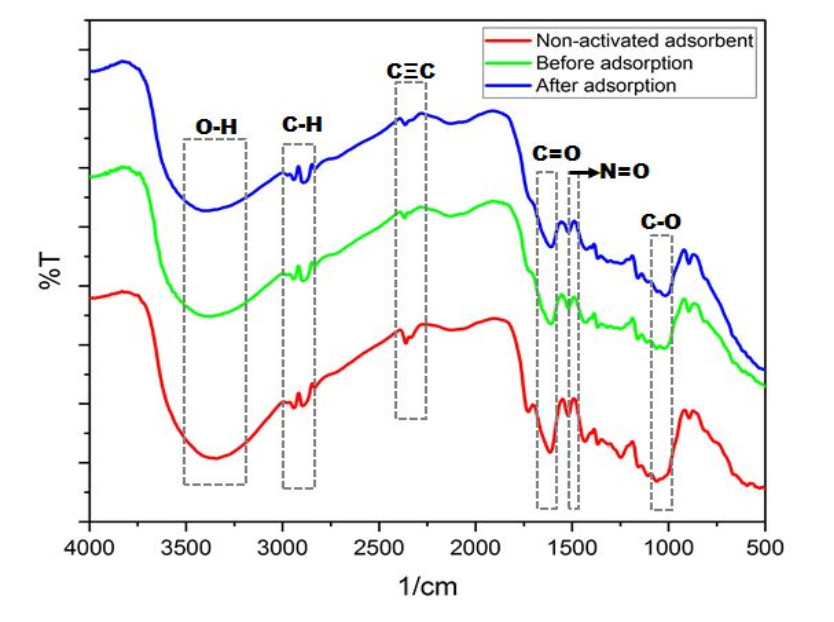
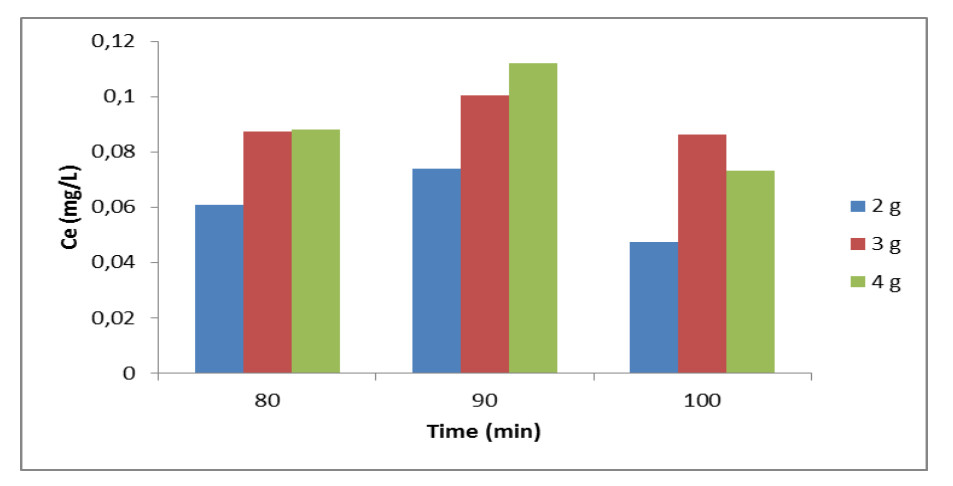
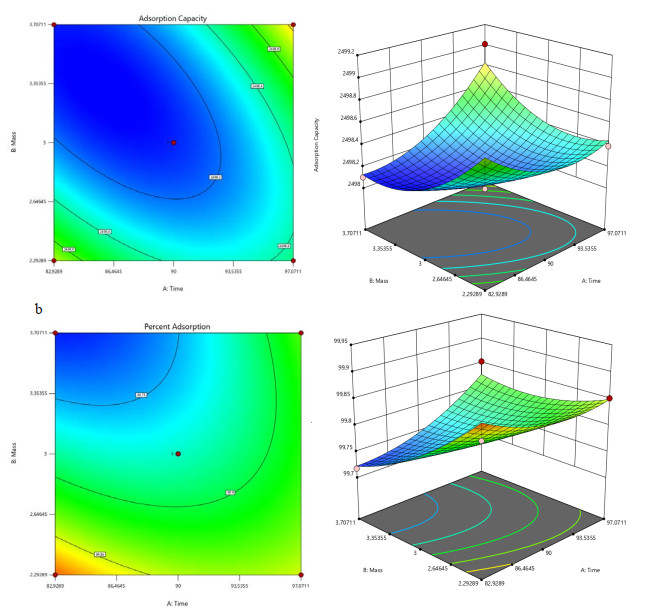
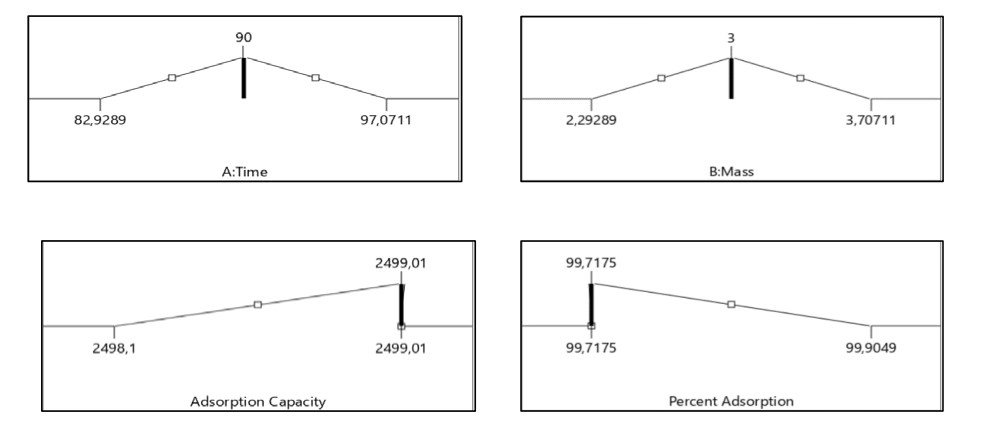
This study primarily focused on optimizing the performance of nipa (Nypafruticans)frond as an adsorbent for methylene blue (MB) dye, using the response surface methodology (RSM). The process of preparing nipafrond includes several key steps, such as washing, drying, and size reduction to 100 mesh. Subsequently, the adsorbent is activated using a 5%v/v HCl activator for 24 hours, and it is characterized by its functional groups using Fourier transform infrared spectroscopy (FT-IR). The composition of both the natural and activated nipa frond is examined through X-ray fluorescence (XRF), while the surface area of the samples is characterized using Brunauer-Emmett-Teller surface srea (BET) analysis. The adsorption characteristics are then tested as a function of two independent factors, including adsorbent mass (2.0, 3.0, and 4.0 g) and contact time (80–100 minutes), with an initial concentration of 50 mg/l MB. The statistical analysis, specifically analysis of variance (ANOVA), shows the substantial influence of these variables on the adsorption process. By applying the RSM model, the optimal conditions for MB adsorption are determined. These optimal conditions include nipa frond powder mass of 3.7071 g and a contact time of 83.1142 minutes, resulting in an optimum adsorption capacity of 2499 mg/g. The corresponding optimum adsorption efficiency is 99.7224%, with a desirability value of 0.974.
Citation: Meriatna, Zulmiardi, Lukman Hakim, Faisal, Suryati, Mizwa Widiarman. Adsorbent performance of nipa (nypafruticans) frond in methylene blue dye degradation: Response surface methodology optimization[J]. AIMS Environmental Science, 2024, 11(1): 38-56. doi: 10.3934/environsci.2024003
This study primarily focused on optimizing the performance of nipa (Nypafruticans)frond as an adsorbent for methylene blue (MB) dye, using the response surface methodology (RSM). The process of preparing nipafrond includes several key steps, such as washing, drying, and size reduction to 100 mesh. Subsequently, the adsorbent is activated using a 5%v/v HCl activator for 24 hours, and it is characterized by its functional groups using Fourier transform infrared spectroscopy (FT-IR). The composition of both the natural and activated nipa frond is examined through X-ray fluorescence (XRF), while the surface area of the samples is characterized using Brunauer-Emmett-Teller surface srea (BET) analysis. The adsorption characteristics are then tested as a function of two independent factors, including adsorbent mass (2.0, 3.0, and 4.0 g) and contact time (80–100 minutes), with an initial concentration of 50 mg/l MB. The statistical analysis, specifically analysis of variance (ANOVA), shows the substantial influence of these variables on the adsorption process. By applying the RSM model, the optimal conditions for MB adsorption are determined. These optimal conditions include nipa frond powder mass of 3.7071 g and a contact time of 83.1142 minutes, resulting in an optimum adsorption capacity of 2499 mg/g. The corresponding optimum adsorption efficiency is 99.7224%, with a desirability value of 0.974.

| [1] |
Zhou S, Z Du, X. Li, et al. (2019) Degradation of methylene blue by natural manganese oxides: Kinetics and transformation products. R Soc Open Sci 6: 1–12. https://doi.org/10.1098/rsos.190351 doi: 10.1098/rsos.190351

|
| [2] |
I E Suprihatin, R M Suat, I M S Negara (2022) Fotodegradasi zat warna methylene blue dengan sinar uv dan fotokatalis nanopartikel perak. J Kim J Chem 16: 168–173. https://doi.org/10.24843/JCHEM.2022.v16.i02.p06. doi: 10.24843/JCHEM.2022.v16.i02.p06
|
| [3] | Haryono M F D, C L N, A Rostika (2018) Pengolahan limbah zat warna tekstil terdispersi dengan metode elektroflotasi. Edu Chemia 3: 94–105. http://dx.doi.org/10.30870/educhemia.v3i1.2625 |
| [4] |
Tehubijuluw H, R Subagyo, M F Yulita, et al. (2021) Utilization of red mud waste into mesoporous ZSM-5 for methylene blue adsorption-desorption studies. Environ. Sci Pollut Res 1–17. https://doi.org/10.1007/s11356-021-13285-y doi: 10.1007/s11356-021-13285-y
|
| [5] | Naimah S, Jati B N, Aidha N N, et al. (2014) Degradasi zat warna pada limbah cair industri tekstil dengan metode fotokatalitik menggunakan nanokomposit TiO2 – zeolit. J Kim Kemasan 36: 225–236 http://dx.doi.org/10.24817/jkk.v36i2.1889 |
| [6] |
Arora C, Soni S, Sahu S, et al. (2019) Iron based metal organic framework for efficient removal of methylene blue dye from industrial waste. J Mol Liq 284: 343–352 https://doi.org/10.1016/j.molliq.2019.04.012 doi: 10.1016/j.molliq.2019.04.012
|
| [7] |
Suhaimy S N M, Abdullah L C (2020) Removal of methylene blue from aqueous solution by using electrical arc furnace (EAF) slag. Indones J Chem 20: 113–119 https://doi.org/10.22146/ijc.40910 doi: 10.22146/ijc.40910
|
| [8] |
Saber M, El Hamdaoui L, El Moussaouiti M, et al. (2022) Extraction and Characterization of Lignin From Moroccan Thuya. Its Application As Adsorbent of Methylene Blue From Aqueous Solution. Cellul Chem Technol 56: 69–81 https://doi.org/10.35812/CelluloseChemTechnol.2022.56.06 doi: 10.35812/CelluloseChemTechnol.2022.56.06
|
| [9] |
Wang Q, Wang Y, Chen L (2019) A green composite hydrogel based on cellulose and clay as efficient absorbent of colored organic effluent. Carbohydr Polym 210: 314–321 https://doi.org/10.1016/j.carbpol.2019.01.080 doi: 10.1016/j.carbpol.2019.01.080
|
| [10] |
Ikhsan A N, Azmiati Y, Delvianti U, et al. (2021) Karakteristik biosorben pelepah nipah (nypa fruticans) untuk penurunan kadar logam berat air merkuri (Hg). Jukung 7: 46–55 http://dx.doi.org/10.20527/jukung.v7i1.10814. doi: 10.20527/jukung.v7i1.10814
|
| [11] | Park D., Y. S. Yun, and J. M. Park. (2010) The past, present, and future trends of biosorption. Biotechnol Bioprocess Eng 15: 86–102 https://doi.org/10.1007/s12257-009-0199-4 |
| [12] |
Fu F. and Q. Wang. (2010) Removal of heavy metal ions from wastewaters : A review. J Environ Manage 92: 407–418 https://doi.org/10.1016/j.jenvman.2010.11.011 doi: 10.1016/j.jenvman.2010.11.011
|
| [13] |
Muhammad, N. Afriani, Meriatna, and R. Mulyawan. (2021) Oyster Shell Waste (Crassostrea Gigas) as A Cheap Adsorbent for Adsorption Of Methylene Blue Dyes : Equilibrium and Kinetics Studies. Int J Eng Sci Infor Techno 1: 95–102 https://doi.org/10.52088/ijesty.v1i4.178 doi: 10.52088/ijesty.v1i4.178
|
| [14] |
Meriatna, S. Utari and R. Mulyawan. (2023) Methyl Orange Absorption Using Chitosan from Shrimp Skin as an Adsorbent. Int J Eng Sci Infor Technol 3: 25–30 https://doi.org/10.52088/ijesty.v3i2.431 doi: 10.52088/ijesty.v3i2.431
|
| [15] |
Meriatna, R. Afriani, L. Maulinda, S. Suryati, and Z. Zulmiardi. (2021) Optimasi adsorpsi ion Pb2+ menggunakan karbon aktif sekam padi pada fixed bed column dengan pendekatan RSM (response surface methodology). J Teknol Kim Unimal 8: 100–110 https://doi.org/10.29103/jtku.v10i1.4182 doi: 10.29103/jtku.v10i1.4182
|
| [16] |
Crini G. (2006) Non-conventional low-cost adsorbents for dye removal: A review. Bioresour Technol 97: 1061–1085 https://doi.org/10.1016/j.biortech.2005.05.001 doi: 10.1016/j.biortech.2005.05.001
|
| [17] |
Rafatullah M., O. Sulaiman, R. Hashim, and A. Ahmad. (2009) Adsorption of methylene blue on low-cost adsorbents : A review. J Hazard Mater 177: 70–80 https://doi.org/10.1016/j.jhazmat.2009.12.047 doi: 10.1016/j.jhazmat.2009.12.047
|
| [18] |
Ahmad A., M. Rafatullah, O. Sulaiman, M. H. Ibrahim, and R. Hashim. (2009) Scavenging behaviour of meranti sawdust in the removal of methylene blue from aqueous solution. J Hazard Mater 170: 357–365 https://doi.org/10.1016/j.jhazmat.2009.04.087 doi: 10.1016/j.jhazmat.2009.04.087
|
| [19] |
Iwuozor K. O., J. O. Ighalo, E. C. Emenike, L. A. Ogunfowora, and C. A. Igwegbe. (2021) Adsorption of methyl orange: A review on adsorbent performance. Curr Res Green Sustain Chem 4: 1–16 https://doi.org/10.1016/j.crgsc.2021.100179 doi: 10.1016/j.crgsc.2021.100179
|
| [20] |
El-sayed G. O. (2011) Removal of methylene blue and crystal violet from aqueous solutions by palm kernel fiber. Desalination 272: 225–232 https://doi.org/10.1016/j.desal.2011.01.025 doi: 10.1016/j.desal.2011.01.025
|
| [21] |
Zhou R. et al. (2016) An efficient bio-adsorbent for the removal of dye: Adsorption studies and cold atmospheric plasma regeneration. J Taiwan Inst Chem Eng 68: 372–378 https://doi.org/10.1016/j.jtice.2016.09.030 doi: 10.1016/j.jtice.2016.09.030
|
| [22] | Jawad A. H., R. A. Rashid, R. M. A. Mahmuod, M. A. M. Ishak, N. N. Kasim, and K. Ismail. (2016) Adsorption of methylene blue onto coconut (Cocos nucifera) leaf: optimization, isotherm and kinetic studies. Desalin Water Treat 57: 8839–8853, https://doi.org/10.1080/19443994.2015.1026282 |
| [23] |
Khan, M. R., Rahman M. W., H. R. Ong, A. B. Ismail, and C. K. Cheng. (2016) Tea dust as a potential low-cost adsorbent for the removal of crystal violet from aqueous solution. Desalin. Water Treat 57: 14728–14738 https://doi.org/10.1080/19443994.2015.1066272 doi: 10.1080/19443994.2015.1066272
|
| [24] |
Alam M. J., B. C. Das, M. W. Rahman, B. K. Biswas, and M. M. R. Khan. (2015) Removal of dark blue-GL from wastewater using water hyacinth: a study of equilibrium adsorption isotherm. Desalin. Water Treat 56: 1520–1525 https://doi.org/10.1080/19443994.2014.950996 doi: 10.1080/19443994.2014.950996
|
| [25] |
Rahman M. W., Nipa S.T., Rima, S.Z., et al. (2022) Pseudo-stem banana fiber as a potential low-cost adsorbent to remove methylene blue from synthetic wastewater. Appl Water Sci 12: 1–16 https://doi.org/10.1007/s13201-022-01769-2 doi: 10.1007/s13201-022-01769-2
|
| [26] |
V. M. Vučurović, R. N. Razmovski, U. D. Miljić, and V. S. Puškaš. (2014) Removal of cationic and anionic azo dyes from aqueous solutions by adsorption on maize stem tissue. J Taiwan Inst Chem Eng 45: 1700–1708 https://doi.org/10.1016/j.jtice.2013.12.020 doi: 10.1016/j.jtice.2013.12.020
|
| [27] |
Guechi E. K. and O. Hamdaoui. (2015) Biosorption of methylene blue from aqueous solution by potato (Solanum tuberosum) peel: equilibrium modelling, kinetic, and thermodynamic studies. Desalin. Water Treat 57: 10270–10285 https://doi.org/10.1080/19443994.2015.1035338 doi: 10.1080/19443994.2015.1035338
|
| [28] |
Ángel Siles López J., Q. Li, and I. P. Thompson. (2010) Biorefinery of waste orange peel. Crit Rev Biotechnol 30: 63–69 https://doi.org/10.3109/07388550903425201 doi: 10.3109/07388550903425201
|
| [29] |
Nipa S. T., Shefa N. R., Parvin S., et al. (2023) Adsorption of methylene blue on papaya bark fiber: Equilibrium, isotherm and kinetic perspectives. Results Eng 17: 1–9 https://doi.org/10.1016/j.rineng.2022.100857 doi: 10.1016/j.rineng.2022.100857
|
| [30] |
Koyuncu H. and A. R. Kul. (2019) Removal of methylene blue dye from aqueous solution by nonliving lichen (Pseudevernia furfuracea (L.) Zopf.), as a novel biosorbent. Appl Water Sci 10: 1–14 https://doi.org/10.1007/s13201-020-1156-9 doi: 10.1007/s13201-020-1156-9
|
| [31] | A. H. Jawad, Y. S. Ngoh, and K. A. Radzun. (2018) Utilization of watermelon (Citrullus lanatus) rinds as a natural low-cost biosorbent for adsorption of methylene blue: kinetic, equilibrium and thermodynamic studies. J Taibah Univ 12: 371–381 https://doi.org/10.1080/16583655.2018.1476206 |
| [32] | Siqueira T. C. A., Silva I Z d., Rubio A. J., et al. (2020) Sugarcane bagasse as an efficient biosorbent for methylene blue removal: Kinetics, isotherms and thermodynamics. Int J Environ Res Public Health 17: 1–10 https://doi.org/10.3390/ijerph17020526 |
| [33] |
Bouyahia C., Rahmani M., Bensemlali M., et al. (2023) Influence of extraction techniques on the adsorption capacity of methylene blue on sawdust: Optimization by full factorial design. Mater Sci Energy Technol 6: 114–123 https://doi.org/10.1016/j.mset.2022.12.004 doi: 10.1016/j.mset.2022.12.004
|
| [34] |
Walters B. B., Rönnbäck P., Kovacs J. M., et al. (2008) Ethnobiology, socio-economics and management of mangrove forests: A review. Aquat Bot 89: 220–236, https://doi.org/10.1016/j.aquabot.2008.02.009 doi: 10.1016/j.aquabot.2008.02.009
|
| [35] |
Tamunaidu P. and S. Saka (2011) Chemical characterization of various parts of nipa palm (Nypa fruticans). Ind Crops Prod 34: 1423–1428 https://doi.org/10.1016/j.indcrop.2011.04.020 doi: 10.1016/j.indcrop.2011.04.020
|
| [36] | Cheablam O. and B. Chanklap. (2020) Sustainable Nipa Palm (Nypa fruticans Wurmb.) Product Utilization in Thailand. Scientifica (Cairo). 2020: 1–10 https://doi.org/10.1155/2020/3856203 |
| [37] |
Evelyn, Sunarno, D. Andrio, A. Aman, and H. Ohi. (2022) Nypa fruticans Frond Waste for Pure Cellulose Utilizing Sulphur-Free and Totally Chlorine-Free Processes. Molecules 27: 1–16 https://doi.org/10.3390/molecules27175662 doi: 10.3390/molecules27175662
|
| [38] |
Meriatna, L. Hakim, M. Masrullita, Z. Zulmiardi, and S. Atika. (2023) Study of adsorption of lead metal (Pb) using chemically acti-vated (nypa fruticans) powder biosorbent. Int J Eng Sci Inf Technol 3: 47–52 https://doi.org/10.52088/ijesty.v3i2.443 doi: 10.52088/ijesty.v3i2.443
|
| [39] | Rumiati S. R., Refilda, E. Munaf, and Aziz Hermansyah. (2015) Biosorption of lead(Ⅱ) and copper(Ⅱ) from aqueous solution by Nypa frutican husk. Chem Pharm Res 7: 175–185 Available online www.jocpr.com |
| [40] |
Mariana, E. M. Mistar, D. Aswita, A. S. Zulkipli, and T. Alfatah. (2022) Nipa palm shell as a sustainable precursor for synthesizing high-performance activated carbon: Characterization and application for Hg2+ adsorption. Bioresour. Technol Reports 21: 1–11 https://doi.org/10.1016/j.biteb.2022.101329 doi: 10.1016/j.biteb.2022.101329
|
| [41] |
Nguyen K. D. (2022) Cellulose Hydrogel Fibre From Nipa Palm (Nypa Fruticans) Shell Used for Adsorption of Methylene Blue From Wastewater. Cellul. Chem Technol 56: 881–890 https://doi.org/10.35812/CelluloseChemTechnol.2022.56.79 doi: 10.35812/CelluloseChemTechnol.2022.56.79
|
| [42] |
Syauqiah I., M. Elma, D. P. Mailani, and N. Pratiwi. (2020) Activated carbon from Nypa (Nypa fruticans) leaves applied for the Fe and Mn removal. IOP Conf Ser Mater Sci Eng 980: 1–8 https://doi.org/10.1088/1757-899X/980/1/012073 doi: 10.1088/1757-899X/980/1/012073
|
| [43] |
Safariyanti S. J., W. Rahmalia, and Shofiyani, A. (2018) Sintesis dan Karakteristik Karbon Aktif Dari Tempurung Buah Nipah (Nypa fruticans) Menggunakan Aktivator Asam Klorida. J Kim Khatulistiwa 7: 41–46 https://doi.org/10.22437/jop.v8i1.20292 doi: 10.22437/jop.v8i1.20292
|
| [44] |
Obose, Ekemini, Osu, I. Charles, and J. Horsfall. (2017) The Removal Of Some Organic Colourants In Aqueous Solutions Using Biomass And Activated Carbon Of Nipa Palm Fruit Fibre. Nat Sci 15: 9–14 https://doi.org/10.7537/marsnsj151117.02 doi: 10.7537/marsnsj151117.02
|
| [45] | Ali M. Y., Rahman M. W., Moniruzzaman M., et al. (2016) Nypa fruticans as a potential low cost adsorbent to uptake heavy metals from industrial wastewater. Int J Appl Bus Econ Res 14: 1359–1371 |
| [46] | Dalming T., H. A. Wardani, and U. A. Annisa. Uji serat buah nipah (nypa fruticans wurmb) sebagai adsorben zat warna rhodamin B. J Pharm Pelamonia 2: 17–26 https://ojs.iikpelamonia.ac.id/index.php/Pharmacy/article/view/324/331 |
| [47] |
Wankasi D., M. Horsfall, and A. I. Spiff. (2005) Desorption of Pb2+ and Cu2+ from Nipa palm (Nypa fruticans Wurmb) biomass. African J Biotechnol 4: 923–927 https://doi.org/10.4314/ajb.v4i9.71230 doi: 10.4314/ajb.v4i9.71230
|
| [48] |
Rahayu N. A. I., N. Sylvia, S. Bahri, M. Meriatna, and A. Muarif. (2022) Adsorpsi Zat Warna Methylene Blue Menggunakan Adsorben Dari Ampas Teh Pada Kolom. Chem Eng J Storage 2: 75–86 https://doi.org/10.29103/cejs.v2i2.7030 doi: 10.29103/cejs.v2i2.7030
|
| [49] |
Moradi S. E. and A. Nasrollahpour. (2017) Competitive adsorption and photodegradation of Methyl orange and Rhodamine B by TiO 2 modified mesoporous carbon photo-catalyst on UV irradiation. Mater Technol 7857: 716–723 https://doi.org/10.1080/10667857.2017.1345837 doi: 10.1080/10667857.2017.1345837
|
| [50] |
Ngapa Y. D., and Y. E. Ika (2020) Optimasi Adsorpsi Kompetitif Pewarna Biru Metilena dan Metil Oranye Menggunakan Adsorben Zeolit Alam Ende - Nusa Tenggara Timur (NTT). Indo J Chem Res 8: 151–159 https://doi.org/10.30598//ijcr.2020.8-ydn doi: 10.30598//ijcr.2020.8-ydn
|
| [51] | Syauqiah I., M. Amalia, and H. A. Kartini. (2011) Analisis Variasi Waktu dan Kecepatan Pengadukan Pada Proses Adsorpsi. Info Tek 12: 11–20 https://media.neliti.com/media/publications/70401-ID-analisis-variasi-waktu-dan-kecepatan-pen.pdf |
| [52] |
Eddy N. O., R. A. Ukpe, P. Ameh, R. Ogbodo, R. Garg, and R. Garg. (2023) Theoretical and experimental studies on photocatalytic removal of methylene blue (MetB) from aqueous solution using oyster shell synthesized CaO nanoparticles (CaONP-O). Environ Sci Pollut Res 30: 81417–81432 https://doi.org/10.1007/s11356-022-22747-w doi: 10.1007/s11356-022-22747-w
|
| [53] | R. A. Ramadhani, D. Herdian, S. Riyadi, and B. Triwibowo. (2017) Review Pemanfaatan Design Expert untuk Optimasi Komposisi Campuran Minyak Nabati sebagai Bahan Baku Sintesis Biodiesel. J Tek Kim dan Lingkung 1: 11–16 https://media.neliti.com/media/publications/195296-ID-review-pemanfaatan-design-expert-untuk-o.pdf |
Figures(7) / Tables(11)

Meriatna, Zulmiardi, Lukman Hakim, Faisal, Suryati, Mizwa Widiarman. Adsorbent performance of nipa (nypafruticans) frond in methylene blue dye degradation: Response surface methodology optimization[J]. AIMS Environmental Science, 2024, 11(1): 38-56. doi: 10.3934/environsci.2024003


 DownLoad: