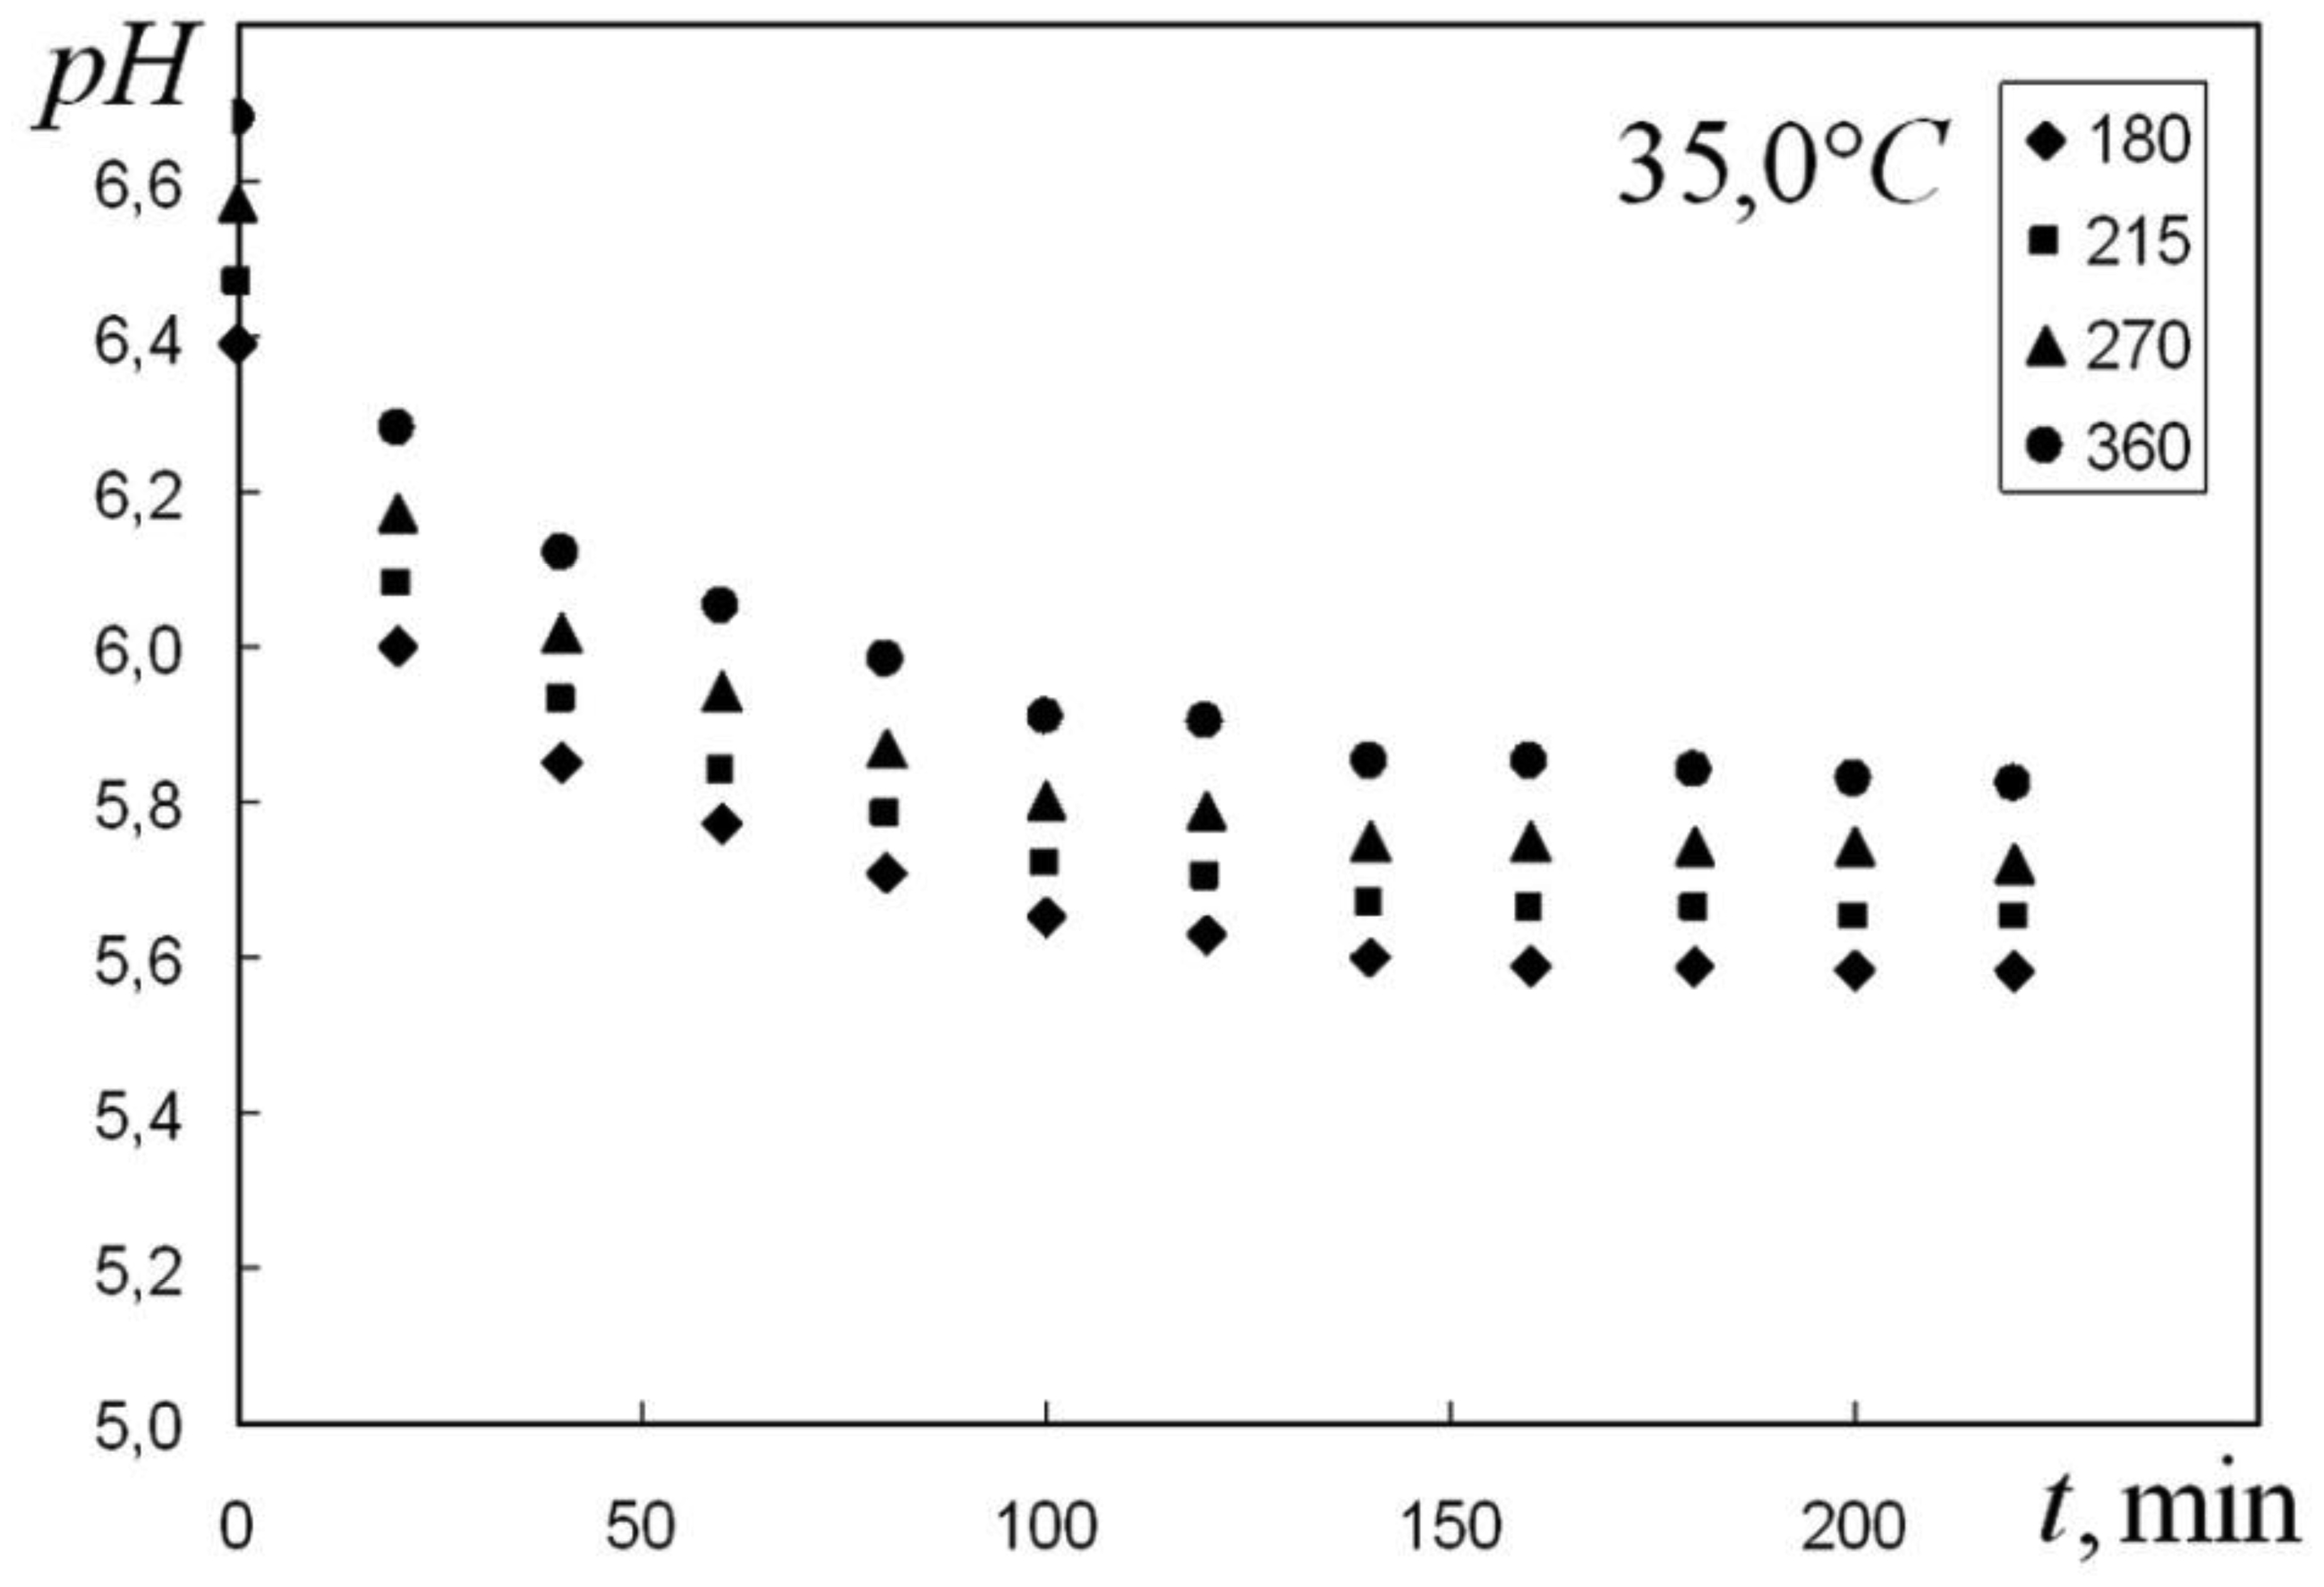
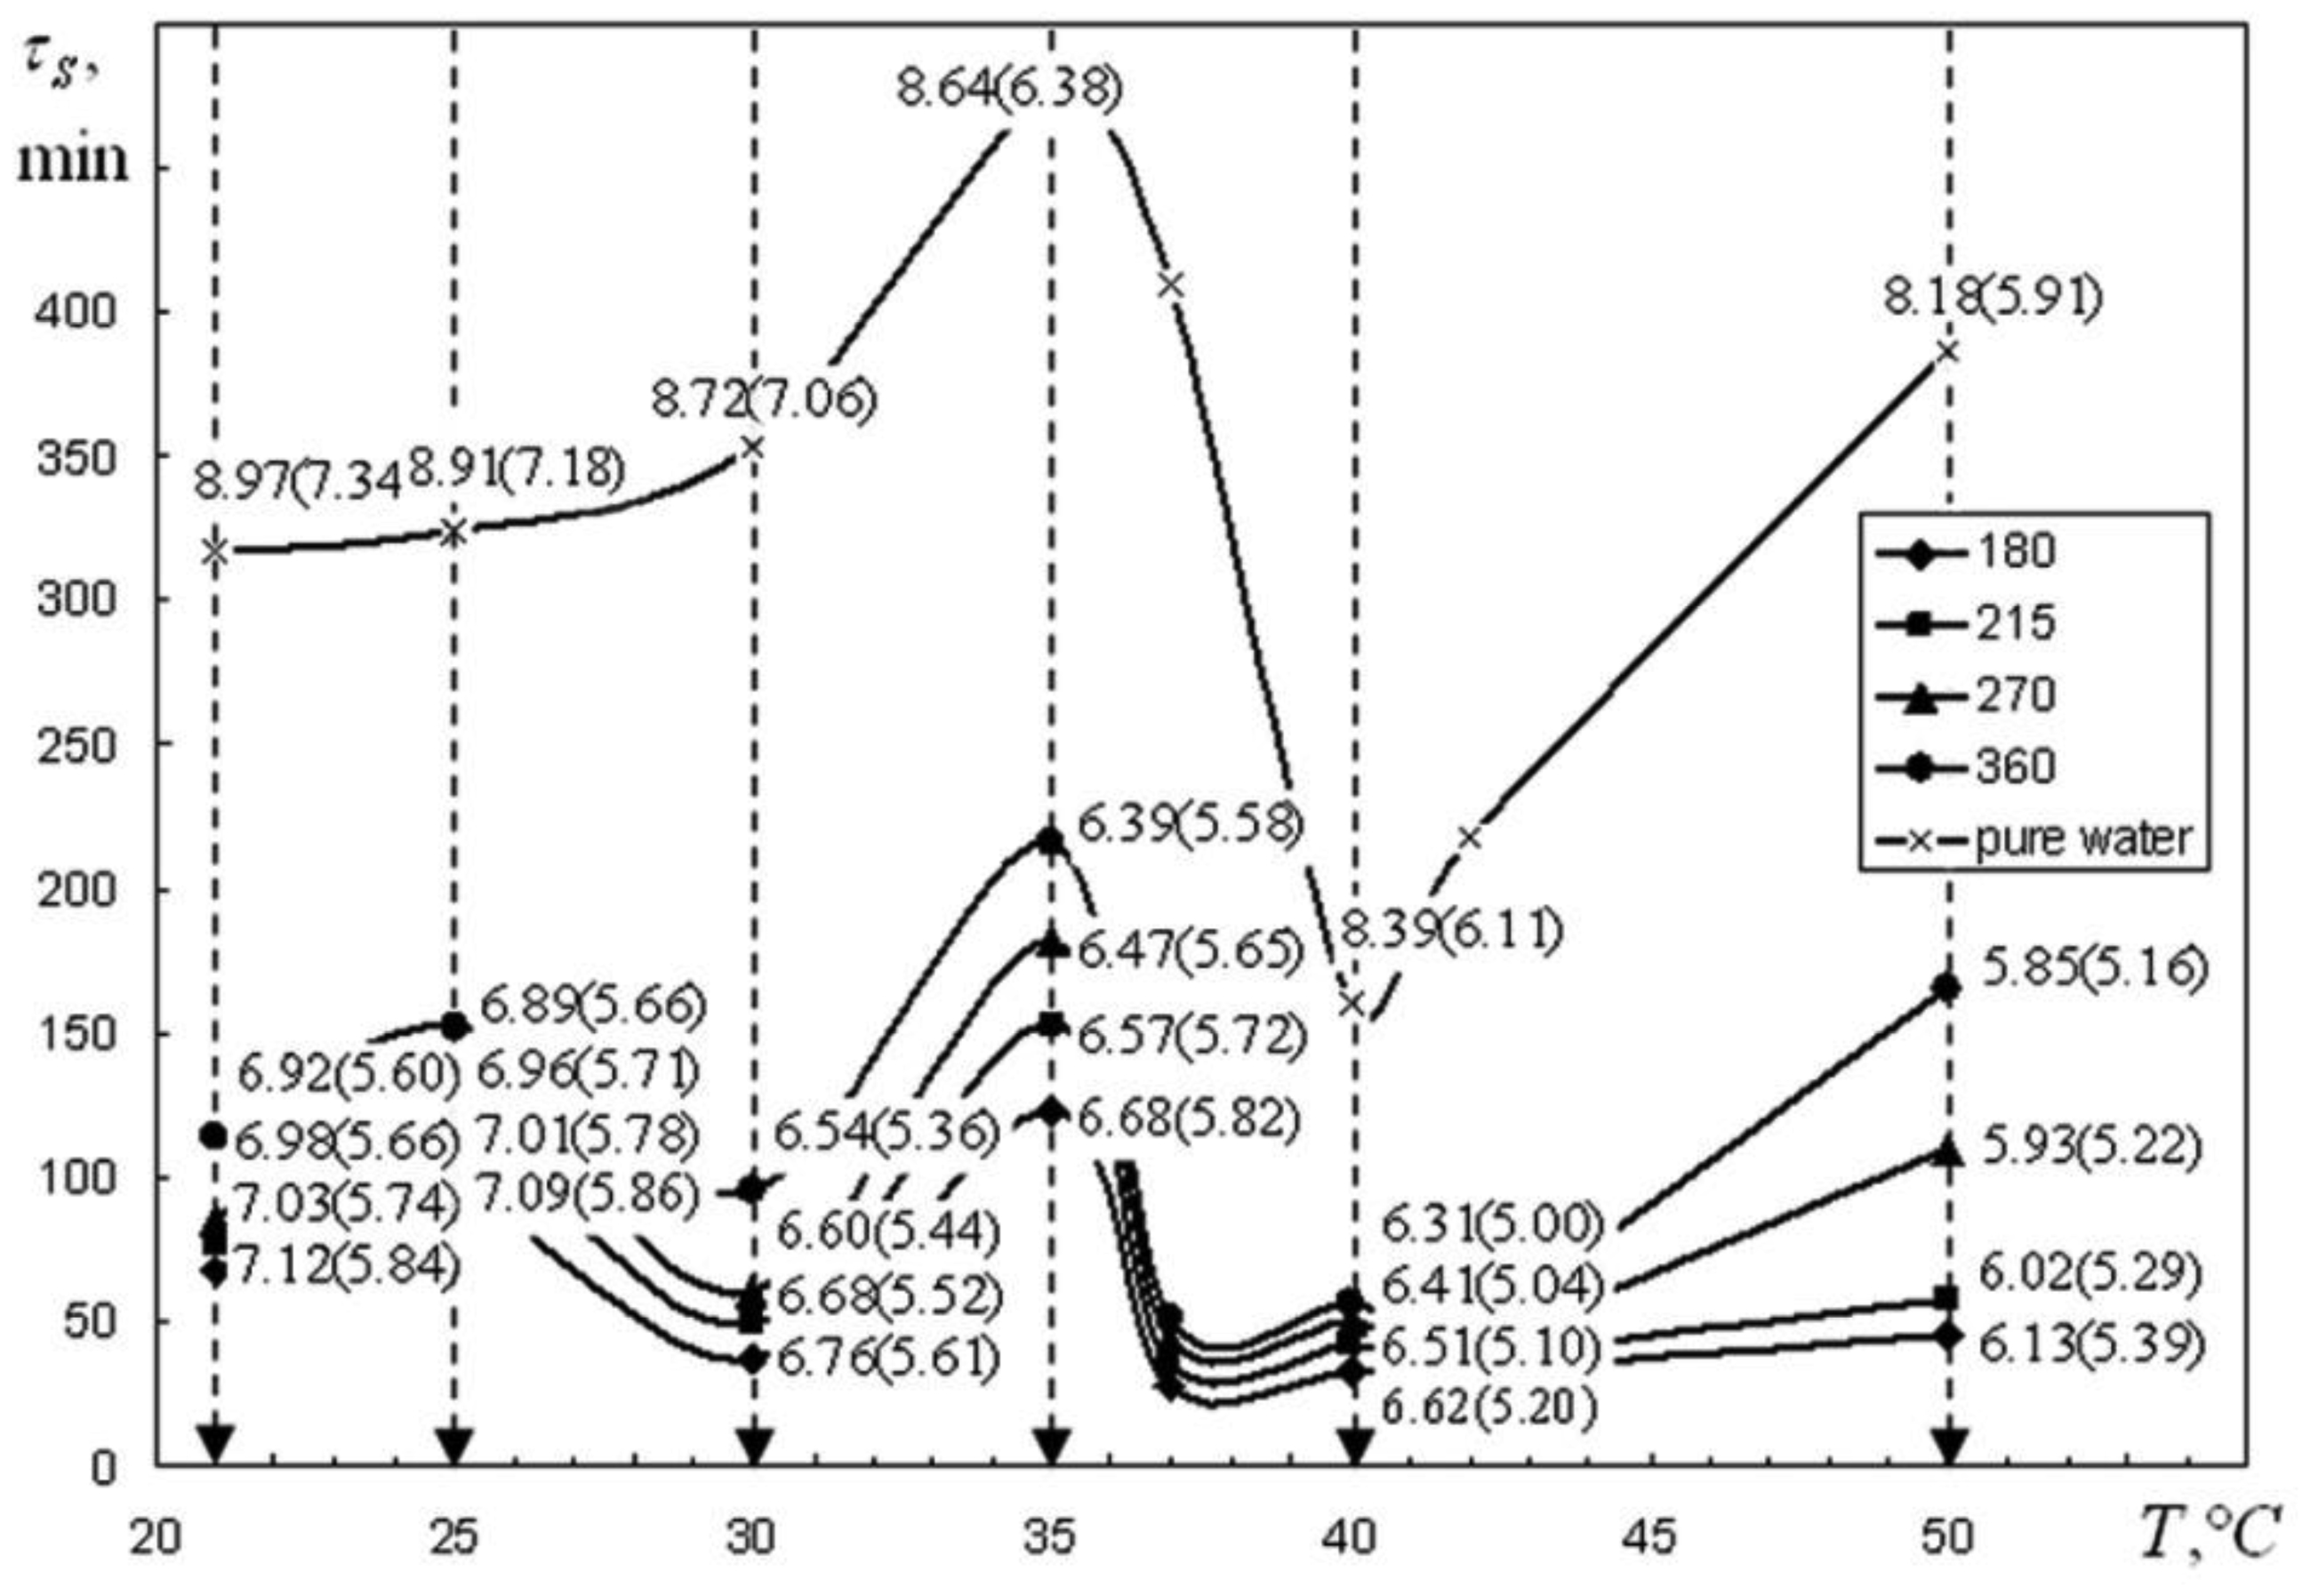
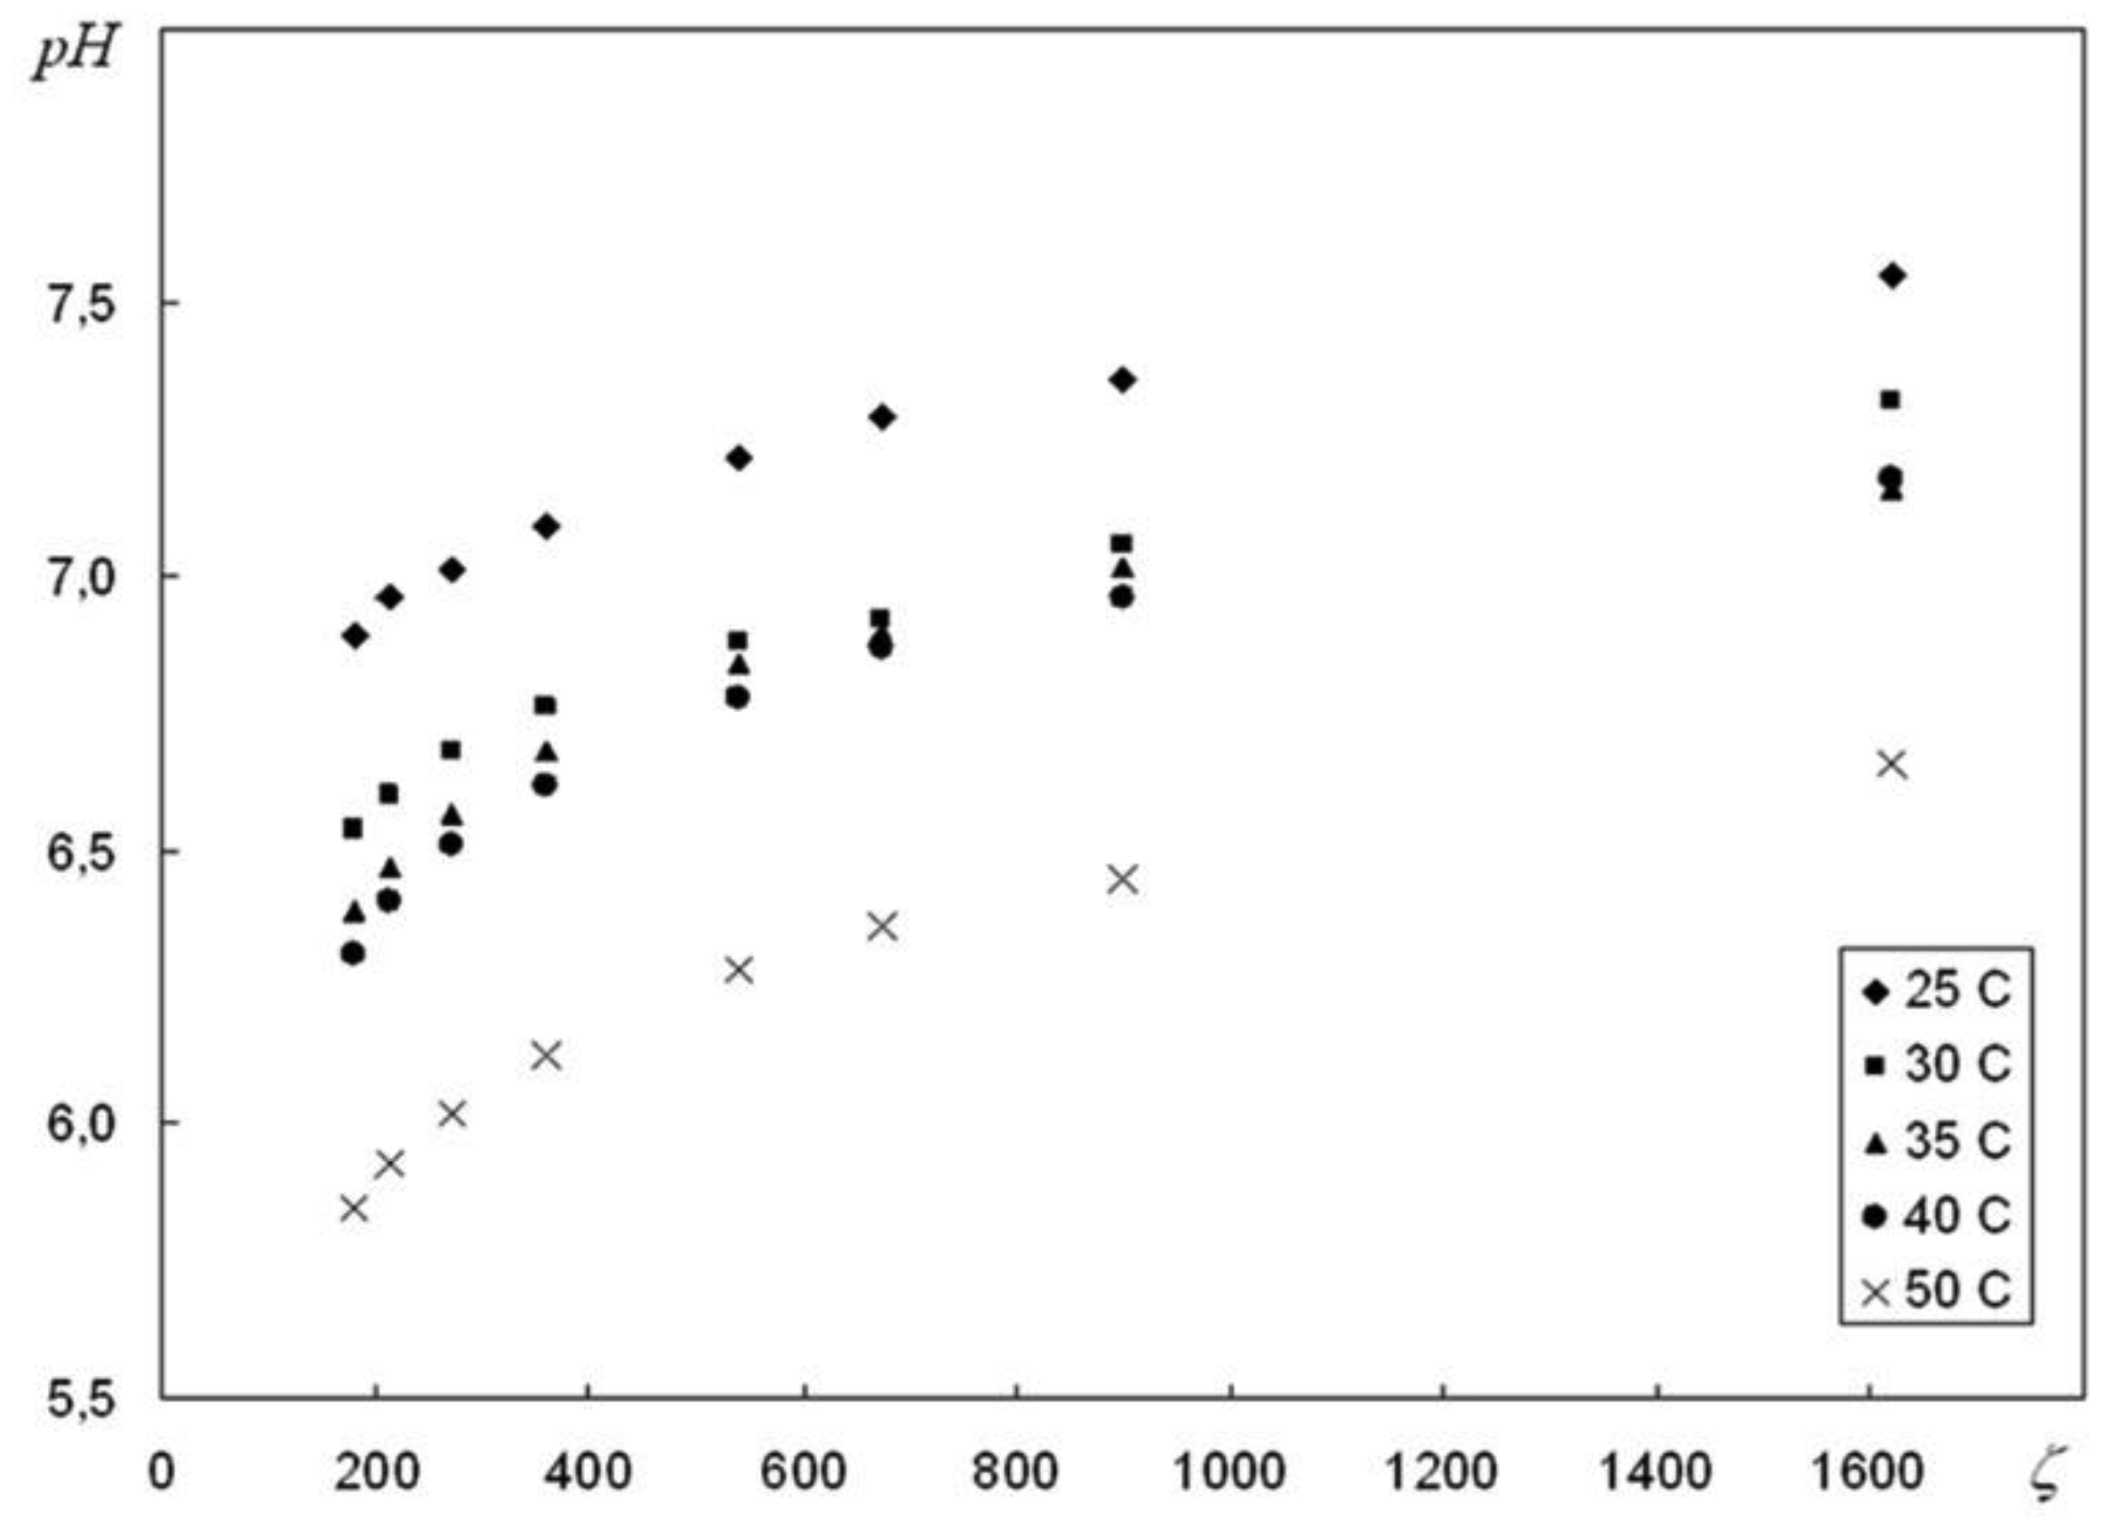
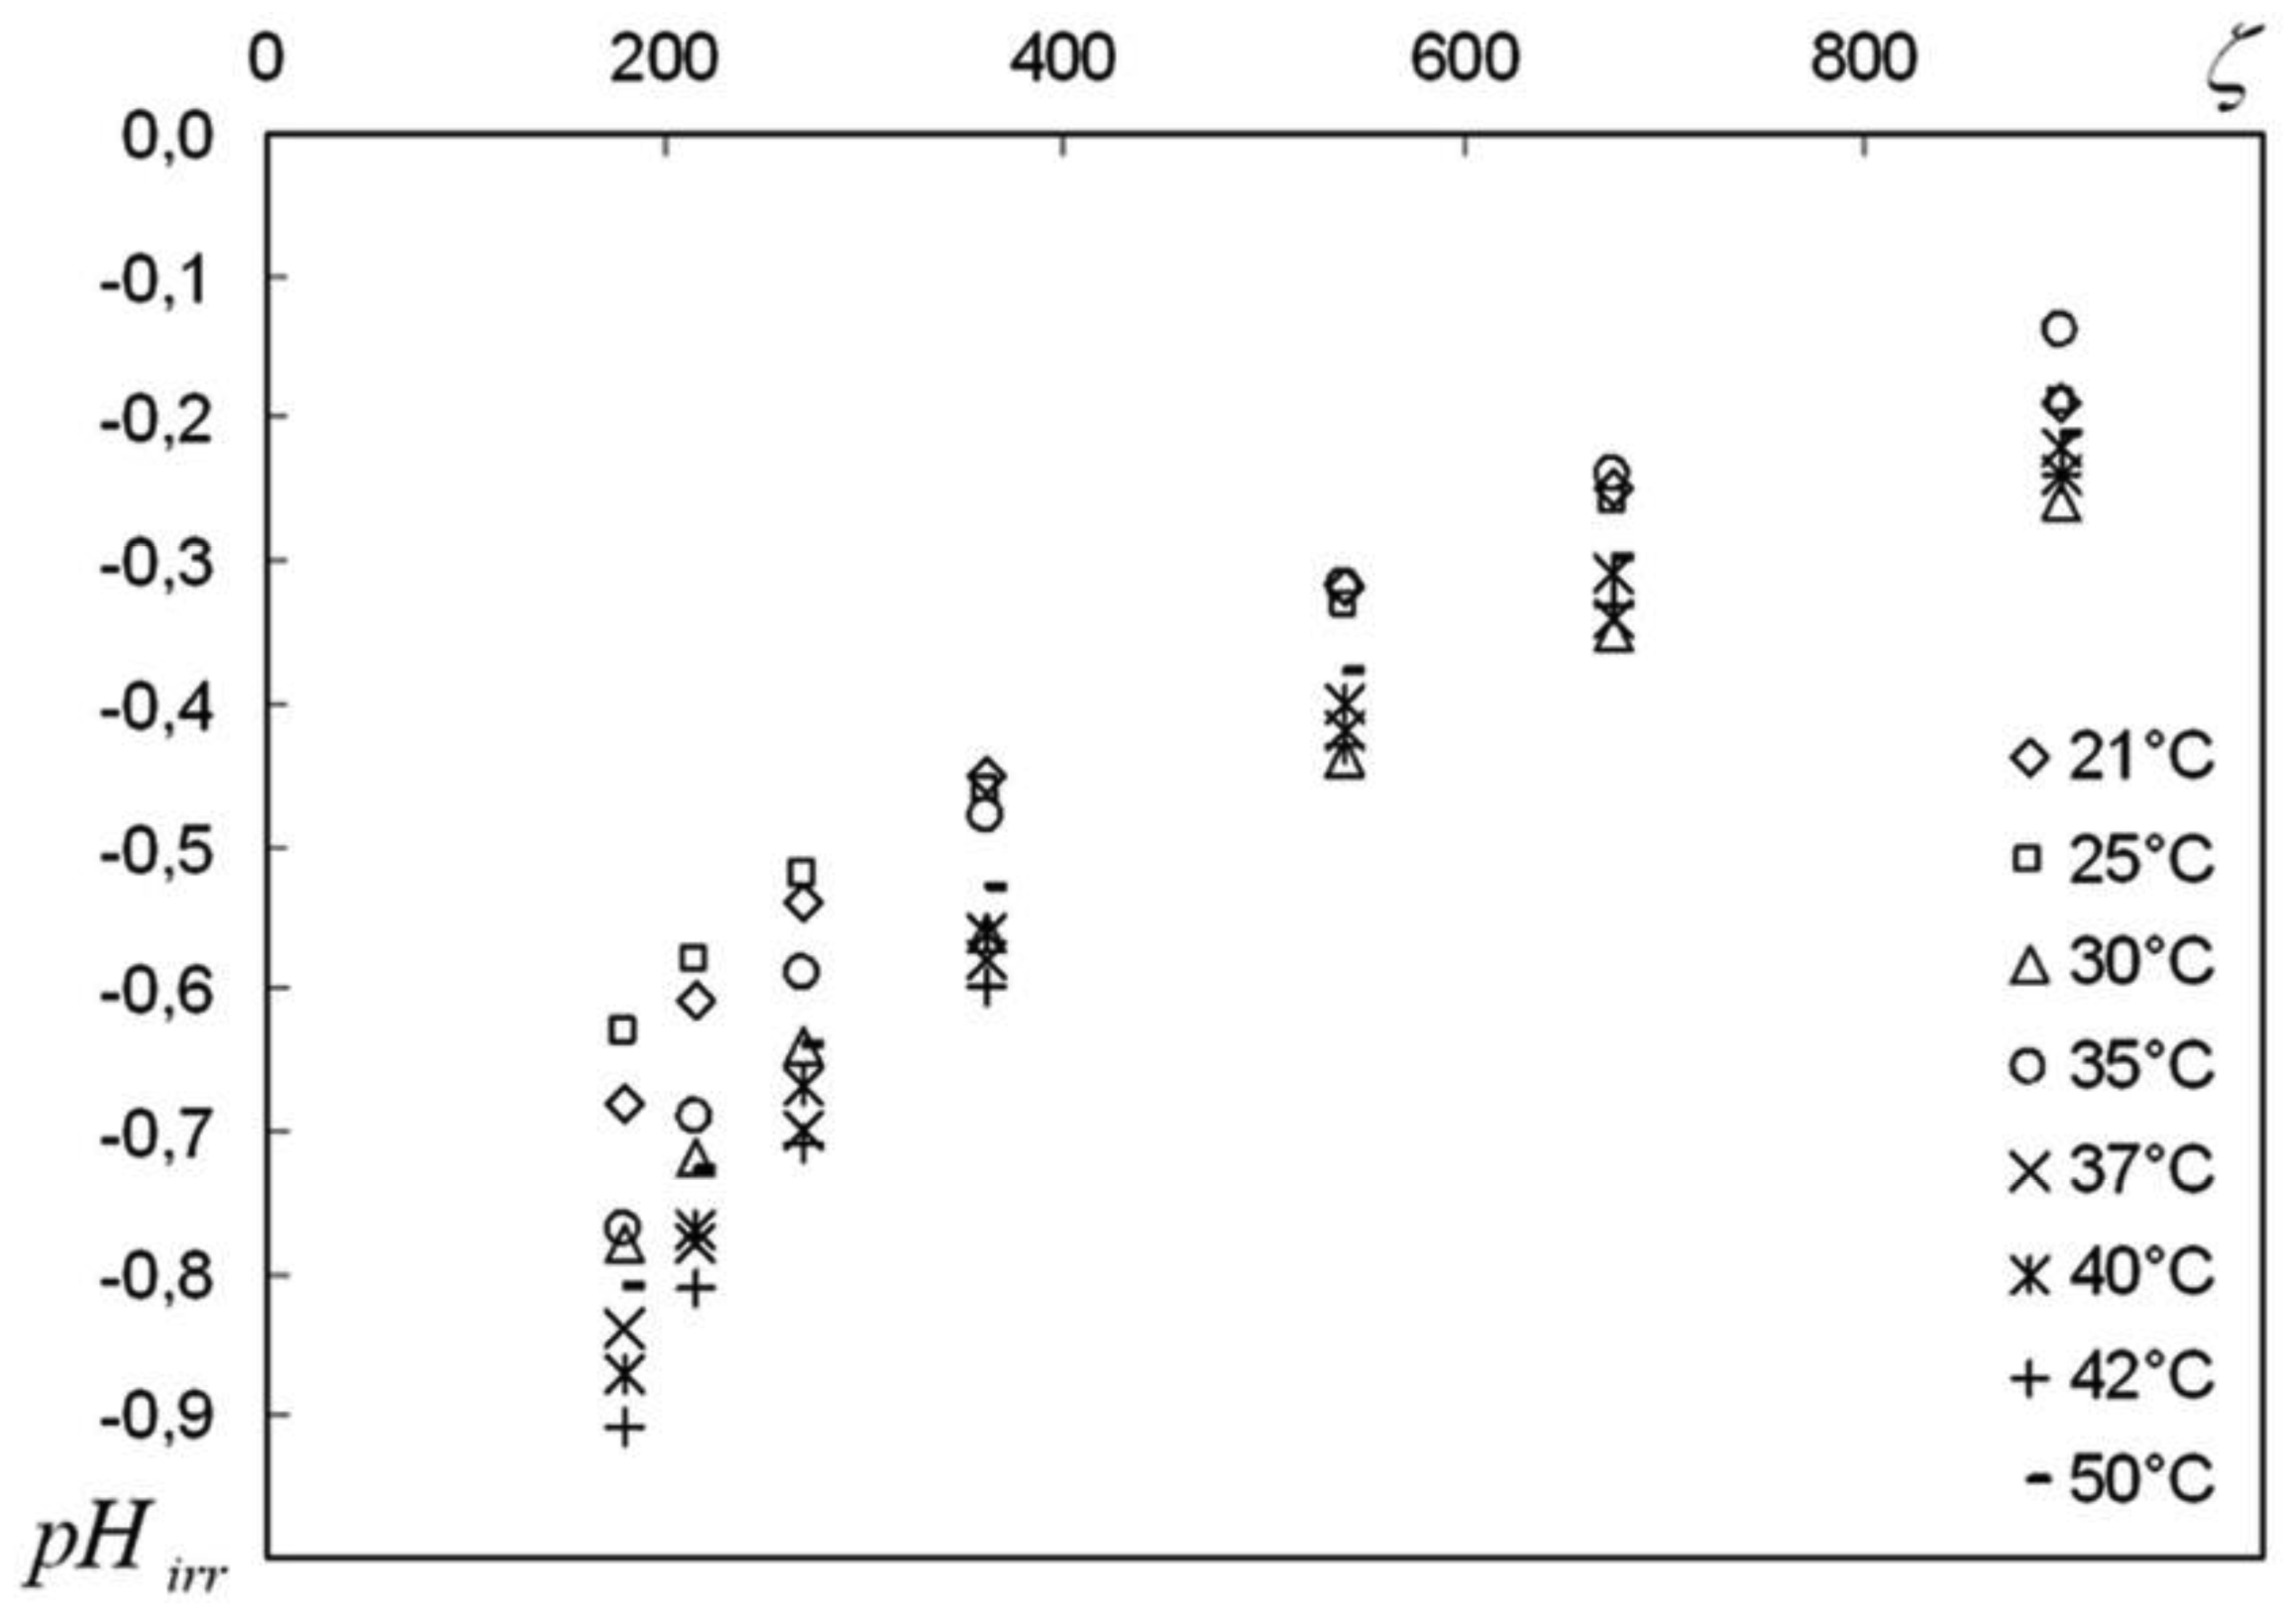
We are devoted to the physical analysis of the habitat area of warm-blooded organisms – humans and many mammals. For this purpose, the establishment of equilibrium distribution of carbon dioxide in aqueous solutions of salts in contact with atmospheric air starting from some time is investigated. More precisely, the relaxation time of carbon dioxide, as a function of temperature and pH, is investigated. It is found that the pH-relaxation time τS is a very nontrivial function of temperature, pH values, and NaCl salt concentration. It was assumed that the minimum value of pH relaxation time corresponds to the optimal rate of physical processes in living matter. Using this selection principle and our experimental data, we have shown that the optimal temperature for human and mammalian life activity is close to To ≈ 37 °C. The lower and upper temperature limits for their possible activity are close to Tl ≈ 30 °C and Tu ≈ 42 °C, respectively. The optimal value of pHo, determined by the same selection principle, also becomes true if supplemented by the influence of albumin and other proteins.
Citation: Anatoliy I. Fisenko, Oleksii V. Khorolskyi, Nikolay P. Malomuzh, Artur A. Guslisty. Relationship between the major parameters of warm-blooded organisms' life activity and the properties of aqueous salt solutions[J]. AIMS Biophysics, 2023, 10(3): 372-384. doi: 10.3934/biophy.2023022
We are devoted to the physical analysis of the habitat area of warm-blooded organisms – humans and many mammals. For this purpose, the establishment of equilibrium distribution of carbon dioxide in aqueous solutions of salts in contact with atmospheric air starting from some time is investigated. More precisely, the relaxation time of carbon dioxide, as a function of temperature and pH, is investigated. It is found that the pH-relaxation time τS is a very nontrivial function of temperature, pH values, and NaCl salt concentration. It was assumed that the minimum value of pH relaxation time corresponds to the optimal rate of physical processes in living matter. Using this selection principle and our experimental data, we have shown that the optimal temperature for human and mammalian life activity is close to To ≈ 37 °C. The lower and upper temperature limits for their possible activity are close to Tl ≈ 30 °C and Tu ≈ 42 °C, respectively. The optimal value of pHo, determined by the same selection principle, also becomes true if supplemented by the influence of albumin and other proteins.

| [1] | Falkowski PG, Knoll AH (2007) Evolution of Primary Producers in the Sea. New York: Academic Press. |
| [2] | Ivanov KP (2006) The development of the concepts of homeothermy and thermoregulation. J Therm Biol 31: 24-29. https://doi.org/10.1016/j.jtherbio.2005.12.005 |
| [3] | Silva JE (2006) Thermogenic mechanisms and their hormonal regulation. Physiol Rev 86: 435-464. https://doi.org/10.1152/physrev.00009.2005 |
| [4] | Clarke A, Pörtner HO (2010) Temperature, metabolic power and the evolution of endothermy. Biol Rev Camb Philos Soc 85: 703-727. https://doi.org/10.1111/j.1469-185X.2010.00122.x |
| [5] | He X, Aizenberg M, Kuksenok O, et al. (2012) Synthetic homeostatic materials with chemo-mechano-chemical self-regulation. Nature 487: 214-218. https://doi.org/10.1038/nature11223 |
| [6] | Goldbeter A (2021) Biochemical Oscillations and Cellular Rhythms: the Molecular Bases of Periodic and Chaotic Behaviour. Cambridge: Cambridge University Press. |
| [7] | Liu M, Yuan L, Zhu C, et al. (2022) Peptide-modulated pH rhythms. Chem Phys Chem 23: e202200103. https://doi.org/10.1002/cphc.202200103 |
| [8] | Cao Y, Wang M, Yuan Y, et al. (2019) Arterial blood gas and acid-base balance in patients with pregnancy-induced hypertension syndrome. Exp Ther Med 17: 349-353. https://doi.org/10.3892/etm.2018.6893 |
| [9] | Rajkumar P, Pluznick JL (2018) Acid-base regulation in the renal proximal tubules: using novel pH sensors to maintain homeostasis. Am J Physiol Renal Physiol 315: F1187-F1190. https://doi.org/10.1152/ajprenal.00185.2018 |
| [10] | Rand PW, Austin WH, Lacombe E, et al. (1968) pH and blood viscosity. J Appl Physiol 25: 550-559. https://doi.org/10.1152/jappl.1968.25.5.550 |
| [11] | Bulavin LA, Fisenko AI, Malomuzh NP (2008) Surprising properties of the kinematic shear viscosity of water. Chem Phys Lett 453: 183-187. https://doi.org/10.1016/j.cplett.2008.01.028 |
| [12] | Bulavin LA, Fisenko AI, Malomuzh NP (2013) What water properties are responsible for the physiological temperature interval limits of warm-blooded organisms?. arXiv : 1307.7295. [physics.chem-ph]. https://doi.org/10.48550/arXiv.1307.7295 |
| [13] | Fisenko AI, Malomuzh NP (2008) Role of the H-bond network in the creation of life-giving properties of water. Chem Phys 345: 164-172. https://doi.org/10.1016/j.chemphys.2007.08.013 |
| [14] | Fisenko AI, Malomuzh NP (2009) To what extent is water responsible for the maintenance of the life for warm-blooded organisms?. Int J Mol Sci 10: 2383-2411. https://doi.org/10.3390/ijms10052383 |
| [15] | Stoliaryk OD, Khorolskyi OV (2022) Influence of atmospheric carbon dioxide on the acid-base balance in aqueous sodium chloride solutions. Ukr J Phys 67: 515-526. https://doi.org/10.15407/ujpe67.7.515 |
| [16] | ISO 3696Laboratory Water for Analytical Purpose – Specification and Test Methods (1987). |
| [17] | Bates RG (1964) Determination of pH: Theory and Practice. John Wiley and Sons. |
| [18] | Buck RP, Rondinini S, Covington AK, et al. (2002) Measurement of pH. Definition, standards, and procedures (IUPAC Recommendations 2002). Pure Appl Chem 74: 2169-2200. https://doi.org/10.1351/pac200274112169 |
| [19] | Leito I, Strauss L, Koort E, et al. (2002) Estimation of uncertainty in routine pH measurement. Accredit Qual Assur 7: 242-249. https://doi.org/10.1007/s00769-002-0470-2 |
| [20] | Meinrath G, Spitzer P (2000) Uncertainties in determination of pH. Mikrochim Acta 135: 155-168. https://doi.org/10.1007/s006040070005 |
| [21] | Kadis R, Leito I (2010) Evaluation of the residual liquid junction potential contribution to the uncertainty in pH measurement: A case study on low ionic strength natural waters. Anal Chim Acta 664: 129-135. https://doi.org/10.1016/j.aca.2010.02.007 |
| [22] | Souza V, Ordine AP, Fraga ICS, et al. (2006) Effect of NaCl and HCl concentrations on primary pH measurement for the certification of standard materials. Braz Arch Biol Technol 49: 79-85. https://doi.org/10.1590/S1516-89132006000200013 |
| [23] | Nora C, Mabic S, Darbouret D (2002) A theoretical approach to measuring pH and conductivity in high-purity water. Ultrapure Water 19: 56-61. |
| [24] | Melnik LA, Krysenko DA (2019) Ultrapure water: properties, production, and use. J Water Chem Technol 41: 143-150. https://doi.org/10.3103/S1063455X19030020 |
| [25] | Hinds G, Cooling P, Wain A, et al. (2009) Technical note: Measurement of pH in concentrated brines. Corrosion 65: 635-638. https://doi.org/10.5006/1.3319089 |
| [26] | Crolet JL, Bonis MR (1983) pH measurements in aqueous CO2 solutions under high pressure and temperature. Corrosion 39: 39-46. https://doi.org/10.5006/1.3580813 |
| [27] | Li X, Peng C, Crawshaw JP, et al. (2018) The pH of CO2-saturated aqueous NaCl and NaHCO3 solutions at temperatures between 308 K and 373 K at pressures up to 15 MPa. Fluid Phase Equilibr 458: 253-263. https://doi.org/10.1016/j.fluid.2017.11.023 |
| [28] | Story DA, Thistlethwaite P, Bellomo R (2000) The effect of PVC packaging on the acidity of 0.9% saline. Anaesth Intens Care 28: 287-292. https://doi.org/10.1177/0310057x0002800306 |
| [29] | Reddi BA (2013) Why is saline so acidic (and does it really matter?). Int J Med Sci 10: 747-750. https://doi.org/10.7150/ijms.5868 |
| [30] | Bulavin LA, Malomuzh NP, Khorolskyi OV (2022) Temperature and concentration dependences of pH in aqueous NaCl solutions with dissolved atmospheric CO2. Ukr J Phys 67: 833-840. https://doi.org/10.15407/ujpe67.7.833 |
| [31] | Guslisty AA, Malomuzh NP, Fisenko AI (2018) Optimal temperature for human life activity. Ukr J Phys 63: 809-815. https://doi.org/10.15407/ujpe63.9.809 |
| [32] | Randall D, Burggren W, French K, et al. (1997) Eckert animal physiology: Mechanisms and Adaptation. Freeman WH & Co. |
| [33] | Grigg GC, Beard LA, Augee ML (2004) The evolution of endothermy and its diversity in mammals and birds. Physiol Biochem Zool 77: 982-997. https://doi.org/10.1086/425188 |
| [34] | Bulavin LA, Malomuzh NP, Pankratov KN (2006) Self-diffusion in water. J Struct Chem 4: S50-S60. https://doi.org/10.1007/s10947-006-0377-6 |
| [35] | Bulavin LA, Lokotosh TV, Malomuzh NP (2008) Role of the collective self-diffusion in water and other liquids. J Mol Liq 137: 1-24. https://doi.org/10.1016/j.molliq.2007.05.003 |
| [36] | Lokotosh TV, Malomuzh NP, Pankratov KN (2010) Thermal motion in water+ electrolyte solutions according to quasi-elastic incoherent neutron scattering data. J Chem Eng Data 55: 2021-2029. https://doi.org/10.1021/je9009706 |
| [37] | Bulavin LA, Malomuzh NP (2006) Upper temperature limit for the existence of living matter. J Mol Liq 124: 136. https://doi.org/10.1016/j.molliq.2005.11.027 |
| [38] | Bulavin LA, Gotsulskyi VY, Malomuzh NP, et al. (2020) Crucial role of water in the formation of basic properties of living matter. Ukr J Phys 65: 794-801. https://doi.org/10.15407/ujpe65.9.794 |
| [39] | Okada K, Yao M, Hiejima Y, et al. (1999) Dielectric relaxation of water and heavy water in the whole fluid phase. J Chem Phys 110: 3026-3036. https://doi.org/10.1063/1.477897 |
| [40] | Malomuzh NP, Makhlaichuk VN, Makhlaichuk PV, et al. (2013) Cluster structure of water in accordance with the data on dielectric permittivity and heat capacity. J Struct Chem 54: 205-220. https://doi.org/10.1134/S0022476613080039 |
| [41] | Silverthorn DU (2018) Human Physiology: An Integrated Approach. Pearson. |
| [42] | Hall JE, Hall ME (2020) Guyton and Hall Textbook of Medical Physiology. Elsevier. |
| [43] | Bardic VYu, Fisenko AI, Magazù S, et al. (2020) The crucial role of water in the formation of the physiological temperature range for warm-blooded organisms. J Mol Liq 306: 112818. https://doi.org/10.1016/j.molliq.2020.112818 |
Figures(8)

Anatoliy I. Fisenko, Oleksii V. Khorolskyi, Nikolay P. Malomuzh, Artur A. Guslisty. Relationship between the major parameters of warm-blooded organisms' life activity and the properties of aqueous salt solutions[J]. AIMS Biophysics, 2023, 10(3): 372-384. doi: 10.3934/biophy.2023022


 DownLoad: