The objective of this work was to investigate the growth specificities of cancer cells spheroids subjected to pulsed electric field. Multicellular HCT-116-GFP spheroids were exposed to different electric field intensities and the volume of multicellular spheroids was monitored by fluorescence and bright field microscopy. Thanks to an advanced mathematical model, based on differential equations and well-adapted estimation strategies, our modeling enables us to characterize the multicellular spheroids growth after permeabilizing pulsed electric field. In particular, we identify the percentage of cells which are destroyed and the percentage of cells which exhibit an altered growth pattern for different magnitudes of the electric field. We also quantify the growth resumption upon reversible and partially irreversible electroporation. Our preliminary results provide a first quantification of the impact of electroporation on multicellular spheroids growth, and suggest a booming growth of partially irreversible electric pulses, leading to an accelerated regrowth.
Citation: Annabelle Collin, Hadrien Bruhier, Jelena Kolosnjaj, Muriel Golzio, Marie-Pierre Rols, Clair Poignard. Spatial mechanistic modeling for prediction of 3D multicellular spheroids behavior upon exposure to high intensity pulsed electric fields[J]. AIMS Bioengineering, 2022, 9(2): 102-122. doi: 10.3934/bioeng.2022009
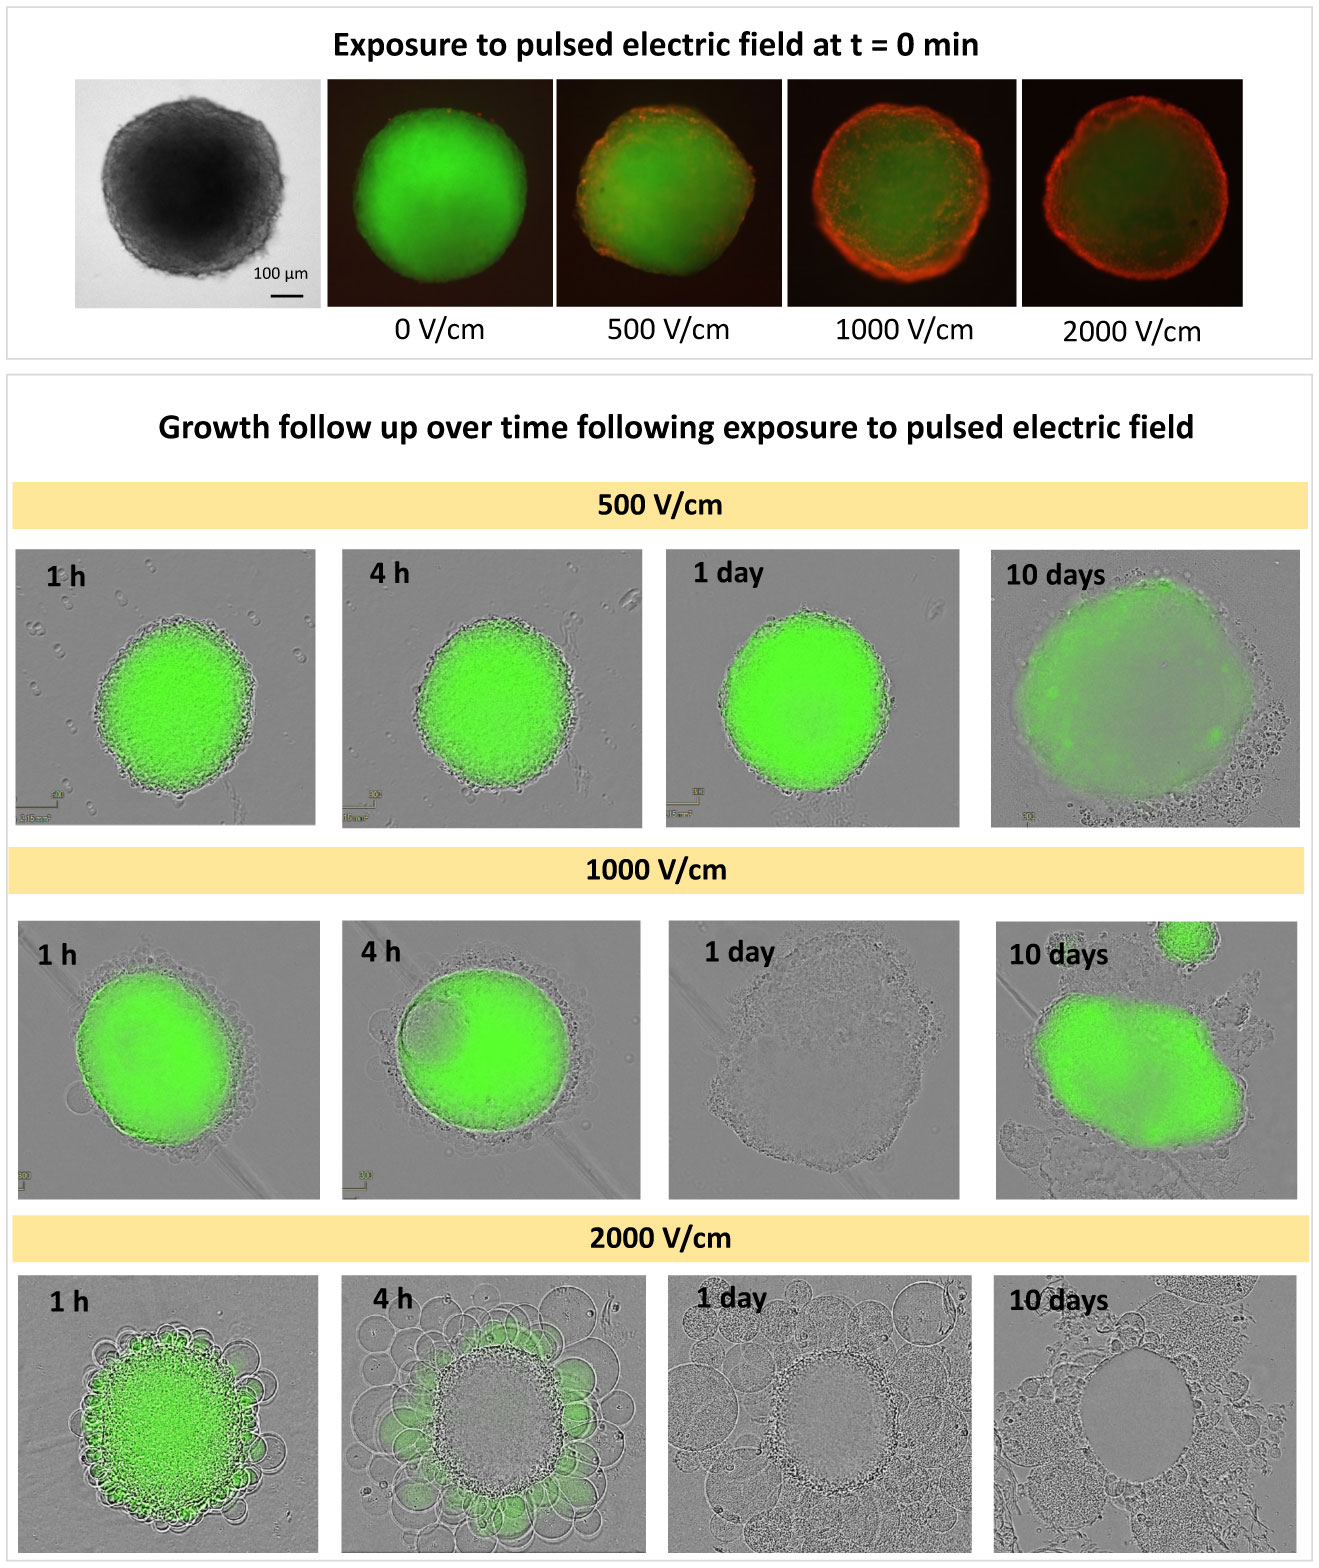
The objective of this work was to investigate the growth specificities of cancer cells spheroids subjected to pulsed electric field. Multicellular HCT-116-GFP spheroids were exposed to different electric field intensities and the volume of multicellular spheroids was monitored by fluorescence and bright field microscopy. Thanks to an advanced mathematical model, based on differential equations and well-adapted estimation strategies, our modeling enables us to characterize the multicellular spheroids growth after permeabilizing pulsed electric field. In particular, we identify the percentage of cells which are destroyed and the percentage of cells which exhibit an altered growth pattern for different magnitudes of the electric field. We also quantify the growth resumption upon reversible and partially irreversible electroporation. Our preliminary results provide a first quantification of the impact of electroporation on multicellular spheroids growth, and suggest a booming growth of partially irreversible electric pulses, leading to an accelerated regrowth.

| [1] | Lixoft SAS (2019) Monolix version 2019R1. France: . |
| [2] |
Benzekry S, Lamont C, Beheshti A, et al. (2014) classical mathematical models for description and prediction of experimental tumor growth. PLoS Comput Biol 10: e1003800. https://doi.org/10.1371/journal.pcbi.1003800 
|
| [3] |
Cannon R, Ellis S, Hayes D, et al. (2013) Safety and early efficacy of irreversible electroporation for hepatic tumors in proximity to vital structures. J surg oncol 107: 544-549. https://doi.org/10.1002/jso.23280
|
| [4] | Casey AE (1934) The experimental alteration of malignancy with an homologous mammalian tumor material: I. Results with intratesticular inoculation. Am J Cancer 21: 760-775. |
| [5] |
Chopinet L, Wasungu L, Rols MP (2012) First explanations for differences in electrotransfection efficiency in vitro and in vivo using spheroid model. Int J pharmaceut 423: 7-15. https://doi.org/10.1016/j.ijpharm.2011.04.054
|
| [6] |
Collin A, Copol C, Pianet V, et al. (2021) Spatial mechanistic modeling for prediction of the growth of asymptomatic meningiomas. Comput Meth Prog Biomed 199: 105829. https://doi.org/10.1016/j.cmpb.2020.105829
|
| [7] |
Frandsen SK, Gibot L, Madi M, et al. (2015) Calcium electroporation: evidence for differential effects in normal and malignant cell lines, evaluated in a 3D spheroid model. PLoS One 10: e0144028. https://doi.org/10.1371/journal.pone.0144028
|
| [8] |
Gibot L, Wasungu L, Teissi J, et al. (2013) Antitumor drug delivery in multicellular spheroids by electropermeabilization. J control Release 167: 138-147. https://doi.org/10.1016/j.jconrel.2013.01.021
|
| [9] | Gompertz B (1825) XXIV. On the nature of the function expressive of the law of human mortality, and on a new mode of determining the value of life contingencies. In a letter to Francis Baily, Esq. FRS &c. Philos Trans R Soc London 1825: 513-583. https://doi.org/10.1098/rstl.1825.0026 |
| [10] |
Kolosnjaj-Tabi J, Gibot L, Fourquaux I, et al. (2019) Electric field-responsive nanoparticles and electric fields: physical, chemical, biological mechanisms and therapeutic prospects. Adv drug Deliver Rev 138: 56-67. https://doi.org/10.1016/j.addr.2018.10.017
|
| [11] |
Kuhn E, Lavielle M (2005) Maximum likelihood estimation in nonlinear mixed effects models. Comput Stat Data An 49: 1020-1038. https://doi.org/10.1016/j.csda.2004.07.002
|
| [12] |
Laird AK (1964) Dynamics of tumour growth. Br J Cancer 18: 490. https://doi.org/10.1038/bjc.1964.55
|
| [13] |
Laird AK (1965) Dynamics of tumour growth: comparison of growth rates and extrapolation of growth curve to one cell. Br J Cancer 19: 278. https://doi.org/10.1038/bjc.1965.32
|
| [14] |
Marty M, Sersa G, Garbay JR, et al. (2006) Electrochemotherapy–An easy, highly effective and safe treatment of cutaneous and subcutaneous metastases: Results of ESOPE (European Standard Operating Procedures of Electrochemotherapy) study. Eur J Cancer Suppl 4: 3-13. https://doi.org/10.1016/j.ejcsup.2006.08.002
|
| [15] |
Michel T, Fehrenbach J, Lobjois V, et al. (2018) Mathematical modeling of the proliferation gradient in multicellular tumor spheroids. J Theor Biol 458: 133-147. https://doi.org/10.1016/j.jtbi.2018.08.031
|
| [16] |
Miller L, Leor J, Rubinsky B (2005) Cancer cells ablation with irreversible electroporation. Technol Cancer Res Treat 4: 699-705. https://doi.org/10.1177/153303460500400615
|
| [17] | Norton L (1988) A Gompertzian model of human breast cancer growth. Cancer Res 48: 7067-7071. https://doi.org/10.1177/153303460500400615 |
| [18] |
Pelofy S, Bousquet H, Gibot L, et al. (2021) Transfer of small interfering RNA by electropermeabilization in tumor spheroids. Bioelectrochemistry 141: 107848. https://doi.org/10.1016/j.bioelechem.2021.107848
|
| [19] |
Ribba B, Holford NH, Magni P, et al. (2014) A review of mixed-effects models of tumor growth and effects of anticancer drug treatment used in population analysis. CPT: Pharmacometrics Syst Pharmacol 3: 1-10. https://doi.org/10.1038/psp.2014.12
|
| [20] |
Scheffer HJ, Nielsen K, de Jong MC, et al. (2014) Irreversible electroporation for nonthermal tumor ablation in the clinical setting: a systematic review of safety and efficacy. J Vasc Int Radiol 25: 997-1011. https://doi.org/10.1016/j.jvir.2014.01.028
|
| [21] |
Vaghi C, Rodallec A, Fanciullino R, et al. (2020) Population modeling of tumor growth curves and the reduced Gompertz model improve prediction of the age of experimental tumors. PLoS computational biology 16: e10071. https://doi.org/10.1371/journal.pcbi.1007178
|
 bioeng-09-02-009-s001.pdf bioeng-09-02-009-s001.pdf |
 |


Figures(11) / Tables(4)

Annabelle Collin, Hadrien Bruhier, Jelena Kolosnjaj, Muriel Golzio, Marie-Pierre Rols, Clair Poignard. Spatial mechanistic modeling for prediction of 3D multicellular spheroids behavior upon exposure to high intensity pulsed electric fields[J]. AIMS Bioengineering, 2022, 9(2): 102-122. doi: 10.3934/bioeng.2022009


 DownLoad: