The extraction of the total soluble solid compounds from the pulp fruit Phoenix dactylifera L. is a major challenge for their valorization in the date fruit industry. However, conventional aqueous extraction methods are limited in terms of efficiency and processing time. In order to optimize this process, this study explores and compares three extraction methods: microwave-assisted extraction (MAE), ultrasound-assisted extraction (UAE), and conventional water bath–assisted extraction (WAE). The primary objective of this study is to maximize extraction recovery (ER) by performing an optimization using a Box–Behnken design (BBD). The second objective is to analyze the impact of the three extraction methods on extraction recovery, functional attributes, biochemical characteristics, antioxidant and antibacterial activities of the optimized date pulp aqueous extract (DPAE). Results obtained using mathematical models showed significant differences (p < 0.05) between the three methods tested. Optimum extraction conditions were determined as follows: for WAE, a solid/liquid (S/L) ratio of 1/4.68 g/mL, a temperature of 80 ℃, and a duration of 38.63 minutes; for MAE, an S/L ratio of 1/6 g/mL, an irradiation power of 480 W, and a duration of 11 minutes; for UAE, an S/L ratio of 1/5 g/mL, a sonication amplitude of 40%, and a duration of 60 minutes. The MAE method stood out for its extraction efficiency, with ER = 79.90% ± 1.54% and being three times faster than WAE and MAE. It also provided the highest concentrations of total soluble solids (14.33% ± 0.11% FW), total sugars (22.23 ± 0.23 g/100 mL DPAE), and total polyphenols (1.69 ± 0.04 mg GAE/mL DPAE). The antioxidant activity of DPAE was high, with an IC50 of 729.80 ± 12.87 μg/mL of the methanolic extract. These results suggest that the optimization of extraction processes, particularly using microwave technology, could offer promising prospects for the valorization of date fruit products by improving the production efficiency of a natural and nutritious DPAE, potentially beneficial to the date fruit industry in terms of product quality and cost reduction.
Citation: Naima Belguedj, Ghayth Rigane, Ridha Ben Salem, Khodir Madani. Conventional and eco-friendly aqueous extraction methods of date palm fruit compounds: Optimization, comparison, characterization of the date pulp extract and value-added potential[J]. AIMS Agriculture and Food, 2025, 10(1): 218-246. doi: 10.3934/agrfood.2025012
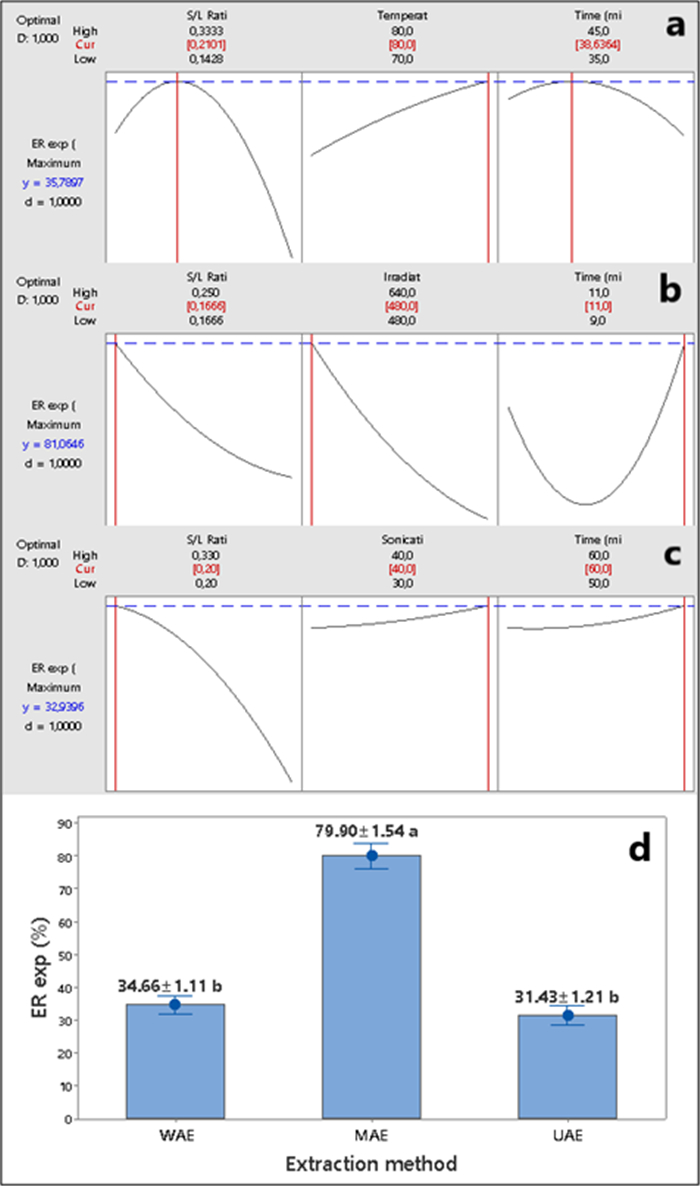
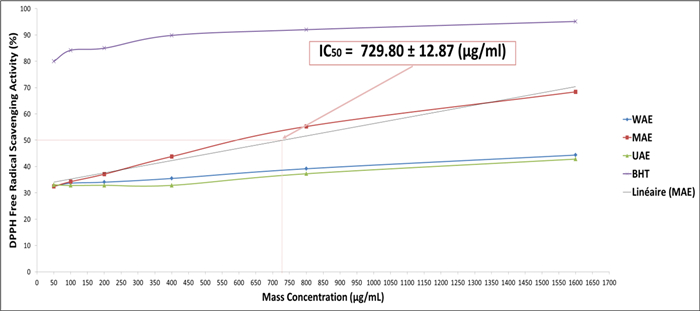
The extraction of the total soluble solid compounds from the pulp fruit Phoenix dactylifera L. is a major challenge for their valorization in the date fruit industry. However, conventional aqueous extraction methods are limited in terms of efficiency and processing time. In order to optimize this process, this study explores and compares three extraction methods: microwave-assisted extraction (MAE), ultrasound-assisted extraction (UAE), and conventional water bath–assisted extraction (WAE). The primary objective of this study is to maximize extraction recovery (ER) by performing an optimization using a Box–Behnken design (BBD). The second objective is to analyze the impact of the three extraction methods on extraction recovery, functional attributes, biochemical characteristics, antioxidant and antibacterial activities of the optimized date pulp aqueous extract (DPAE). Results obtained using mathematical models showed significant differences (p < 0.05) between the three methods tested. Optimum extraction conditions were determined as follows: for WAE, a solid/liquid (S/L) ratio of 1/4.68 g/mL, a temperature of 80 ℃, and a duration of 38.63 minutes; for MAE, an S/L ratio of 1/6 g/mL, an irradiation power of 480 W, and a duration of 11 minutes; for UAE, an S/L ratio of 1/5 g/mL, a sonication amplitude of 40%, and a duration of 60 minutes. The MAE method stood out for its extraction efficiency, with ER = 79.90% ± 1.54% and being three times faster than WAE and MAE. It also provided the highest concentrations of total soluble solids (14.33% ± 0.11% FW), total sugars (22.23 ± 0.23 g/100 mL DPAE), and total polyphenols (1.69 ± 0.04 mg GAE/mL DPAE). The antioxidant activity of DPAE was high, with an IC50 of 729.80 ± 12.87 μg/mL of the methanolic extract. These results suggest that the optimization of extraction processes, particularly using microwave technology, could offer promising prospects for the valorization of date fruit products by improving the production efficiency of a natural and nutritious DPAE, potentially beneficial to the date fruit industry in terms of product quality and cost reduction.

| [1] | FAOSTAT (2023) Production/Yield quantities of Dates in Algeria 2023. Available from: https://www.fao.org/faostat/fr/#data/QCL/visualize. |
| [2] |
Alharbi KL, Raman J, Shin HJ (2021) Date fruit and seed in nutricosmetics. Cosmetics 8: 59. https://doi.org/10.3390/cosmetics8030059 doi: 10.3390/cosmetics8030059

|
| [3] |
Ouamnina A, Alahyane A, Elateri I, et al. (2024) Relationship between phenolic compounds and antioxidant activity of some Moroccan date palm fruit varieties (Phoenix dactylifera L.): A two-year study. Plants 13: 1119. https://doi.org/10.3390/plants13081119 doi: 10.3390/plants13081119
|
| [4] |
Hinkaew J, Aursalung A, Sahasakul Y, et al. (2021) A comparison of the nutritional and biochemical quality of date palm fruits obtained using different planting techniques. Molecules 26: 2245. https://doi.org/10.3390/molecules26082245 doi: 10.3390/molecules26082245
|
| [5] |
Khalil N, Elbeltagy AE, Aljutaily T, et al. (2023) Organoleptic, antioxidant activity and microbial aspects of functional biscuit formulated with date fruit fibers grown in Qassim Region. Food Sci Technol (Brazil) 43: e95222. https://doi.org/10.1590/fst.95222 doi: 10.1590/fst.95222
|
| [6] |
Julai K, Sridonpai P, Ngampeerapong C, et al. (2023). Effects of extraction and evaporation methods on physico-chemical, functional, and nutritional properties of syrups from Barhi dates (Phoenix dactylifera L.). Foods 12: 1268. https://doi.org/10.3390/foods12061268 doi: 10.3390/foods12061268
|
| [7] |
Idowu AT, Igiehon OO, Adekoya AE, et al. (2020) Dates palm fruits: A review of their nutritional components, bioactivities and functional food applications. AIMS Agric Food 5: 734. https://doi.org/10.3934/agrfood.2020.4.734 doi: 10.3934/agrfood.2020.4.734
|
| [8] |
Al-Okbi SY (2022) Date palm as source of nutraceuticals for health promotion: A review. Curr Nutr Rep 11: 574–591. https://doi.org/10.1007/s13668-022-00437-w doi: 10.1007/s13668-022-00437-w
|
| [9] |
Ben Yahmed N, Dauptain K, Lajnef I, et al. (2021) New sustainable bioconversion concept of date by-products (Phoenix dactylifera L.) to biohydrogen, biogas and date-syrup. Int J Hydrogen Energy 46: 297–305. https://doi.org/10.1016/j.ijhydene.2020.09.203 doi: 10.1016/j.ijhydene.2020.09.203
|
| [10] |
Djaoud K, Arkoub-Djermoune L, Remini H, et al. (2020) Syrup from common date variety (Phoenix dactylifera L.): Optimization of sugars extraction and their quantification by high performance liquid chromatography. Curr Nutr Food Sci 16: 530–542. https://doi.org/10.2174/1573401315666190115160950 doi: 10.2174/1573401315666190115160950
|
| [11] |
Mahdi ZI, El-Sharnouby GA, Sharoba A (2022) Physicochemical properties and microbiological quality of dates syrup prepared from some Egyptian and Iraqi dates palm (Phoenix dactylifera L.) fruits. Egypt J Chem 65: 175–184. https://doi.org/10.21608/ejchem.2022.150877.6535 doi: 10.21608/ejchem.2022.150877.6535
|
| [12] |
AlYammahi J, Hai A, Krishnamoorthy R, et al. (2022) Ultrasound-assisted extraction of highly nutritious date sugar from date palm (Phoenix dactylifera) fruit powder: Parametric optimization and kinetic modeling. Ultrason Sonochem 88: 106107. https://doi.org/10.1016/j.ultsonch.2022.106107 doi: 10.1016/j.ultsonch.2022.106107
|
| [13] |
Pal P, Corpuz AG, Hasan SW, et al. (2024) Soluble natural sweetener from date palm (Phoenix dactylifera L.) extract using colloidal gas aphrons generated with a food-grade non-ionic surfactant. J Food Sci Technol 61: 1374–1382. https://doi.org/10.1007/s13197-023-05907-9 doi: 10.1007/s13197-023-05907-9
|
| [14] |
Ganbi HHA (2012) Production of nutritious high quality date (Phoenix dactylifera) fruits syrup (Dibs) by using some novel technological approaches. J Appl Sci Res 2012: 1524–1538. https://doi.org/10.5555/20133012564 doi: 10.5555/20133012564
|
| [15] | Beg S, Akhter S (2021) Box–Behnken designs and their applications in pharmaceutical product development. In: Beg S (Eds.), Design of Experiments for Pharmaceutical Product Development Volume I: Basic and Fundamental Principles, Springer, Singapore, 77–85. https://doi.org/10.1007/978-981-33-4717-5 |
| [16] |
Chaira N, Ferchichi A, Mrabet A, et al. (2007) Characterization of date juices extracted from the rest of sorting of Deglet Nour variety. Biotechnology 6: 251–256. https://doi.org/10.3923/biotech.2007.251.256 doi: 10.3923/biotech.2007.251.256
|
| [17] |
Trigui M, Gabsi K, Amri IE, et al. (2011) Modular feed forward networks to predict sugar diffusivity from date pulp Part I. Model validation. Int J Food Prop 14: 356–370. https://doi.org/10.1080/10942910903191609 doi: 10.1080/10942910903191609
|
| [18] |
Messadi N, Mechmeche M, Setti K, et al. (2023) Optimization of extraction parameters and characterization of Tunisian date extract: A scientific approach toward their utilization. Sugar Tech 25: 460–472. https://doi.org/10.1007/s12355-022-01223-2 doi: 10.1007/s12355-022-01223-2
|
| [19] |
Nishad J, Saha S, Dubey AK, et al. (2019) Optimization and comparison of non-conventional extraction technologies for Citrus paradisi L. peels: A valorization approach. J Food Sci Technol 56: 1221–1233. https://doi.org/10.1007/s13197-019-03585-0 doi: 10.1007/s13197-019-03585-0
|
| [20] |
Flórez N, Conde E, Domínguez H, et al. (2015) Microwave assisted water extraction of plant compounds. J Chem Technol Biotechnol 90: 590–607. https://doi.org/10.1002/jctb.4519 doi: 10.1002/jctb.4519
|
| [21] |
Weremfo A, Adulley F, Adarkwah-Yiadom M (2020) Simultaneous optimization of microwave-assisted extraction of phenolic compounds and antioxidant activity of avocado (Persea americana Mill.) seeds using response surface methodology. J Anal Methods Chem 2020: 7541. https://doi.org/10.1155/2020/7541927 doi: 10.1155/2020/7541927
|
| [22] |
López CJ, Caleja C, Prieto MA, et al. (2018) Optimization and comparison of heat and ultrasound assisted extraction techniques to obtain anthocyanin compounds from Arbutus unedo L. Fruits. Food Chem 264: 81–91. https://doi.org/10.1016/j.foodchem.2018.04.103 doi: 10.1016/j.foodchem.2018.04.103
|
| [23] | AFNOR (French Association of Standardization. Association Française de NORmalisation, in French) (1984) Collection of French standards. Fruit and vegetable juice derivates. (Recueil de normes françaises. Produits dérivés des fruits et légumes jus de fruits, in French). 2nd edition, Paris, France, 343p. |
| [24] |
Vickers JE, Grof CPL, Bonnett GD, et al. (2005) Overexpression of polyphenol oxidase in transgenic sugarcane results in darker juice and raw sugar. Crop Sci 45: 354–362. https://doi.org/10.2135/cropsci2005.0354 doi: 10.2135/cropsci2005.0354
|
| [25] |
Muñoz A, Caminiti IM, Palgan I, et al. (2012) Effects on Escherichia coli inactivation and quality attributes in apple juice treated by combinations of pulsed light and thermosonication. Food Res Int 45: 299–305. https://doi.org/10.1016/j.foodres.2011.08.020 doi: 10.1016/j.foodres.2011.08.020
|
| [26] |
Rai P, Majumdar GC, Sharma G, et al. (2006) Effect of various cutoff membranes on permeate flux and quality during filtration of Mosambi (Citrus sinensis (L.) Osbeck) juice. Food Bioprod Process 84: 213–219. https://doi.org/10.1205/fbp.05181 doi: 10.1205/fbp.05181
|
| [27] |
Dubois M, Gilles KA, Hamilton JK, et al. (1956) Colorimetric method for determination of sugars and related substances. Anal Chem 28: 350. https://doi.org/10.1021/ac60111a017 doi: 10.1021/ac60111a017
|
| [28] | Miller, GL (1959) Modified DNS method for reducing sugars. Anal Chem 31: 426–428. |
| [29] |
Amira EA, Guido F, Behija SE, et al. (2011) Chemical and aroma volatile compositions of date palm (Phoenix dactylifera L.) fruits at three maturation stages. Food Chem 127: 1744–1754. https://doi.org/10.1016/j.foodchem.2011.02.051 doi: 10.1016/j.foodchem.2011.02.051
|
| [30] |
Assadi I, Elfalleh W, Benabderrahim MA, et al. (2019) Nutritional quality and antioxidant capacity of a combination of pomegranate and date juices. Int J Fruit Sci 19: 1512438. https://doi.org/10.1080/15538362.2018.1512438 doi: 10.1080/15538362.2018.1512438
|
| [31] |
Begum R, Yusof Y, Aziz M, et al. (2017) Screening of fruit wastes as pectin source. J Environ Sci Nat Resour 10: 65–70. https://doi.org/10.3329/jesnr.v10i1.34696 doi: 10.3329/jesnr.v10i1.34696
|
| [32] |
Subedi T (2023) An assessment of mineral contents in fruits. Prithvi Acad J 6: 21–21. https://doi.org/10.3126/paj.v6i1.54603 doi: 10.3126/paj.v6i1.54603
|
| [33] |
Ruiz-Matute AI, Rodrıguez-Sanchez S, Sanz ML, et al. (2010) Detection of adulterations of honey with high fructose syrups from inulin by GC analysis. J Food Compos Anal 23: 273–276. https://doi:10.1016/j.jfca.2009.10.004 doi: 10.1016/j.jfca.2009.10.004
|
| [34] |
Saleh EA, Tawfik MS, Abu-Tarboush HM (2011) Phenolic contents and antioxidant activity of various date palm (Phoenix dactylifera L.) fruits from Saudi Arabia. Food Nutr Sci 2: 16364. https://doi.org/10.4236/fns.2011.210152 doi: 10.4236/fns.2011.210152
|
| [35] |
Braca A, Sortino C, Politi M, et al. (2002) Antioxidant activity of flavonoids from Licania licaniaeflora. J Ethnopharmacol 79: 379–381. https://doi.org/10.1016/s0378-8741(01)00413-5 doi: 10.1016/s0378-8741(01)00413-5
|
| [36] |
Hernández-Pérez M, Rabanal RM, Arias A, et al. (1999) Aethiopinone, an antibacterial and cytotoxic agent from Salvia aethiopis roots. Pharm Biol 37: 17–21. https://doi.org/10.1076/phbi.37.1.17.6321 doi: 10.1076/phbi.37.1.17.6321
|
| [37] |
Shill DK, Kumar U, al Hossain AM, et al. (2022) Development and optimization of RP-UHPLC method for mesalamine through QbD approach. Dhaka Univ J Pharm Sci 21: 77–84. https://doi.org/10.3329/dujps.v21i1.60399 doi: 10.3329/dujps.v21i1.60399
|
| [38] |
Mgoma ST, Basitere M, Mshayisa VV (2021) Kinetics and thermodynamics of oil extraction from South African hass avocados using hexane as a solvent. S Afr J Chem Eng 37: 244–251. https://doi.org/10.1016/j.sajce.2021.06.007 doi: 10.1016/j.sajce.2021.06.007
|
| [39] |
El-Sharnouby GA, Eleid SM, Al-Otaibi MM (2014) Liquid sugar extraction from date palm (Phoenix dactylifera L.) fruits. J Food Process Technol 5: 402. https://doi.org/10.4172/2157-7110.1000402 doi: 10.4172/2157-7110.1000402
|
| [40] |
Kadlezir F, Mohagir AM, Desobgo SCZ (2024) Extracting juice from dates (Phoenix dactylifera L.) using response surface methodology: Effect on pH, vitamin C, titratable acidity, free amino nitrogen (FAN) and polyphenols. Appl Food Res 4: 100375. https://doi.org/10.1016/j.afres.2023.100375 doi: 10.1016/j.afres.2023.100375
|
| [41] | Mandal, V, Mohan, Y, Hemalatha, SJPR (2007) Microwave assisted extraction—An innovative and promising extraction tool for medicinal plant research. Pharmacogn Rev 1: 7–18. |
| [42] |
Chambaud, M, Colas, C, Destandau, E (2023) Water-based microwave-assisted extraction of pigments from madder optimized by a box-Behnken design. Separations 10: 433. https://doi.org/10.3390/separations10080433 doi: 10.3390/separations10080433
|
| [43] |
Rocha S, Marzialetti T, Kopp M, et al. (2021). Reaction mechanism of the microwave-assisted synthesis of 5-hydroxymethylfurfural from sucrose in sugar beet molasses. Catalysts 11: 1458. https://doi.org/10.3390/catal11121458 doi: 10.3390/catal11121458
|
| [44] |
Entezari MH, Hagh Nazary S, Haddad Khodaparast MH (2004) The direct effect of ultrasound on the extraction of date syrup and its micro-organisms. Ultrason Sonochem 11: 379–384. https://doi.org/10.1016/j.ultsonch.2003.10.005 doi: 10.1016/j.ultsonch.2003.10.005
|
| [45] |
Hasni S, Rigane G, Ghazghazi H, et al. (2021) Optimum conditions and LC-ESI-MS analysis of phenolic rich extract from Eucalyptus Marginata L. under maceration and ultrasound-assisted extraction methods using response surface methodology. J Food Qual 2021: 5591022. https://doi.org/10.1155/2021/5591022 doi: 10.1155/2021/5591022
|
| [46] |
Vinatoru M, Mason TJ, Calinescu I (2017) Ultrasonically assisted extraction (UAE) and microwave assisted extraction (MAE) of functional compounds from plant materials. TrAC Trends Anal Chem 97: 159–178. https://doi.org/10.1016/j.trac.2017.09.002 doi: 10.1016/j.trac.2017.09.002
|
| [47] |
Sridhar A, Vaishampayan V, Senthil Kumar P, et al. (2022) Extraction techniques in food industry: Insights into process parameters and their optimization. Food Chem Toxicol 166: 113207. https://doi.org/10.1016/j.fct.2022.113207 doi: 10.1016/j.fct.2022.113207
|
| [48] |
Cendres A, Chemat F, Page D, et al. (2012) Comparison between microwave hydrodiffusion and pressing for plum juice extraction. LWT-Food Sci Technol 49: 229–237. https://doi.org/10.1016/j.lwt.2012.06.027 doi: 10.1016/j.lwt.2012.06.027
|
| [49] |
Turk M, Perino S, Cendres A, et al. (2017) Alternative process for strawberry juice processing: Microwave hydrodiffusion and gravity. LWT-Food Sci Technol 84: 626–633. https://doi.org/10.1016/j.lwt.2017.06.030 doi: 10.1016/j.lwt.2017.06.030
|
| [50] | Ogblechi SR, Ige MT (2014) Development and evaluation of a mechanical extractor for date palm fruit juice. In: 2nd International Conference on Applied Social Science Research (ICASSR 2014). Atlantis Press, 104: 85–88. https://doi.org/10.2991/icassr-14.2014.24 |
| [51] |
Samsalee N, Sothornvit R (2022) Different novel extraction techniques on chemical and functional properties of sugar extracts from spent coffee grounds. AIMS Agric Food 7: 897–915. https://doi.org/10.3934/agrfood.2022055 doi: 10.3934/agrfood.2022055
|
| [52] |
Masmoudi M, Besbes S, Blecker C, et al. (2010). Preparation and characterization of jellies with reduced sugar content from date (Phoenix dactylifera L.) and lemon (Citrus limon L.) by-products. Fruits 65: 21–29. https://doi.org/10.1051/fruits/2009038 doi: 10.1051/fruits/2009038
|
| [53] |
Kulkarni SG, Vijayanand P, Shubha L (2010) Effect of processing of dates into date juice concentrate and appraisal of its quality characteristics. J Food Sci Technol 47: 157–161. https://doi.org/10.1007/S13197-010-0028-Y doi: 10.1007/S13197-010-0028-Y
|
| [54] |
Yan-xi HOU, Ming-rui WANG, Xin LI, et al. (2023) Changes of methanol content during pectinase clarification of honey melon juice. Food Mach 39: 32–36. https://doi.org/10.13652/j.spjx.1003.5788.2022.60155 doi: 10.13652/j.spjx.1003.5788.2022.60155
|
| [55] |
Fikry M, Yusof YA, Al-Awaadh AM, et al. (2023) Assessment of physical and sensory attributes of date-based energy drink treated with ultrasonication: Modelling changes during storage and predicting shelf life. Processes 11: 1399. https://doi.org/10.3390/pr11051399 doi: 10.3390/pr11051399
|
| [56] |
Patrignani M, Brantsen JF, Awika JM, et al. (2021) Application of a novel microwave energy treatment on brewers' spent grain (BSG): Effect on its functionality and chemical characteristics. Food Chem 346: 128935. https://doi.org/10.1016/j.foodchem.2020.128935 doi: 10.1016/j.foodchem.2020.128935
|
| [57] |
El-Nagga EA, Abd El–Tawab YA (2012) Compositional characteristics of date syrup extracted by different methods in some fermented dairy products. Ann Agric Sci 57: 29–36. https://doi.org/10.1016/j.aoas.2012.03.007 doi: 10.1016/j.aoas.2012.03.007
|
| [58] |
Yilmaz Y, Toledo R (2005) Antioxidant activity of water-soluble Maillard reaction products. Food Chem 93: 273–278. https://doi.org/10.1016/j.foodchem.2004.09.043 doi: 10.1016/j.foodchem.2004.09.043
|
| [59] |
Zahid I, Nazir MH, Javed MA (2024) Extraction of bioactive components from date palm waste, various extraction processes and their applications: A review. Biomass Bioenergy 190: 107433. https://doi.org/10.1016/j.biombioe.2024.107433 doi: 10.1016/j.biombioe.2024.107433
|
| [60] |
Yusoff IM, Taher ZM, Rahmat Z, et al. (2022) A review of ultrasound-assisted extraction for plant bioactive compounds: Phenolics, flavonoids, thymols, saponins and proteins. Food Res Int 157: 111268. https://doi.org/10.1016/j.foodres.2022.111268 doi: 10.1016/j.foodres.2022.111268
|
| [61] |
Nariya PB, Bhalodia NR, Shukla VJ, et al. (2013). In vitro evaluation of antioxidant activity of Cordia dichotoma (Forst f.) bark. AYU (An International Quarterly Journal of Research in Ayurveda) 34:124–128. https://doi.org/10.4103/0974-8520.115451 doi: 10.4103/0974-8520.115451
|
| [62] |
Djaoud K, Daglia M, Sokeng AJT, et al. (2020) RP-HPLC-PDA-ESI-MS/MS screening of bioactive compounds from Degla-Beida dates: Conventional and green extraction technologies. An Univ "Dunărea de Jos" Galaţi, Fasc Ⅵ Food Technol 44: 58–81. https://doi.org/10.35219/foodtechnology.2020.1.04 doi: 10.35219/foodtechnology.2020.1.04
|
| [63] |
Manai S, Boulila A, Silva AS, et al. (2024) Recovering functional and bioactive compounds from date palm by-products and their application as multi-functional ingredients in food. Sustainable Chem Pharm 38: 101475. https://doi.org/10.1016/j.scp.2024.101475 doi: 10.1016/j.scp.2024.101475
|
| [64] |
Ashraf Z, Hamidi-Esfahani Z (2011) Date and date processing: A review. Food Rev Int 27: 101–133. https://doi.org/10.1080/87559129.2010.535231 doi: 10.1080/87559129.2010.535231
|
| [65] | Whitney R, Taylor M, Monti J (2007) The challenges of changing retention times in GC-MS. Available from: https://www.spectroscopyonline.com/view/challenges-changing-retention-times-gc-ms. |
| [66] |
Kranenburg RF, García-Cicourel AR, Kukurin C, et al. (2019) Distinguishing drug isomers in the forensic laboratory: GC-VUV in addition to GC-MS for orthogonal selectivity and the use of library match scores as a new source of information. Forensic Sci Int 302: 109900. https://doi.org/10.1016/j.forsciint.2019.109900 doi: 10.1016/j.forsciint.2019.109900
|
| [67] |
Gabsi K, Trigui M, Helal AN, et al. (2013) CFD modeling to predict diffused date syrup yield and quality from sugar production process. J Food Eng 118: 205–212. https://doi.org/10.1016/j.jfoodeng.2013.04.011 doi: 10.1016/j.jfoodeng.2013.04.011
|
| [68] | Belguedj M (2002) Genetic resources of the date palm, characteristics of date cultivars in the palm groves of southeastern Algeria (Les ressources génétiques du palmier dattier, caractéristiques des cultivars de dattiers dans les palmeraies du Sud-Est Algérien, in french). National Agricultural Research Institute of Algeria INRAA (Institut national de la recherche agronomique d'Algérie INRAA, in French), El-Harrach, Algiers, Algeria, 1: 289. |
| [69] |
Masmoudi M, Besbes S, Chaabouni M, et al. (2008) Optimization of pectin extraction from lemon by-product with acidified date juice using response surface methodology. Carbohydr Polym 74: 185–192. https://doi.org/10.1016/j.carbpol.2008.02.003 doi: 10.1016/j.carbpol.2008.02.003
|
| [70] |
Hassim N, Markom M, Anuar N, et al. (2015). Antioxidant and antibacterial assays on polygonum minus extracts: different extraction methods. Int J Chem Eng 2015: 826709. https://doi.org/10.1155/2015/826709 doi: 10.1155/2015/826709
|
| [71] | El Sohaimy S, Abdelwahab AE, Brennan CS (2015). Phenolic content, antioxidant and antimicrobial activities of Egyptian date palm (Phoenix dactylifera L.) fruits. Aust J Basic Appl Sci 9: 141–147. |
| [72] |
Saleh FA, Otaibi MM (2013) Antibacterial activity of date palm (Phoenix dectylifera L.) fruit at different ripening stages. J Food Process Technol 4: 1–6. https://doi.org/10.4172/2157-7110.10002 doi: 10.4172/2157-7110.10002
|
| [73] |
Al-daihan S, Shafi Bhat R (2012) Antibacterial activities of extracts of leaf, fruit, seed and bark of Phoenix dactylifera. Afr J Biotechnol 11: 10021–10025. https://doi.org/10.5897/ajb11.4309 doi: 10.5897/ajb11.4309
|
| [74] |
Bhaskaracharya RK, Bhaskaracharya A, Stathopoulos C (2023) A systematic review of antibacterial activity of polyphenolic extract from date palm (Phoenix dactylifera L.) kernel. Front Pharmacol 13: 1043548. https://doi.org/10.3389/fphar.2022.104354 doi: 10.3389/fphar.2022.104354
|
| [75] |
Pitout JD (2012) Extraintestinal pathogenic Escherichia coli: A combination of virulence with antibiotic resistance. Front Microbiol 3: 9. https://doi.org/10.3389/fmicb.2012.00009 doi: 10.3389/fmicb.2012.00009
|
| [76] |
Gowda NN, Gurikar C, Anusha MB, et al. (2022) Ultrasound-assisted and microwave-assisted extraction, GC-MS characterization and antimicrobial potential of freeze-dried L. camara flower. J Pure Appl Microbiol 16: 526–540. https://doi.org/10.22207/JPAM.16.1.50 doi: 10.22207/JPAM.16.1.50
|
| [77] |
Chan CH, Yusoff R, Ngoh GC, et al. (2011) Microwave-assisted extractions of active ingredients from plants. J Chromatogr A 1218: 6213–6225. https://doi.org/10.1016/j.chroma.2011.07.040 doi: 10.1016/j.chroma.2011.07.040
|
| [78] |
Lasunon P, Phonkerd N, Tettawong P, et al. (2021) Effect of microwave-assisted extraction on bioactive compounds from industrial tomato waste and its antioxidant activity. Food Res 5: 468–474. https://doi.org/10.26656/fr.2017.5(2).516 doi: 10.26656/fr.2017.5(2).516
|
| [79] |
Khalfi A, Garrigós MC, Ramos M, et al. (2024) Optimization of the microwave-assisted extraction conditions for phenolic compounds from date seeds. Foods 13: 3771. https://doi.org/10.3390/foods13233771 doi: 10.3390/foods13233771
|
| [80] |
Peng S, Zhu M, Li S, et al. (2023). Ultrasound-assisted extraction of polyphenols from Chinese propolis. Front Sustainable Food Syst 7: 1131959. https://doi.org/10.3389/fsufs.2023.1131959 doi: 10.3389/fsufs.2023.1131959
|
| [81] | Abdennabi R, Gaboriaud N, Ahluwalia V, et al. (2017) Microwave-assisted extraction of phenolic compounds from date palm saps (Phoenix dactylifera L.) and their antioxidant, antidiabetic and antibacterial activities evaluation. Mathews J Diabetes Obes 2: 1–6. |
| [82] |
Sandeep G, Arumugam T, Janavi GJ, et al. (2023) A Comparative study on conventional and non-conventional extraction methodologies for extraction yield, quality and antibacterial properties of moringa (Moringa oleifera Lam.). J Appl Hortic 25: 17–24. https://doi.org/10.37855/jah.2023.v25i01.03 doi: 10.37855/jah.2023.v25i01.03
|
| [83] |
Deng X, Huang H, Huang S, et al. (2022) Insight into the incredible effects of microwave heating: Driving changes in the structure, properties and functions of macromolecular nutrients in novel food. Front Nutr 9: 941527. https://doi.org/10.3389/fnut.2022.941527 doi: 10.3389/fnut.2022.941527
|
| [84] |
Bouarab-Chibane L, Forquet V, Lantéri P, et al. (2019) Antibacterial properties of polyphenols: characterization and QSAR (Quantitative structure-activity relationship) models. Front Microbiol 10: 829. https://doi.org/10.3389/fmicb.2019.00829 doi: 10.3389/fmicb.2019.00829
|
| [85] |
Mondal J, Lakkaraju R, Ghosh P, et al. (2021) Acoustic cavitation-induced shear: A mini-review. Biophys Rev 13: 1229–1243. https://doi.org/10.1007/s12551-021-00896-5 doi: 10.1007/s12551-021-00896-5
|
| [86] |
Rahmatia L, Irawan C, Sukiman M, et al. (2023) Optimization of ultrasonic-assisted extraction methods of Gymnanthemum amygdalinum del for antioxidant and antibacterial activities. Egypt J Chem 66: 379–387. https://doi.org/10.21608/EJCHEM.2023.187526.7490 doi: 10.21608/EJCHEM.2023.187526.7490
|
| [87] |
Gonelimali FD, Lin J, Miao W, et al. (2018) Antimicrobial properties and mechanism of action of some plant extracts against food pathogens and spoilage microorganisms. Front Microbiol 9: 1639. https://doi.org/10.3389/fmicb.2018.01639 doi: 10.3389/fmicb.2018.01639
|
| [88] |
Bessalah S, Khorchani T, Hammadi M, et al. (2023) Inhibitory potential of natural plant extracts against Escherichia coli strain isolated from diarrheic camel calves. Open Vet J 13: 1082–1090. http://dx.doi.org/10.5455/OVJ.2023.v13.i9.3 doi: 10.5455/OVJ.2023.v13.i9.3
|
| [89] | Gattupalli N, Gattupalli A (2021) Potential of Escherichia coli probiotics for improved health and disease management. In: Edition: Erjavec MS (Ed.), Escherichia coli-Old and New Insights. IntechOpen. https://doi.org/10.5772/intechopen.100380 |
Figures(4) / Tables(5)

Naima Belguedj, Ghayth Rigane, Ridha Ben Salem, Khodir Madani. Conventional and eco-friendly aqueous extraction methods of date palm fruit compounds: Optimization, comparison, characterization of the date pulp extract and value-added potential[J]. AIMS Agriculture and Food, 2025, 10(1): 218-246. doi: 10.3934/agrfood.2025012


 DownLoad: