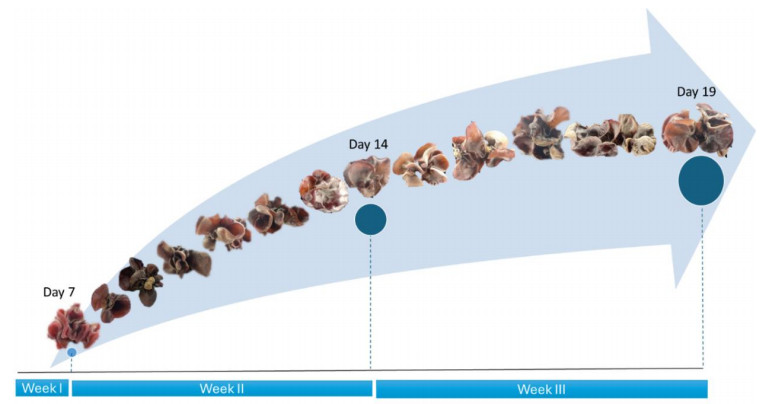
Auricularia auricula-judae (ear mushroom) exhibits significant biological and pharmacological properties, particularly as an antioxidant due to its phenolic compounds. This study introduces a novel ultrasound-assisted extraction technique to quantify phenolic compounds and assess antioxidant activity in ear mushrooms. Key extraction factors, including solvent-to-sample ratio (10:1, 20:1, 30:1 mL/g), pulse duty cycle (0.2, 0.5, 0.8 s-1), and temperature (10, 35, 60 ℃), were optimized using a Box–Behnken design and response surface methodology (RSM). Methanol was identified as the most effective solvent, yielding the highest total phenolic content (TPC) and antioxidant activity. The optimal conditions for TPC and 2, 2-diphenyl-1-picryl hydrazyl (DPPH) inhibition were determined to be 1 g of sample with 18 mL of methanol at 59 ℃ and a pulse duty cycle of 0.7 s-1. This method achieved a recovery rate of 94.85% for TPC and 92.71% for antioxidant inhibition and was validated with high precision (CV < 5%). Application of this method during fruiting body development (7–19 d) revealed that the optimal harvest time for maximum TPC and antioxidant activity was 8 d fruiting age.
Citation: Albert Nugraha, Asadin Briliantama, M Umar Harun, Li Sing-Chung, Chin Xuan Tan, Vuanghao Lim, Amir Husni, Widiastuti Setyaningsih. Ultrasound-assisted extraction of phenolic compounds from ear mushrooms (Auricularia auricula-judae): Assessing composition and antioxidant activity during fruiting body development[J]. AIMS Agriculture and Food, 2024, 9(4): 1134-1150. doi: 10.3934/agrfood.2024059
Auricularia auricula-judae (ear mushroom) exhibits significant biological and pharmacological properties, particularly as an antioxidant due to its phenolic compounds. This study introduces a novel ultrasound-assisted extraction technique to quantify phenolic compounds and assess antioxidant activity in ear mushrooms. Key extraction factors, including solvent-to-sample ratio (10:1, 20:1, 30:1 mL/g), pulse duty cycle (0.2, 0.5, 0.8 s-1), and temperature (10, 35, 60 ℃), were optimized using a Box–Behnken design and response surface methodology (RSM). Methanol was identified as the most effective solvent, yielding the highest total phenolic content (TPC) and antioxidant activity. The optimal conditions for TPC and 2, 2-diphenyl-1-picryl hydrazyl (DPPH) inhibition were determined to be 1 g of sample with 18 mL of methanol at 59 ℃ and a pulse duty cycle of 0.7 s-1. This method achieved a recovery rate of 94.85% for TPC and 92.71% for antioxidant inhibition and was validated with high precision (CV < 5%). Application of this method during fruiting body development (7–19 d) revealed that the optimal harvest time for maximum TPC and antioxidant activity was 8 d fruiting age.

| [1] | Kementrian Pertanian (2020) Budidaya Jamur Punya Potensi Ekspor Tinggi, Permintaan Terus Meningkat, 2020. Available from: https://hortikultura.pertanian.go.id/budidaya-jamur-punya-potensi-ekspor-tinggi-permintaan-terus-meningkat/. |
| [2] | Jamtsho T, Ugyen, Wangchuk P (2023) Auricularia auricula-judae (Bull.): Major bioactive compounds, health benefits, and pharmacological activities. Edible Med Mushrooms Himalayas Clim Chang Crit Endanger Species, Call Sustain Dev, 19–43. http://dx.doi.org/10.1201/9781003259763-2 |
| [3] |
Liu E, Ji Y, Zhang F, et al. (2021) Review on Auricularia auricula-judae as a Functional Food: Growth, Chemical Composition, and Biological Activities. J Agric Food Chem 69: 1739–1750. https://doi.org/10.1021/acs.jafc.0c05934 doi: 10.1021/acs.jafc.0c05934

|
| [4] |
Islam T, Yao F, Kang W, et al. (2022) A systematic study on mycochemical profiles, antioxidant, and anti-inflammatory activities of 30 varieties of Jew's ear (Auricularia auricula-judae). Food Sci Hum Wellness 11: 781–794. https://doi.org/10.1016/j.fshw.2022.03.005 doi: 10.1016/j.fshw.2022.03.005
|
| [5] |
Article R, Xu B, Islam T, et al. (2020) Insights into health-promoting effects of Jew ' s ear (Auricularia auricula-judae). Trends Food Sci Tech 114: 552–569. http://dx.doi.org/10.1016/j.tifs.2021.06.017 doi: 10.1016/j.tifs.2021.06.017
|
| [6] | Kho YS, Vikineswary S, Abdullah N, et al. (2009) Antioxidant capacity of fresh and processed fruit bodies and mycelium of Auricularia auricula-judae (Fr.) quél. J Med Food 12: 167–174. https://doi.org/10.1089/jmf.2007.0568 |
| [7] |
Panthong S, Boonsathorn N, Chuchawankul S (2016) Antioxidant activity, anti-proliferative activity, and amino acid profiles of ethanolic extracts of edible mushrooms. Genet Mol Res 15: 1–14. http://dx.doi.org/10.4238/gmr15048886 doi: 10.4238/gmr15048886
|
| [8] |
Oli AN, Edeh PA, Al-Mosawi RM, et al. (2020) Evaluation of the phytoconstituents of Auricularia auricula-judae mushroom and antimicrobial activity of its protein extract. Eur J Integr Med 38: 101176. https://doi.org/10.1016/j.eujim.2020.101176 doi: 10.1016/j.eujim.2020.101176
|
| [9] |
Zhang Y, Zeng Y, Men Y, et al. (2018) Structural characterization and immunomodulatory activity of exopolysaccharides from submerged culture of Auricularia auricula-judae. Int J Biol Macromol 115: 978–984. https://doi.org/10.1016/j.ijbiomac.2018.04.145 doi: 10.1016/j.ijbiomac.2018.04.145
|
| [10] |
Ganesan K, Xu B (2019) Anti-diabetic effects and mechanisms of dietary polysaccharides. Molecules 24: 2556. https://doi.org/10.3390/molecules24142556 doi: 10.3390/molecules24142556
|
| [11] |
Palacios I, Lozano M, Moro C, et al. (2011) Antioxidant properties of phenolic compounds occurring in edible mushroom. Food Chem 128: 674–678. https://doi.org/10.1016/j.foodchem.2011.03.085 doi: 10.1016/j.foodchem.2011.03.085
|
| [12] |
Wang J, Zhang T, Liu X, et al. (2019) Aqueous extracts of se-enriched Auricularia auricular attenuates D-galactose-induced cognitive deficits, oxidative stress and neuroinflammation via suppressing RAGE/MAPK/NF-κB pathway. Neurosci Lett 704: 106–111. https://doi.org/10.1016/j.neulet.2019.04.002 doi: 10.1016/j.neulet.2019.04.002
|
| [13] | Packialakshmi B, Sudha G, Charumathy M (2015) Total phenol, flavonoid and antioxidant properties of Auricularia auricula-judae. Int J Pharm Pharm Sci 7: 233–237. |
| [14] | Setyaningsih W, Saputro IE, Palma M, et al. (2016) Stability of 40 phenolic compounds during ultrasound-assisted extractions (UAE). AIP Conference Proceedings. https://doi.org/10.1063/1.4958517 |
| [15] | Chemat F, Rombaut N, Sicaire AG, et al. (2017) Ultrasound assisted extraction of food and natural products. Mechanisms, techniques, combinations, protocols and applications. A review. Ultrason Sonochem 34: 540–560. https://doi.org/10.1016/j.ultsonch.2016.06.035 |
| [16] |
Aliaño-González MJ, Barea-Sepúlveda M, Espada-Bellido E, et al. (2022) Ultrasound-assisted extraction of total phenolic compounds and antioxidant activity in mushrooms. Agronomy 12: 1812. https://doi.org/10.3390/agronomy12081812 doi: 10.3390/agronomy12081812
|
| [17] |
Machado-Carvalho L, Martins T, Aires A, et al. (2023) Optimization of phenolic compounds extraction and antioxidant activity from Inonotus hispidus using ultrasound-assisted extraction technology. Metabolites 13: 524. https://doi.org/10.3390/metabo13040524 doi: 10.3390/metabo13040524
|
| [18] |
Xu DP, Zheng J, Zhou Y, et al. (2016) Extraction of natural antioxidants from the Thelephora ganbajun mushroom by an ultrasound-assisted extraction technique and evaluation of antiproliferative activity of the extract against human cancer cells. Int J Mol Sci 17: 1–15. https://doi.org/10.3390/ijms17101664 doi: 10.3390/ijms17101664
|
| [19] |
Briliantama A, Oktaviani NMD, Rahmawati S, et al. (2022) Optimization of Ultrasound-assisted extraction (UAE) for simultaneous determination of individual phenolic compounds in 15 dried edible flowers. Horticulturae 8: 1–13. https://doi.org/10.3390/horticulturae8121216 doi: 10.3390/horticulturae8121216
|
| [20] |
Setyaningsih W, Saputro IE, Palma M, et al. (2017) Optimization of the ultrasound-assisted extraction of tryptophan and its derivatives from rice (Oryza sativa) grains through a response surface methodology. J Cereal Sci 75: 192–197. http://dx.doi.org/10.1016/j.jcs.2017.04.006 doi: 10.1016/j.jcs.2017.04.006
|
| [21] |
Carrera C, Ruiz-Rodríguez A, Palma M, et al. (2012) Ultrasound assisted extraction of phenolic compounds from grapes. Anal Chim Acta 732: 100–104. https://doi.org/10.1016/j.aca.2011.11.032 doi: 10.1016/j.aca.2011.11.032
|
| [22] | Berger PD, Maurer RE, Celli GB (2018) Experimental design: With applications in management, engineering, and the sciences: Second edition. Experimental Design: With Applications in Management, Engineering and the Sciences, Cham, Springer International Publishing, 1–639. http://dx.doi.org/10.1007/978-3-319-64583-4 |
| [23] |
Brand-Williams W, Cuvelier ME, Berset C (1995) Use of a free radical method to evaluate antioxidant activity. LWT-Food Sci Technol 28: 25–30. https://doi.org/10.1016/S0023-6438(95)80008-5 doi: 10.1016/S0023-6438(95)80008-5
|
| [24] |
Bao H, Zhou R, You S, et al. (2017) Gelation mechanism of polysaccharides from Auricularia auricula-judae. Food Hydrocoll 76: 35–41. http://dx.doi.org/10.1016/j.foodhyd.2017.07.023 doi: 10.1016/j.foodhyd.2017.07.023
|
| [25] |
Kalitukha L, Bleha R, Synytsya A, et al. (2023) Hydrocolloids from the mushroom Auricularia heimuer: Composition and properties. J fungi (Basel, Switzerland) 9: 1–17. https://doi.org/10.3390/jof9060681 doi: 10.3390/jof9060681
|
| [26] |
Altemimi A, Lakhssassi N, Baharlouei A, et al. (2017) Phytochemicals: Extraction, isolation, and identification of bioactive compounds from plant extracts. Plants (Basel, Switzerland) 6: 42. https://doi.org/10.3390/plants6040042 doi: 10.3390/plants6040042
|
| [27] | Begum SN, Hossain M, Adnan M, et al. (2023) Optimization and characterization of phenolic extraction conditions and antioxidant activity evaluation of Adenanthera pavonina L. bark. Plants 12: 1–18. https://doi.org/10.3390/plants12223902 |
| [28] | Loganayaki N, Siddhuraju P, Manian S (2013) Antioxidant activity and free radical scavenging capacity of phenolic extracts from Helicteres isora L. and Ceiba pentandra L. J Food Sci Technol 50: 687–695. https://doi.org/10.1007/s13197-011-0389-x |
| [29] |
Kobus Z, Krzywicka M, Pecyna A, et al. (2021) Process efficiency and energy consumption during the ultrasound-assisted extraction of bioactive substances from hawthorn berries. Energies 14: 42. https://doi.org/10.3390/en14227638 doi: 10.3390/en14227638
|
| [30] |
Shen L, Pang S, Zhong M, et al. (2023) A comprehensive review of Ultrasonic Assisted Extraction (UAE) for bioactive components: Principles, advantages, equipment, and combined technologies. Ultrason Sonochem 101: 106646. https://doi.org/10.1016/j.ultsonch.2023.106646 doi: 10.1016/j.ultsonch.2023.106646
|
| [31] |
Qiu L, Zhang M, Chitrakar B, et al. (2020) Application of power ultrasound in freezing and thawing Processes: Effect on process efficiency and product quality. Ultrason Sonochem 68: 105230. https://doi.org/10.1016/j.ultsonch.2020.105230 doi: 10.1016/j.ultsonch.2020.105230
|
| [32] |
Wen C, Zhang J, Zhang H, et al. (2018) Advances in ultrasound assisted extraction of bioactive compounds from cash crops—A review. Ultrason Sonochem 48: 538–549. https://doi.org/10.1016/j.ultsonch.2018.07.018 doi: 10.1016/j.ultsonch.2018.07.018
|
| [33] |
Antony A, Farid M (2022) Effect of temperatures on polyphenols during extraction. Appl Sci 12: 2107. https://doi.org/10.3390/app12042107 doi: 10.3390/app12042107
|
| [34] |
Zhang QW, Lin LG, Ye WC (2018) Techniques for extraction and isolation of natural products: A comprehensive review. Chinese Med (United Kingdom) 13: 1–26. https://doi.org/10.1186/s13020-018-0177-x doi: 10.1186/s13020-018-0177-x
|
| [35] |
Chaves JO, de Souza MC, da Silva LC, et al. (2020) Extraction of flavonoids from natural sources using modern techniques. Front Chem 8: 1–25. https://doi.org/10.3389/fchem.2020.507887 doi: 10.3389/fchem.2020.507887
|
| [36] |
Nicoli MC, Anese M, Parpinel M (1999) Influence of processing on the antioxidant properties of fruit and vegetables. Trends Food Sci Technol 10: 94–100. https://doi.org/10.1016/S0924-2244(99)00023-0 doi: 10.1016/S0924-2244(99)00023-0
|
| [37] |
Sharma K, Ko EY, Assefa AD, et al. (2015) Temperature-dependent studies on the total phenolics, flavonoids, antioxidant activities, and sugar content in six onion varieties. J Food Drug Anal 23: 243–252. http://dx.doi.org/10.1016/j.jfda.2014.10.005 doi: 10.1016/j.jfda.2014.10.005
|
| [38] |
Gebreyohannes G, Nyerere A, Bii C, et al. (2019) Investigation of antioxidant and antimicrobial activities of different extracts of Auricularia and Termitomyces species of mushrooms. Sci World J 2019: 1–10. https://doi.org/10.1155/2019/7357048 doi: 10.1155/2019/7357048
|
| [39] | AOAC (2016) Guidelines for Standard Method Performance Requirements. |
| [40] | Bernal-Gallardo JO, Molina-Torres J, Angoa-Pérez M V., et al. (2022) Phenolic compound content and the antioxidant and antimicrobial activity of wild blueberries (Vaccinium stenophyllum steud.) fruits extracts during ripening. Horticulturae 8: 15. https://doi.org/10.3390/horticulturae8010015 |
| [41] |
Gbotognon O, Kouadio T, Djè K, et al. (2022) Effects of maturity stage on the antioxidant components levels and antioxidant properties of three edible mushroom species of genus Russula from Côte d'Ivoire. Mushroom Res 31: 123–138. https://doi.org/10.36036/MR.31.2.2022.129573 doi: 10.36036/MR.31.2.2022.129573
|
| [42] |
Ahlawat YK, Singh M, Manorama K, et al. (2023) Plant phenolics: neglected secondary metabolites in plant stress tolerance. Rev Bras Bot 47: 703-721. https://doi.org/10.1007/s40415-023-00949-x doi: 10.1007/s40415-023-00949-x
|
| [43] | Gai F, Janiak MA, Sulewska K, et al. (2023) Phenolic compound profile and antioxidant capacity of flax (Linum usitatissimum L.) harvested at different growth stages. Molecules 28: 1–15. https://doi.org/10.3390/molecules28041807 |


Figures(6) / Tables(2)

Albert Nugraha, Asadin Briliantama, M Umar Harun, Li Sing-Chung, Chin Xuan Tan, Vuanghao Lim, Amir Husni, Widiastuti Setyaningsih. Ultrasound-assisted extraction of phenolic compounds from ear mushrooms (Auricularia auricula-judae): Assessing composition and antioxidant activity during fruiting body development[J]. AIMS Agriculture and Food, 2024, 9(4): 1134-1150. doi: 10.3934/agrfood.2024059


 DownLoad: