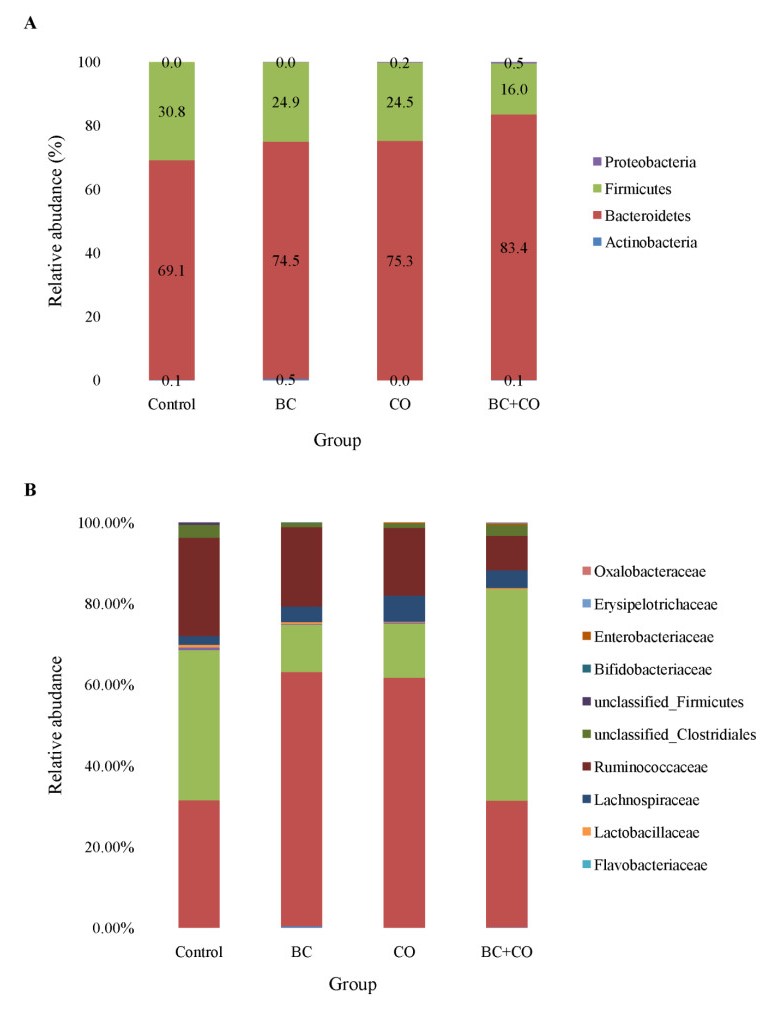
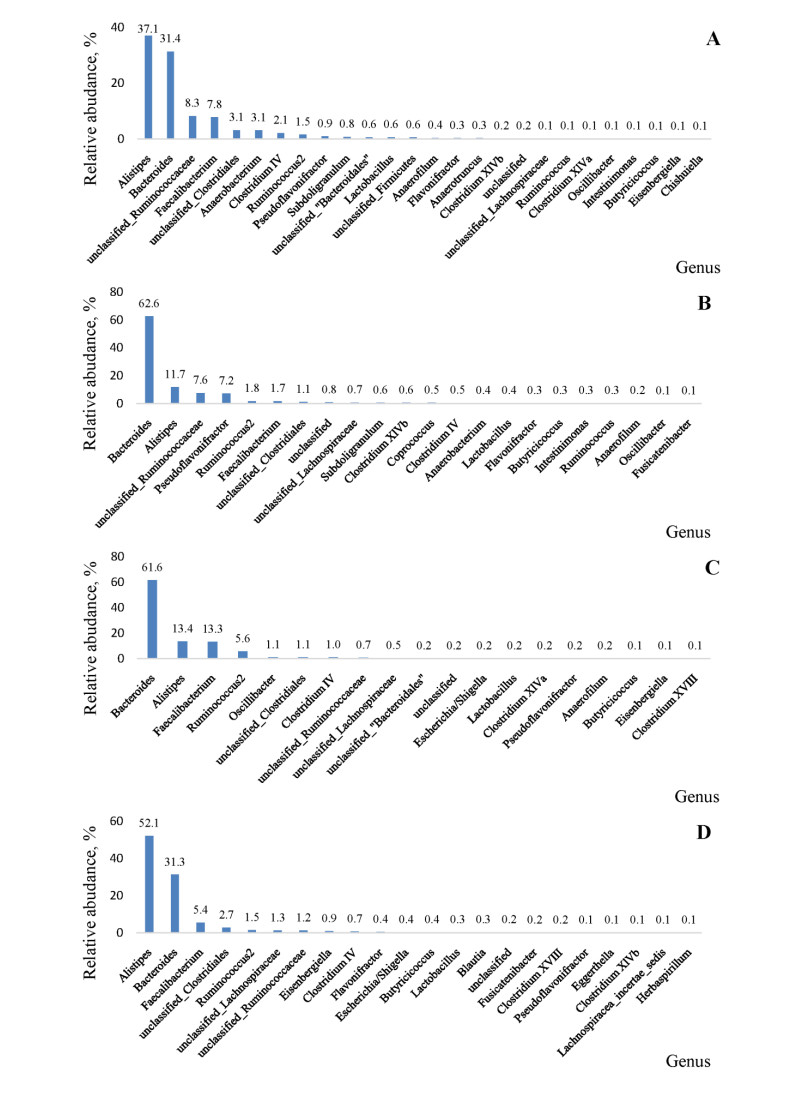
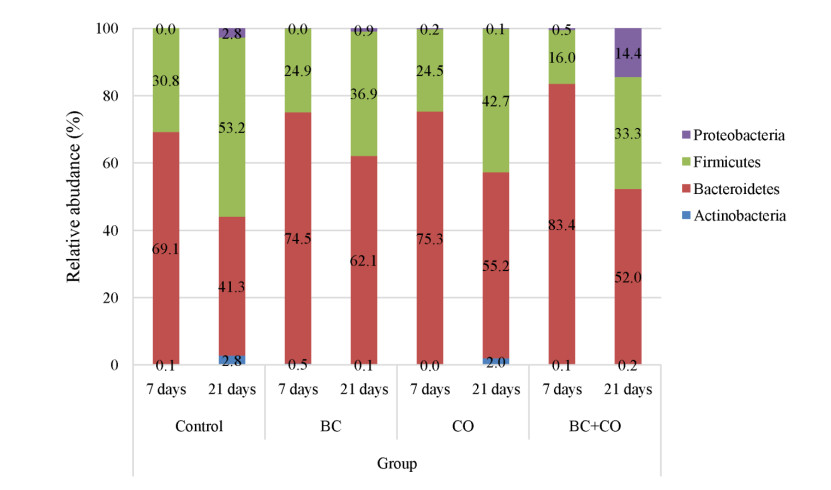
The aim of the study was to evaluate the effect of coumarin and Bacillus cereus derivatives on the productivity and ecology of the caecum of broilers. Assessment of phytochemicals and their synergistic effect with probiotics on the ecological state of individual organs and systems of the body of animals is important for increasing their productivity. The need to address these problems provides sufficient motivation to expand the search for new antimicrobial products. According to the research results, the activity of cellular biomasses to suppress quorum sensing (QS) (Chromobacterium violaceum 026) in Bacillus cereus and a coumarin derivative was revealed. In experiments on animals, i.e. broiler chickens (4 groups, n = 30). Control group: had basic diet (BD); I experimental: was fed with BD + Bacillus cereus probiotic (BC); II experimental: BD + coumarin (CO); III experimental: BD + Bacillus cereus + coumarin (BC + CO). Metagenomic analysis of the bacterial profile of the cecum contents showed the prevalence of representatives of Bacteroidetes phylum in the experimental groups (4.5–15.2%) at 14 days of age, and a decrease in the percentage of Firmicutes phylum (5.9–14.8%), the dominance of Bacteroidaceae families was noted. On the 21st day, a similar increase in representatives of Bacteroidetes phylum (1.7–20.8%), a decrease in Firmicutes and Proteobacteria were noted. At the family level, there is a quantitative change in the microbiome, both in comparison with the control, and with similar data obtained on the 7th day of the experiment. The vast majority belonged to representatives of Bacteroidetes phylum, an increase in bacteria belonging to Firmicutes and Proteobacteria was observed, Rikenellaceae and Ruminococcaceae were minor families. Thus, the additional introduction of Bacillus cereus and a coumarin derivative into the diet of broilers improved the growth parameters and the structure of the intestines of broilers; a positive synergistic effect of Bacillus cereus and coumarin in maintaining the microecological balance of the intestines in poultry was noted.
Citation: Galimzhan Duskaev, Olga Kvan, Dianna Kosyan, Shamil Rakhmatullin, Georgii Levakhin. Coumarin derivative and Bacillus cereus change live weight and cecal ecology in broilers[J]. AIMS Agriculture and Food, 2021, 6(1): 360-380. doi: 10.3934/agrfood.2021022
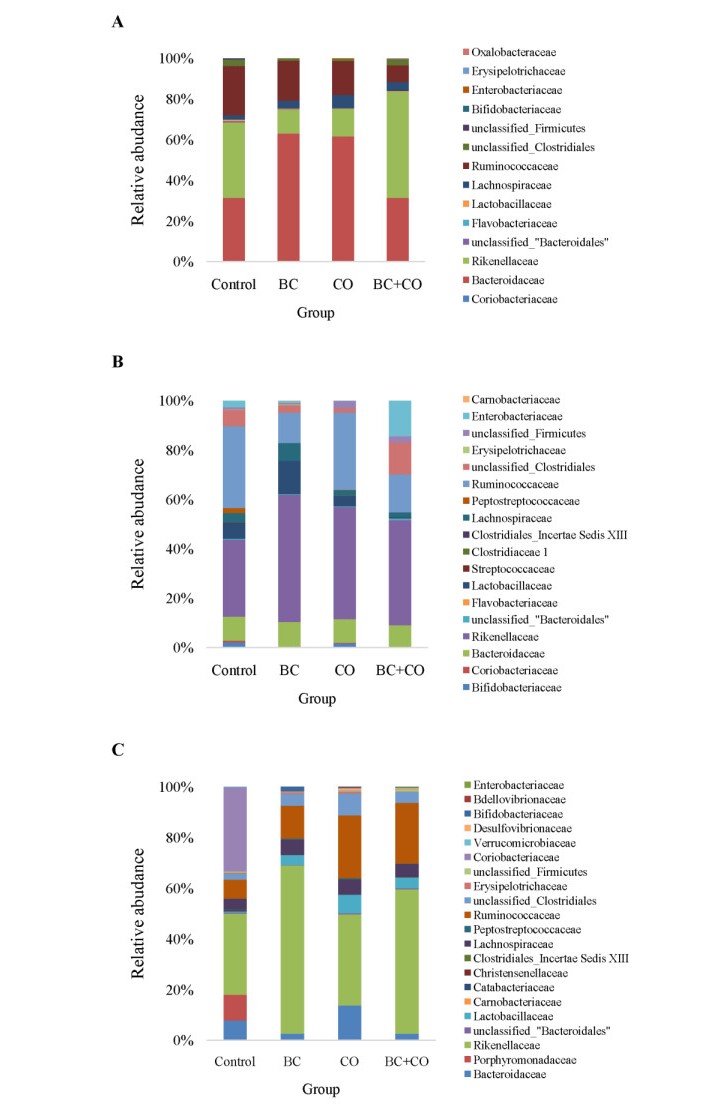
The aim of the study was to evaluate the effect of coumarin and Bacillus cereus derivatives on the productivity and ecology of the caecum of broilers. Assessment of phytochemicals and their synergistic effect with probiotics on the ecological state of individual organs and systems of the body of animals is important for increasing their productivity. The need to address these problems provides sufficient motivation to expand the search for new antimicrobial products. According to the research results, the activity of cellular biomasses to suppress quorum sensing (QS) (Chromobacterium violaceum 026) in Bacillus cereus and a coumarin derivative was revealed. In experiments on animals, i.e. broiler chickens (4 groups, n = 30). Control group: had basic diet (BD); I experimental: was fed with BD + Bacillus cereus probiotic (BC); II experimental: BD + coumarin (CO); III experimental: BD + Bacillus cereus + coumarin (BC + CO). Metagenomic analysis of the bacterial profile of the cecum contents showed the prevalence of representatives of Bacteroidetes phylum in the experimental groups (4.5–15.2%) at 14 days of age, and a decrease in the percentage of Firmicutes phylum (5.9–14.8%), the dominance of Bacteroidaceae families was noted. On the 21st day, a similar increase in representatives of Bacteroidetes phylum (1.7–20.8%), a decrease in Firmicutes and Proteobacteria were noted. At the family level, there is a quantitative change in the microbiome, both in comparison with the control, and with similar data obtained on the 7th day of the experiment. The vast majority belonged to representatives of Bacteroidetes phylum, an increase in bacteria belonging to Firmicutes and Proteobacteria was observed, Rikenellaceae and Ruminococcaceae were minor families. Thus, the additional introduction of Bacillus cereus and a coumarin derivative into the diet of broilers improved the growth parameters and the structure of the intestines of broilers; a positive synergistic effect of Bacillus cereus and coumarin in maintaining the microecological balance of the intestines in poultry was noted.

| [1] | Hoelzer K, Wong N, Thomas J, et al. (2017) Antimicrobial drug use in food-producing animals and associated human health risks: what, and how strong, is the evidence? BMC Vet Res 13: 211. |
| [2] | Betts JW, Hornsey M, La Ragione RM (2018) Novel Antibacterials: Alternatives to Traditional Antibiotics. Adv Microb Physiol 123–169. |
| [3] |
Romulo A, Ea Z, Rondevaldova J, et al. (2020) Screening of in vitro antimicrobial activity of plants used in traditional Indonesian medicine. Pharm Biol 56: 287–293. doi: 10.1080/13880209.2018.1462834

|
| [4] | Icdo R, Ega M, Rt C, et al. (2018) Plants Of The Cerrado With Antimicrobial Effects Against Staphylococcus Spp. And Escherichia coli From Cattle. BMC Vet Res 14: 32. |
| [5] |
Oo O, Pa S, Ps F (2018) Antimicrobial and antiprotozoal activities of twenty-four Nigerian medicinal plant extracts. S Afr J Bot 117: 240–246. doi: 10.1016/j.sajb.2018.05.028
|
| [6] |
Allevato DM, Groppo M, Kiyota E, et al. (2019) Evolution of phytochemical diversity in Pilocarpus (Rutaceae). Phytochemistry 163: 132–146. doi: 10.1016/j.phytochem.2019.03.027
|
| [7] |
Hijazin T, Radwan A, Abouzeid S, et al. (2019) Uptake and modification of umbelliferone by various seedlings. Phytochemistry 157: 194–199. doi: 10.1016/j.phytochem.2018.10.032
|
| [8] |
Yahyazadeh M, Nowak M, Kima H, et al. (2017) Horizontal natural product transfer: A potential source of alkaloidal contaminants in phytopharmaceuticals. Phytomedicine 34: 21–25. doi: 10.1016/j.phymed.2017.07.007
|
| [9] |
He R, Zhang Y, Wu L, et al. (2017) Benzofuran glycosides and coumarins from the bark of Streblus indicus (Bur.) Corner Phytochemistry 138: 170–177. doi: 10.1016/j.phytochem.2017.01.011
|
| [10] |
Tuan Anh HL, Kim DC, Ko W, et al. (2017) Anti-inflammatory coumarins from Paramignya trimera. Pharm Biol 55: 1195–1201. doi: 10.1080/13880209.2017.1296001
|
| [11] | Deryabin D, Galadzhieva A, Kosyan D, et al. (2019) Plant-Derived Inhibitors of AHL-Mediated Quorum Sensing in Bacteria: Modes of Action. Int J Mol Sci 8: 20–22. |
| [12] |
Yang L, Wu L, Yao X, et al. (2018) Hydroxycoumarins: New, effective plant-derived compounds reduce Ralstonia pseudosolanacearum populations and control tobacco bacterial wilt. Microbiol Res 215: 15–21. doi: 10.1016/j.micres.2018.05.011
|
| [13] |
Zhang Y, Sass A, Van Acker H, et al. (2018) Coumarin Reduces Virulence and Biofilm Formation in Pseudomonas aeruginosa by Affecting Quorum Sensing, Type III Secretion and C-di-GMP Levels. Front Microbiol 21: 1952. doi: 10.3389/fmicb.2018.01952
|
| [14] |
D'Almeida RE, Molina RDI, Viola CM, et al. (2017) Comparison of seven structurally related coumarins on the inhibition of Quorum sensing of Pseudomonas aeruginosa and Chromobacterium violaceum. Bioorg Chem 73: 37–42. doi: 10.1016/j.bioorg.2017.05.011
|
| [15] |
Zhang S, Liu N, Liang W, et al. (2017) Quorum sensing-disrupting coumarin suppressing virulence phenotypes in Vibrio splendidus. Appl Microbiol Biotechnol 101: 3371–3378. doi: 10.1007/s00253-016-8009-3
|
| [16] |
Reen FJ, Gutiérrez-Barranquero JA, Parages ML, et al. (2018) Coumarin: a novel player in microbial quorum sensing and biofilm formation inhibition. Appl Microbiol Biotechnol 102: 2063–2073. doi: 10.1007/s00253-018-8787-x
|
| [17] |
Yasser FM, Moath AN, Zena ST (2018) Coumarins from Creston Apple Seeds: Isolation, Chemical Modification and Cytotoxicity Study. J App Pharm Sci 8: 49–56. doi: 10.7324/JAPS.2018.8908
|
| [18] |
Abdel-Latif MS, Elmeleigy KM, Aly TAA, et al. (2017) Pathological and biochemical evaluation of coumarin and chlorophyllin against aflatoxicosis in rat. Exp Toxicol Pathol 69: 285–291. doi: 10.1016/j.etp.2017.01.014
|
| [19] |
Hassan AA, Abu HSH, Elghandour MMY, et al. (2019) Dietary Supplementation with sodium bentonite and coumarin alleviates the toxicity of aflatoxin B1 in rabbits. Toxicon 171: 35–42. doi: 10.1016/j.toxicon.2019.09.014
|
| [20] |
Mahmoud AM, Hozayen WG, Hasan IH, et al. (2019) Umbelliferone Ameliorates CCl4-Induced Liver Fibrosis in Rats by Upregulating PPARγ and Attenuating Oxidative Stress, Inflammation, and TGF-β1/Smad3 Signaling. Inflammation 42: 1103–1116. doi: 10.1007/s10753-019-00973-8
|
| [21] | European Commission Health & Consumer Protection Directorate-General (2000) Directorate B - scientific health opinions unit. B3 - management of scientific committees II. Opinion of the scientific committee on animal nutrition on the safety of use of bacillus species in animal nutrition, p 18. |
| [22] |
Mietke H, Beer W, Schleif J, et al. (2010) Differentiation between probiotic and wild-type Bacillus cereus isolates by antibiotic susceptibility test and Fourier transform infrared spectroscopy (FT-IR). Int J Food Microbiol 140: 57–60. doi: 10.1016/j.ijfoodmicro.2010.02.009
|
| [23] |
Mingmongkolchai S, Panbangred W (2018) Bacillus probiotics: an alternative to antibiotics for livestock production. J Appl Microbiol 124: 1334–1346. doi: 10.1111/jam.13690
|
| [24] |
Jeong JS, Kim IH (2014) Effect of Bacillus subtilis C‐3102 spores as a probiotic feed supplement on growth performance, noxious gas emission, and intestinal microflora in broilers. Poult Sci 93: 3097–3103. doi: 10.3382/ps.2014-04086
|
| [25] |
Guyard‐Nicodème M, Keita A, Quesne S, et al. (2016) Efficacy of feed additives against Campylobacter in live broilers during the entire rearing period. Poult Sci 95: 298–305. doi: 10.3382/ps/pev303
|
| [26] |
Knap I, Kehlet A, Bennedsen M, et al. (2011) Bacillus subtilis (DSM17299) significantly reduces Salmonella in broilers. Poult Sci 90:1690–1694. doi: 10.3382/ps.2010-01056
|
| [27] |
Latorre JD, Hernandez‐Velasco X, Bielke L, et al. (2015) Evaluation of a Bacillus direct‐fed microbial candidate on digesta viscosity, bacterial translocation, microbiota composition and bone mineralisation in broiler chickens fed on a rye‐based diet. Br Poult Sci 56: 723–732. doi: 10.1080/00071668.2015.1101053
|
| [28] |
Redman MG, Ward EJ, Phillips RS (2014) The efficacy and safety of probiotics in people with cancer: a systematic review. Ann Oncol 25: 1919–1929. doi: 10.1093/annonc/mdu106
|
| [29] |
Alkaya B, Laleman I, Keceli S, et al. (2017) Clinical effects of probiotics containing Bacillus species on gingivitis: a pilot randomized controlled trial. J Periodontal Res 52: 497–504. doi: 10.1111/jre.12415
|
| [30] | Lopetuso LR, Scaldaferri F, Franceschi F, et al. (2016) Bacillus clausii and gut homeostasis: state of the art and future perspectives. Expert Rev Gastroenterol Hepatol 10: 943–948. |
| [31] |
Candela M, Vitali B, Matteuzzi D, et al. (2004) Evaluation of the run operon copy number in Bifidobacterium using real-time PCR. Lett Appl Microbiol 38: 229–232. doi: 10.1111/j.1472-765X.2003.01475.x
|
| [32] |
Duskaev GK, Rakhmatullin SG, Kazachkova NM, et al. (2018) Effect of the combined action of Quercus cortex extract and probiotic substances on the immunity and productivity of broiler chickens. Vet World 11: 1416–1422. doi: 10.14202/vetworld.2018.1416-1422
|
| [33] |
Crhanova M, Karasova D, Juricova H, et al. (2019) Systematic Culturomics Shows that Half of Chicken Caecal Microbiota Members can be Grown in Vitro Except for Two Lineages of Clostridiales and a Single Lineage of Bacteroidetes. Microorganisms 7: 496. doi: 10.3390/microorganisms7110496
|
| [34] |
Petrovic V, Marcincak S, Popelka P, et al. (2012) The effect of supplementation of clove and agrimony or clove and lemon balm on growth performance, antioxidant status and selected indices of lipid profile of broiler chickens. J Anim Physiol Anim Nutr (Berl) 96: 970–977. doi: 10.1111/j.1439-0396.2011.01207.x
|
| [35] |
Lu J, Idris U, Harmon B, et al. (2003) Diversity and succession of the intestinal bacterial community of the maturing broiler chicken. Appl Environ Micr 69: 6816–6824. doi: 10.1128/AEM.69.11.6816-6824.2003
|
| [36] |
Eeckhaut V, Wang J, Van Parys A, et al. (2016) The Probiotic Butyricicoccus pullicaecorum Reduces Feed Conversion and Protects from Potentially Harmful Intestinal Microorganisms and Necrotic Enteritis in Broilers. Front Microbiol 7: 1416. doi: 10.3389/fmicb.2016.01416
|
| [37] |
Waqas M, Wang Y, Li A, et al. (2019) Osthole: A Coumarin Derivative Assuage Thiram-Induced Tibial Dyschondroplasia by Regulating BMP-2 and RUNX-2 Expressions in Chickens. Antioxidants (Basel) 8: 330. doi: 10.3390/antiox8090330
|
| [38] |
Kohl KD (2012) Diversity and function of the avian gut microbiota. J Compar Physiol Biochem Syst Environ Physiol 182: 591–602. doi: 10.1007/s00360-012-0645-z
|
| [39] |
Kubasova T, Kollarcikova M, Crhanova M, (2019) Gut anaerobes capable of chicken caecum colonisation. Microorganisms 7: 597. doi: 10.3390/microorganisms7120597
|
| [40] |
Magoc T, Salzberg SL (2011) FLASH: fast length adjustment of short reads to improve genome assemblies. Bioinformatics 27: 2957–2963. doi: 10.1093/bioinformatics/btr507
|
| [41] |
Wei S, Morrison M, Yu Z (2013) Bacterial census of poultry intestinal microbiome. Poult Sci Sympos 92: 671–683. doi: 10.3382/ps.2012-02822
|
| [42] |
Shang Y, Kumar S, Oakley B, et al. (2018) Chicken Gut Microbiota: Importance and Detection Technology. Front Vet Sci 5: 254. doi: 10.3389/fvets.2018.00254
|
| [43] |
Pan D, Yu Z (2014) Intestinal microbiome of poultry and its interaction with host and diet. Gut Microbes 5: 108–119. doi: 10.4161/gmic.26945
|
| [44] |
Oakley BB, Lillehoj HS, Kogut MH, et al. (2014) The chicken gastrointestinal microbiome. FEMS Microbiol Lett 360: 100–112. doi: 10.1111/1574-6968.12608
|
| [45] |
Rychlik I (2020) Composition and Function of Chicken Gut Microbiota. Animals 10: 103. doi: 10.3390/ani10010103
|
| [46] |
Nordentoft S, Molbak L, Bjerrum L, et al. (2011) The influence of the cage system and colonisation of Salmonella Enteritidis on the microbial gut flora of laying hens studied by T-RFLP and 454 pyrosequencing. BMC Microbiol 11: 187. doi: 10.1186/1471-2180-11-187
|
| [47] |
Medvecky M, Cejkova D, Polansky O, et al. (2018) Whole genome sequencing and function prediction of 133 gut anaerobes isolated from chicken caecum in pure cultures. BMC Genom 19: 561. doi: 10.1186/s12864-018-4959-4
|
| [48] |
Shaufi MA, Sieo CC, Chong CW, et al. (2015) Deciphering chicken gut microbial dynamics based on high-throughput 16S rRNA metagenomics analyses. Gut Pathol 7: 4. doi: 10.1186/s13099-015-0051-7
|
| [49] |
Videnska P, Sedlar K, Lukac M, et al. (2014) Succession and replacement of bacterial populations in the caecum of egg laying hens over their whole life. PLoS One 9: e115142. doi: 10.1371/journal.pone.0115142
|
Figures(5) / Tables(6)

Galimzhan Duskaev, Olga Kvan, Dianna Kosyan, Shamil Rakhmatullin, Georgii Levakhin. Coumarin derivative and Bacillus cereus change live weight and cecal ecology in broilers[J]. AIMS Agriculture and Food, 2021, 6(1): 360-380. doi: 10.3934/agrfood.2021022


 DownLoad: