This paper presents a comprehensive study aimed at understanding the dynamics of single-vehicle and multi-vehicle crashes through a binary classification approach. By harnessing high-resolution, multi-source data, including high-resolution traffic profile data captured by weigh-in-motion stations, weather conditions, roadway attributes, and pavement properties, we delved into distinctive characteristics of the two crash types. Particularly, a meticulous data fusion approach was applied to integrate the diverse data sources, enabling a holistic investigation of influential factors. Framing it as a classification task, key factors differentiating between single-vehicle and multi-vehicle crashes were identified. The results of the study provide valuable insights into the underlying mechanisms of the two distinct crash types, supporting the development of targeted safety measures.
Citation: Hao Zhen, Oscar Lares, Jeffrey Cooper Fortson, Jidong J. Yang, Wei Li, Eric Conklin. Unraveling the dynamics of single-vehicle versus multi-vehicle crashes: a comparative analysis through binary classification[J]. Applied Computing and Intelligence, 2024, 4(2): 349-369. doi: 10.3934/aci.2024020
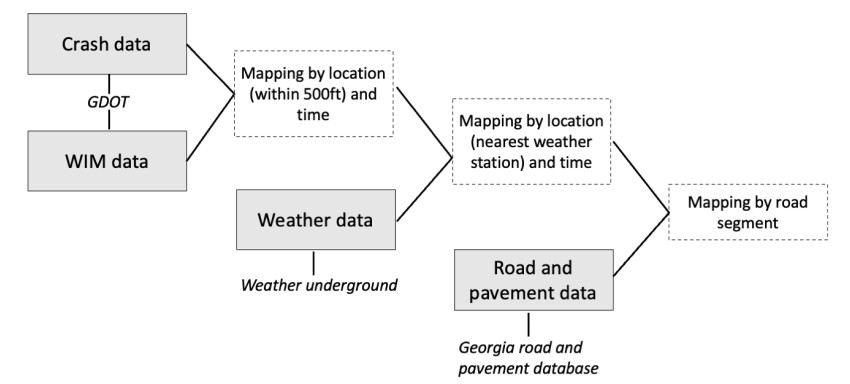
This paper presents a comprehensive study aimed at understanding the dynamics of single-vehicle and multi-vehicle crashes through a binary classification approach. By harnessing high-resolution, multi-source data, including high-resolution traffic profile data captured by weigh-in-motion stations, weather conditions, roadway attributes, and pavement properties, we delved into distinctive characteristics of the two crash types. Particularly, a meticulous data fusion approach was applied to integrate the diverse data sources, enabling a holistic investigation of influential factors. Framing it as a classification task, key factors differentiating between single-vehicle and multi-vehicle crashes were identified. The results of the study provide valuable insights into the underlying mechanisms of the two distinct crash types, supporting the development of targeted safety measures.

| [1] |
M. Abdel-Aty, N. Uddin, A. Pande, Split models for predicting multivehicle crashes during high-speed and low-speed operating conditions on freeways, Transport. Res. Rec., 1908 (2005), 51–58. https://doi.org/10.1177/0361198105190800107 doi: 10.1177/0361198105190800107

|
| [2] | Federal Highway Administration, Highway statistics series: motor vehicle registrations, Office of Highway Policy Information, 2022. Available from: https://www.fhwa.dot.gov/policyinformation/statistics/2022/mv1.cfm. |
| [3] |
M. Ahmed, M. Abdel-Aty, R. Yu, Assessment of interaction of crash occurrence, mountainous freeway geometry, real-time weather, and traffic data, Transport. Res. Rec., 2280 (2012), 51–59. https://doi.org/10.3141/2280-06 doi: 10.3141/2280-06
|
| [4] |
M. Ahmed, R. Franke, K. Ksaibati, D. Shinstine, Effects of truck traffic on crash injury severity on rural highways in wyoming using bayesian binary logit models, Accident Anal. Prev., 117 (2018), 106–113. https://doi.org/10.1016/j.aap.2018.04.011 doi: 10.1016/j.aap.2018.04.011
|
| [5] |
N. Al-Bdairi, S. Hernandez, An empirical analysis of run-off-road injury severity crashes involving large trucks, Accident Anal. Prev., 102 (2017), 93–100. https://doi.org/10.1016/j.aap.2017.02.024 doi: 10.1016/j.aap.2017.02.024
|
| [6] |
F. Basso, L. Basso, F. Bravo, R. Pezoa, Real-time crash prediction in an urban expressway using disaggregated data, Transport. Res. C-Emer., 86 (2018), 202–219. https://doi.org/10.1016/j.trc.2017.11.014 doi: 10.1016/j.trc.2017.11.014
|
| [7] |
N. Becker, H. Rust, U. Ulbrich, Weather impacts on various types of road crashes: a quantitative analysis using generalized additive models, Eur. Transp. Res. Rev., 14 (2022), 37. https://doi.org/10.1186/s12544-022-00561-2 doi: 10.1186/s12544-022-00561-2
|
| [8] |
Z. Christoforou, S. Cohen, M. Karlaftis, Vehicle occupant injury severity on highways: an empirical investigation, Accident Anal. Prev., 42 (2010), 1606–1620. https://doi.org/10.1016/j.aap.2010.03.019 doi: 10.1016/j.aap.2010.03.019
|
| [9] |
B. Dong, X. Ma, F. Chen, S. Chen, Investigating the differences of single-vehicle and multivehicle accident probability using mixed logit model, J. Adv. Transport., 2018 (2018), 2702360. https://doi.org/10.1155/2018/2702360 doi: 10.1155/2018/2702360
|
| [10] |
S. Geedipally, D. Lord, Investigating the effect of modeling single-vehicle and multi-vehicle crashes separately on confidence intervals of poisson–-gamma models, Accident Anal. Prev., 42 (2010), 1273–1282. https://doi.org/10.1016/j.aap.2010.02.004 doi: 10.1016/j.aap.2010.02.004
|
| [11] |
S. Islam, S. Jones, D. Dye, Comprehensive analysis of single-and multi-vehicle large truck at-fault crashes on rural and urban roadways in alabama, Accident Anal. Prev., 67 (2014), 148–158. https://doi.org/10.1016/j.aap.2014.02.014 doi: 10.1016/j.aap.2014.02.014
|
| [12] |
C. Morris, J. Yang, Effectiveness of resampling methods in coping with imbalanced crash data: crash type analysis and predictive modeling, Accident Anal. Prev., 159 (2021), 106240. https://doi.org/10.1016/j.aap.2021.106240 doi: 10.1016/j.aap.2021.106240
|
| [13] |
B. Naik, L. Tung, S. Zhao, A. Khattak, Weather impacts on single-vehicle truck crash injury severity, J. Safety Res., 58 (2016), 57–65. https://doi.org/10.1016/j.jsr.2016.06.005 doi: 10.1016/j.jsr.2016.06.005
|
| [14] | National highway traffic safety administration, Early estimate of motor vehicle traffic fatalities in 2023, National Highway Traffic Safety Administration (NHTSA), 2023. Available from: https://crashstats.nhtsa.dot.gov/Api/Public/ViewPublication/813561. |
| [15] |
M. Uddin, N. Huynh, Injury severity analysis of truck-involved crashes under different weather conditions, Accident Anal. Prev., 141 (2020), 105529. https://doi.org/10.1016/j.aap.2020.105529 doi: 10.1016/j.aap.2020.105529
|
| [16] | Weather Underground, Wundermap weather information, Weather Data APIs, 2023. Available from: https://www.wunderground.com/wundermap?lat=33.751&lon=-84.39. |
| [17] |
D. Viano, C. Culver, L. Evans, M. Frick, R. Scott, Involvement of older drivers in multivehicle side-impact crashes, Accident Anal. Prev., 22 (1990), 177–188. https://doi.org/10.1016/0001-4575(90)90068-V doi: 10.1016/0001-4575(90)90068-V
|
| [18] |
X. Wang, M. Feng, Freeway single and multi-vehicle crash safety analysis: influencing factors and hotspots, Accident Anal. Prev., 132 (2019), 105268. https://doi.org/10.1016/j.aap.2019.105268 doi: 10.1016/j.aap.2019.105268
|
| [19] |
Q. Wu, F. Chen, G. Zhang, X. Liu, H. Wang, S. Bogus, Mixed logit model-based driver injury severity investigations in single-and multi-vehicle crashes on rural two-lane highways, Accident Anal. Prev., 72 (2014), 105–115. https://doi.org/10.1016/j.aap.2014.06.014 doi: 10.1016/j.aap.2014.06.014
|
| [20] |
K. Xie, K. Ozbay, H. Yang, A multivariate spatial approach to model crash counts by injury severity, Accident Anal. Prev., 122 (2019), 189–198. https://doi.org/10.1016/j.aap.2018.10.009 doi: 10.1016/j.aap.2018.10.009
|
| [21] |
C. Xu, W. Wang, P. Liu, Identifying crash-prone traffic conditions under different weather on freeways, J. Safety Res., 46 (2013), 135–144. https://doi.org/10.1016/j.jsr.2013.04.007 doi: 10.1016/j.jsr.2013.04.007
|
| [22] |
C. Xu, K. Ozbay, H. Liu, K. Xie, D. Yang, Exploring the impact of truck traffic on road segment-based severe crash proportion using extensive weigh-in-motion data, Safety Sci., 166 (2023), 106261. https://doi.org/10.1016/j.ssci.2023.106261 doi: 10.1016/j.ssci.2023.106261
|
| [23] |
Q. Zeng, W. Hao, J. Lee, F. Chen, Investigating the impacts of real-time weather conditions on freeway crash severity: a bayesian spatial analysis, Int. J. Environ. Res. Public Health, 17 (2020), 2768. https://doi.org/10.3390/ijerph17082768 doi: 10.3390/ijerph17082768
|


Figures(15) / Tables(4)
Hao Zhen, Oscar Lares, Jeffrey Cooper Fortson, Jidong J. Yang, Wei Li, Eric Conklin. Unraveling the dynamics of single-vehicle versus multi-vehicle crashes: a comparative analysis through binary classification[J]. Applied Computing and Intelligence, 2024, 4(2): 349-369. doi: 10.3934/aci.2024020


 DownLoad: