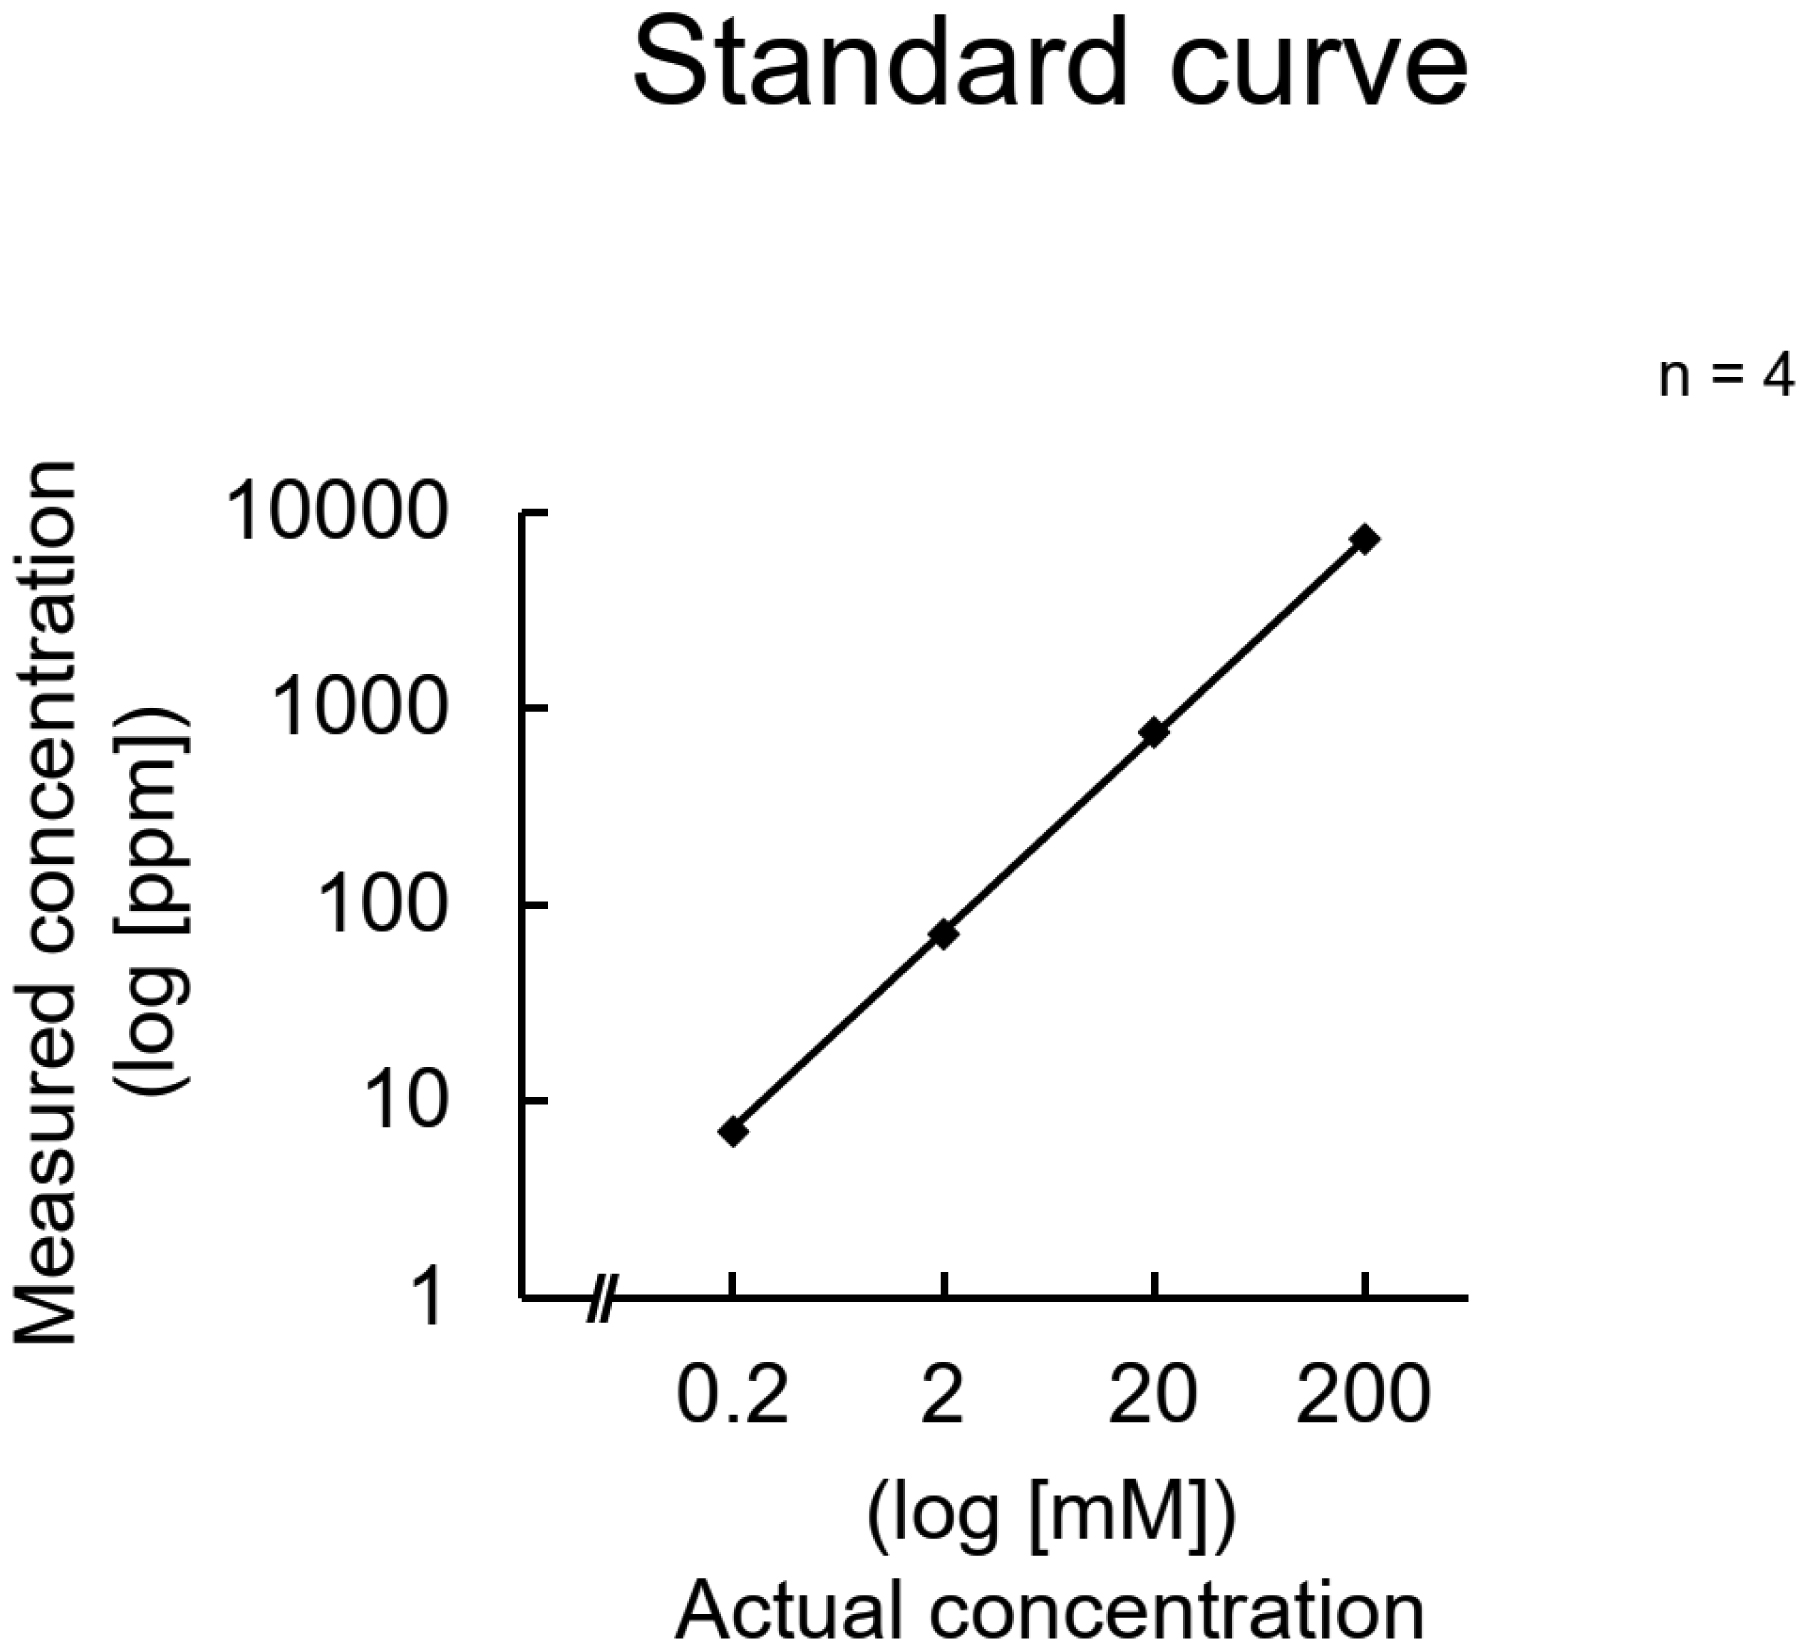
Intracellular potassium ion (K+) concentration is higher than extracellular K+ concentration. Some cells maintain intracellular potassium levels by taking up extracellular potassium. However, investigating these details requires techniques to measure intracellular potassium concentrations. We established a method to easily measure intracellular potassium concentrations using a simpler electrode. The LAQUAtwin K-11 was capable of linearly quantifying potassium concentrations and was not affected by cellular constituents other than nucleic acids; however, it did not tolerate low temperatures. Interference caused by a high concentration of nucleic acids was eliminated by the addition of cations. It was also suggested that the concentration of nucleic acids in the cell suspension was not sufficiently high to interfere with the measurements. Intracellular potassium concentrations increased and decreased in response to extracellular potassium concentrations. Exposure to valinomycin did not decrease the potassium concentration, suggesting that re-uptake of the potassium released outside the cells occurred immediately. Additionally, potassium concentrations could be measured in the brain tissue homogenates using the device. This measurement method can track the relative changes in potassium concentration in cells under various conditions and in tissues of various disease models.
Citation: Takaya Iwamoto, Minori Fujita, Yukiko Futamata, Teruki Okada, Ryuta Morinaga, Airi Nishi, Toshihiko Kinjo, Koichi Kawada, Kyosuke Uno, Nobuyuki Kuramoto. Establishment of a method to measure the intracellular potassium ion concentration of brain tissue using a simple device[J]. AIMS Neuroscience, 2024, 11(3): 275-288. doi: 10.3934/Neuroscience.2024018
Intracellular potassium ion (K+) concentration is higher than extracellular K+ concentration. Some cells maintain intracellular potassium levels by taking up extracellular potassium. However, investigating these details requires techniques to measure intracellular potassium concentrations. We established a method to easily measure intracellular potassium concentrations using a simpler electrode. The LAQUAtwin K-11 was capable of linearly quantifying potassium concentrations and was not affected by cellular constituents other than nucleic acids; however, it did not tolerate low temperatures. Interference caused by a high concentration of nucleic acids was eliminated by the addition of cations. It was also suggested that the concentration of nucleic acids in the cell suspension was not sufficiently high to interfere with the measurements. Intracellular potassium concentrations increased and decreased in response to extracellular potassium concentrations. Exposure to valinomycin did not decrease the potassium concentration, suggesting that re-uptake of the potassium released outside the cells occurred immediately. Additionally, potassium concentrations could be measured in the brain tissue homogenates using the device. This measurement method can track the relative changes in potassium concentration in cells under various conditions and in tissues of various disease models.

| [1] | Viera AJ, Wouk N (2015) Potassium disorders: hypokalemia and hyperkalemia. Am Fam Phys 92: 487-495. |
| [2] |
Weiss JN, Qu Z, Shivkumar K (2017) Electrophysiology of hypokalemia and hyperkalemia. Circ Arrhythm Electrophysiol 10: e004667. https://doi.org/10.1161/CIRCEP.116.004667 
|
| [3] |
Espay AJ (2014) Neurologic complications of electrolyte disturbances and acid-base balance. Handb Clin Neurol 119: 365-382. https://doi.org/10.1016/B978-0-7020-4086-3.00023-0
|
| [4] | Bia MJ, DeFronzo RA (1981) Extrarenal potassium homeostasis. Am J Physiol 240: F257-F268. https://doi.org/10.1152/ajprenal.1981.240.4.F257 |
| [5] |
Kinjo T, Ashida Y, Higashi H, et al. (2018) Alleviation by GABAB receptors of neurotoxicity mediated by mitochondrial permeability transition pore in cultured murine cortical neurons exposed to N-methyl-D-aspartate. Neurochem Res 43: 79-88. https://doi.org/10.1007/s11064-017-2311-z
|
| [6] |
Higashi H, Kinjo T, Uno K, et al. (2020) Regulatory effects associated with changes in intracellular potassium level in susceptibility to mitochondrial depolarization and excitotoxicity. Neurochem Int 133: 104627. https://doi.org/10.1016/j.neuint.2019.104627
|
| [7] |
Kuramoto N, Baba K, Gion K, et al. (2003) Xenobiotic response element binding enriched in both nuclear and microsomal fractions of rat cerebellum. J Neurochem 85: 264-273. https://doi.org/10.1046/j.1471-4159.2003.01679.x
|
| [8] |
Murakami S, Kurachi Y (2016) Mechanisms of astrocytic K+ clearance and swelling under high extracellular K+ concentrations. J Physiol Sci 66: 127-142. https://doi.org/10.1007/s12576-015-0404-5
|
| [9] |
Marynick DS, Schaefer HF (1975) Theoretical studies of metal-phosphate interactions: interaction of Li+, Na+, K+, Be++, Mg++, and Ca++ with H2PO4- and (CH3O)2PO2-: implications for nucleic acid solvation. Proc Natl Acad Sci U S A 72: 3794-3798. https://doi.org/10.1073/pnas.72.10.3794
|
| [10] | Preston RR, Wilson TE (2019) Lippincott® Illustrated Reviews: Physiology (Lippincott Illustrated Reviews Series) 2nd edn. Wolters Kluwer: Unit 1: principles of physiologic function, Chapter 3: Osmosis and body fluids . |
| [11] | Gregerson KA, Golesorkhi N, Chuknyiska R (1994) Stimulation of prolactin release by dopamine withdrawal: role of membrane hyperpolarization. Am J Physiol 267: E781-E788. https://doi.org/10.1152/ajpendo.1994.267.5.E781 |
| [12] |
Felber SM, Brand MD (1982) Valinomycin can depolarize mitochondria in intact lymphocytes without increasing plasma membrane potassium fluxes. FEBS Lett 150: 122-124. https://doi.org/10.1016/0014-5793(82)81317-3
|
| [13] | Higashi H, Ashida Y, Taniguchi T, et al. (2017) Na+/K+-ATPase activity is largely unrelated to proliferation of P19 embryonic stem cells. Glob Drugs Therap 2: 1-8. https://doi.org/10.15761/GDT.1000S1006 |
| [14] |
Chandna SM, Da Silva-Gane M, Marshall C, et al. (2011) Survival of elderly patients with stage 5 CKD: comparison of conservative management and renal replacement therapy. Nephrol Dial Transplant 26: 1608-1614. https://doi.org/10.1093/ndt/gfq630
|


Figures(7)

Takaya Iwamoto, Minori Fujita, Yukiko Futamata, Teruki Okada, Ryuta Morinaga, Airi Nishi, Toshihiko Kinjo, Koichi Kawada, Kyosuke Uno, Nobuyuki Kuramoto. Establishment of a method to measure the intracellular potassium ion concentration of brain tissue using a simple device[J]. AIMS Neuroscience, 2024, 11(3): 275-288. doi: 10.3934/Neuroscience.2024018


 DownLoad: